


 |
市場調查報告書
商品編碼
2063842
AI訓練GPU:市佔率分析、產業趨勢與統計及成長預測(2026-2031年)AI Training GPU - Market Share Analysis, Industry Trends & Statistics, Growth Forecasts (2026 - 2031) |
||||||

※ 本網頁內容可能與最新版本有所差異。詳細情況請與我們聯繫。
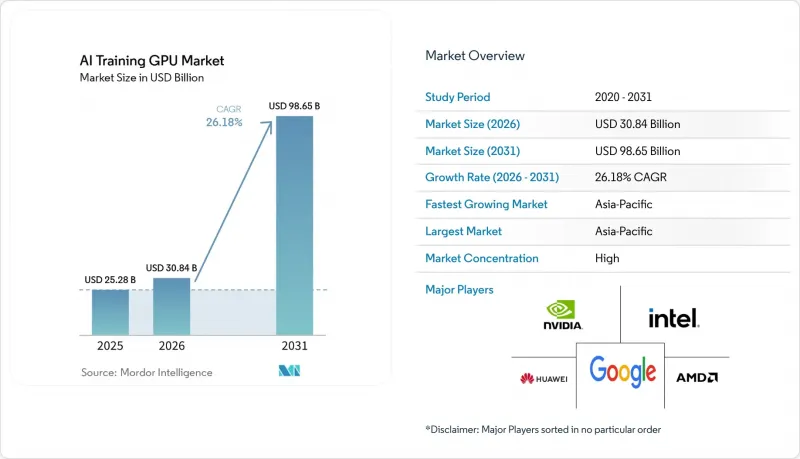
根據 Mordor Intelligence 預測,用於 AI 訓練的 GPU 市場規模預計將從 2025 年的 252.8 億美元成長到 2026 年的 308.4 億美元,並將從 2026 年到 2031 年以 26.18% 的複合年成長率,到 2031 億美元。
本報告按部署環境(超大規模/雲端、企業、政府/研究機構)、記憶體類型(HBM [HBM2e、HBM3 等] 和 GDDR)、互連和擴展(單 GPU、多 GPU(節點內)等)、最終用途訓練工作負載(基礎模型/LLM、電腦視覺、語音/NLP 模型等)以及地區進行細分。市場預測以美元 (USD) 為單位。
全球人工智慧訓練GPU市場趨勢及洞察
生成式人工智慧在企業工作負載的廣泛應用
為了保護資料、降低基於 API 的推理成本,並利用特定產業語料庫最佳化模型,企業在 2025 年和 2026 年將訓練叢集遷移到了本地。據戴爾科技集團稱,超過 4000 家 AI Factory 客戶正在採購 8 至 32 個 GPU 的系統,用於醫療保健、金融和法律等應用場景。專業服務公司正在為內部專案部署 NVIDIA GB300 NVL72 機架,這將推動企業需求從 2023 年的微不足道成長到 2025 年的個位數市場佔有率。雖然每個機架三年的總擁有成本 (TCO) 在 200 萬美元到 500 萬美元之間,但與第三方收費模式下每個代幣每年可能超過 50 萬美元的成本相比,企業認為這筆支出是合理的。這種經濟優勢正在推動混合架構的發展,將敏感工作負載保留在防火牆後,同時將不太重要的作業部署到雲端。因此,提供靈活授權和多租戶支援的 GPU 供應商正在逐步擴大其市場佔有率。
對超大規模人工智慧訓練基礎設施的投資迅速成長
微軟、Google、亞馬遜、Meta 和Oracle宣布,到 2027 年,他們將總合約 7,000 億美元用於人工智慧基礎設施建設,其中 40-50% 將用於訓練叢集。光是Oracle和 OpenAI 在德克薩斯州的「木星計畫」(Project Jupiter)預算就高達 1,650 億美元,並計畫到 2030 年部署超過 100 萬個 GPU。目前,容量預訂已延伸至未來數年,運轉率目標也已提高到 70-80%,遠超過 2023 年的水準。 Applied Digital 和 IREN 等獨立供應商已簽署數十億美元的租賃協議,提供 GPU 即服務 (GPUaaS) 容量,這凸顯了超大規模需求的持續成長。向預購容量的轉變將縮短空閒時間緩衝,提高基準消耗量,從而穩步推動 2026 年至 2028 年 GPU 出貨量的成長。
先進包裝能力永續供應鏈的限制因素
2025年,台積電的CoWoS生產線已滿載運作。這是因為GPU、HPC和網路領域的需求總合超過了產能約三分之一。前置作業時間延長至12-18個月,迫使供應商優先向簽訂多年合約的超大規模超大規模資料中心業者交付,導致普通企業的交貨週期延長至多9個月。目前計劃在2026年將CoWoS產能提高50%,並在2028年加倍,但每條新生產線的成本預計在10億至15億美元之間,而且設備認證也需要很長時間。由於三星的「I-Cube」和英特爾的「Foveros」等競爭技術尚未被第三方大規模生產,因此供應短缺的情況在2027年之前不太可能得到顯著緩解。這套頸部意味著,儘管潛在需求能夠支撐50-60%的成長,但年出貨量成長率仍維持在30%左右,這使得那些已鎖定供應佔有率的超大規模資料中心業者獲得了結構性優勢。
細分市場分析
預計到2025年,超大規模和雲端部署將佔人工智慧訓練GPU市場收入的70.27%,這反映了每天部署超過1萬個GPU的叢集的趨勢。然而,企業級市場也在迎頭趕上,在內部微調工作負載不斷成長的推動下,預計到2031年將以26.71%的複合年成長率成長。隨著越來越多的企業權衡智慧財產權管理與雲端成本,企業級人工智慧訓練GPU市場預計將穩定成長。政府和研究機構的需求也在不斷成長,這既源於國家需求,也推動了基本客群的多元化。
採購模式差異顯著。超大規模資料中心業者通常會購買多年期的GPU和HBM顯存,從而獲得優惠價格和供不應求時的配額保障。而企業則傾向於購買現貨庫存,這通常需要支付30%的附加費,前置作業時間較長。政府競標擴大要求本地組裝,這使得合約傾向於主要企業,並限制了受出口限制的供應商的商機。這種兩極化導致了平行供應鏈的形成,全球供應商必須妥善管理這些供應鏈,才能在不違反許可規定的前提下維持收入成長。
預計到2025年,配備HBM顯存的加速器將佔據53.47%的市場佔有率,大幅降低目前主要用於傳統視覺和建議模型的GDDR產品的市場佔有率。 HBM3e的推出推高了平均售價,進一步鞏固了配備HBM顯存的顯示卡在AI訓練GPU市場的主導地位。預計該市場在預測期內將以26.98%的複合年成長率成長。預計到2031年,該細分市場將保持主導地位。 HBM供應鏈由SK海力士、三星和美光三大供應商主導,形成寡占的市場結構,從而確保了這些公司穩定的利潤率。
儘管基於 GDDR 的 GPU 仍然能夠支援參數較少的工作負載,但軟體開發團隊越來越傾向於採用統一的 HBM 堆疊。這種轉變源自於避免雙最佳化流程所帶來的複雜性和低效性的需求。 HBM4 樣品預計將於 2027 年底開始出貨,屆時每個封裝的頻寬預計將達到約 2 TB/s,這將進一步加劇市場上的高階定價趨勢。無法獲得足夠 HBM 配額的供應商將面臨市場佔有率流失的風險,尤其是在變壓器模型中的參數數量超過 1000 億的情況下。在這種情況下,記憶體頻寬成為影響訓練時間的關鍵因素,其重要性甚至超過了計算密度。
區域分析
預計到2025年,亞太地區將佔全球收入的67.43%,並在2031年之前維持26.59%的複合年成長率。受美國出口限制的影響,中國正在加快國內加速器應用,華為的Ascend 910B和Biren BR104約佔國內需求的四分之一。日本2兆美元(132億美元)的計劃和印度12.3億美元的項目為成長奠定了基礎,而韓國則利用其內存供應能力來談判具有競爭力的捆綁價格。新加坡和馬來西亞憑藉有利的政策框架、稅收優惠和海底光纜接入,正在崛起為區域資料中心中心。
北美仍然是超大規模投資的中心。資本密集度依然很高,這主要得益於Oracle和OpenAI在德克薩斯州投資1,650億美元的「木星計畫」(Project Jupiter)以及微軟Azure AI區域的擴張。與歐洲相比,低成本的水力發電、核能和天然氣發電具有成本優勢,歐洲的電價可能是美國平均的三倍。加拿大投資8.9億加元(約6.5億美元)的主權計算項目正在建立區域處理能力,而墨西哥則正在吸引近岸投資,用於西班牙語模型訓練工作負載。
儘管歐洲在絕對數量上落後於世界其他地區,但它正透過歐洲高效能運算聯盟(EuroHPC)70億歐元(75億美元)的百億億百萬兆級縮小差距。德國和法國正在其國家實驗室新增超過1萬個GPU叢集,而英國5億英鎊(6.3億美元)的人工智慧研究資源確保了國內訓練運算資源的可用性。歐盟人工智慧法律的監管負擔可能會將需求集中在能夠承擔合規成本的大規模機構。總體而言,區域支出仍然集中,但政府資助的項目正在逐步平衡這種局面,這些項目正在實現採購多元化。
其他好處:
- Excel格式的市場預測(ME)表
- 3個月的分析師支持
目錄
第1章:引言
- 研究假設和市場定義
- 調查範圍
第2章:調查方法
第3章執行摘要
第4章 市場狀況
- 市場概覽
- 市場促進因素
- 生成式人工智慧在企業工作負載的普及
- 對超大規模人工智慧訓練基礎設施的投資迅速成長
- 向先進的 HBM3 和 HBM3e 記憶體堆疊的轉變將推高 GPU 的平均售價 (ASP)。
- NVLink 和 CXL 等廠商中立、開放的互連標準的整合。
- 政府主導的人工智慧舉措的擴展正在推動政府採購。
- 高TDP訓練GPU水冷技術的標準化
- 市場限制因素
- 先進包裝生產能力中永續供應鏈的限制因素
- 叢集規模GPU部署中總擁有成本(TCO)不斷上升
- 對銷往中國和中東的高階GPU的地緣政治出口限制
- 來自客製化人工智慧加速器和專用積體電路的競爭日益激烈。
- 宏觀經濟因素對市場的影響
- 產業價值鏈分析
- 監理情勢
- 技術展望
- 波特五力分析
第5章 市場規模與成長預測
- 按部署環境
- 超大規模/雲
- 公司
- 政府和研究機構
- 按記憶體類型
- HBM
- HBM2e
- HBM3
- HBM3e
- HBM4
- GDDR 基礎
- 低階訓練/傳統
- HBM
- 按類型互連和擴展
- 單GPU
- 多GPU(節點內)
- 叢集規模(多節點)
- 按最終用途分類的培訓工作負載
- 基礎模型/LLM培訓
- 電腦視覺學習
- 語音和自然語言處理模型
- 建議系統/圖模型
- 按地區
- 北美洲
- 美國
- 加拿大
- 墨西哥
- 歐洲
- 德國
- 英國
- 法國
- 義大利
- 其他歐洲國家
- 亞太地區
- 中國
- 日本
- 韓國
- 印度
- 東南亞
- 其他亞太國家
- 南美洲
- 中東
- 非洲
- 北美洲
第6章 競爭情勢
- 市場集中度
- 策略趨勢
- 市佔率分析
- 公司簡介
- NVIDIA Corporation
- Advanced Micro Devices Inc.
- Intel Corporation
- Baidu Inc.
- Huawei Technologies Co., Ltd.
- Graphcore Ltd.
- Cerebras Systems Inc.
- Alibaba Group Holding Limited
- Google LLC
- Amazon.com Inc.
- Meta Platforms Inc.
- Microsoft Corporation
- SambaNova Systems Inc.
- Tenstorrent Inc.
- Qualcomm Incorporated
- Tesla Inc.
- Fujitsu Limited
- IBM Corporation
- Hewlett Packard Enterprise Company
- Giga Computing Technology(GIGABYTE)
第7章 市場機會與未來展望
According to Mordor Intelligence, the aI training gPU market size is expected to grow from USD 25.28 billion in 2025 to USD 30.84 billion in 2026 and is forecast to reach USD 98.65 billion by 2031 at a 26.18% CAGR over 2026-2031.
This report is Segmented by Deployment Environment (Hyperscale/Cloud, Enterprise, and Government and Research), Memory Type (HBM [HBM2e, HBM3, and More], and GDDR-Based), Interconnect and Scaling (Single GPU, Multi-GPU Intra-Node, and More), End-Use Training Workload (Foundation Models/LLM, Computer Vision, Speech/NLP Models, and More), and Geography. The Market Forecasts are Provided in Terms of Value (USD).
Global AI Training GPU Market Trends and Insights
Widespread Adoption Of Generative AI In Enterprise Workloads
Enterprises moved training clusters on-premises in 2025 and 2026 to protect proprietary data, cut API-based inference charges, and fine-tune models on sector-specific corpora. Dell Technologies reported that more than 4,000 AI Factory customers have purchased 8-GPU to 32-GPU systems across healthcare, finance, and legal use cases. Professional-services firms installed NVIDIA GB300 NVL72 racks for internal projects, pushing enterprise demand from a negligible base in 2023 to high-single-digit market contribution by 2025. Three-year total cost of ownership per rack runs USD 2-5 million, yet organizations rationalize the spend against potential annual per-token fees that exceed USD 0.5 million under third-party billing models. The economics encourage hybrid architectures that keep sensitive workloads behind the firewall while bursting less-critical jobs to the cloud. GPU vendors that provide flexible licensing and multi-tenancy support are therefore winning incremental share.
Rapid Scaling Of Hyperscale AI Training Infrastructure Investments
Microsoft, Google, Amazon, Meta, and Oracle collectively signaled roughly USD 700 billion of capital outlays for AI infrastructure through 2027, with 40-50% earmarked for training clusters. Oracle and OpenAI's Project Jupiter in Texas alone carries a USD 165 billion budget and plans to install more than 1 million GPUs before 2030. Capacity reservations now span multiple years, so utilization targets have risen into the 70-80% range, well above 2023 levels. Independent providers such as Applied Digital and IREN secured multi-billion-dollar lease commitments to furnish GPU-as-a-service capacity, confirming sustained hyperscale demand. The pivot to pre-purchased capacity compresses idle-time buffers and increases baseline consumption, driving consistent pull-through for GPU shipments across 2026-2028.
Persistent Supply-Chain Constraints In Advanced Packaging Capacity
TSMC's CoWoS lines operated at full utilization in 2025 because GPU, HPC, and networking demand collectively exceeded capacity by roughly one-third. Lead times stretched to 12-18 months, forcing vendors to prioritize deliveries to hyperscalers with multiyear commitments and leaving enterprises with delays of up to nine months. Plans to boost CoWoS output by 50% during 2026 and to double it by 2028 are underway, but each new line costs USD 1-1.5 billion and requires lengthy equipment qualification. Competing approaches such as Samsung's I-Cube and Intel's Foveros have yet to reach third-party high-volume manufacturing, so tightness is unlikely to ease meaningfully before 2027. The bottleneck caps annual shipment growth at mid-30% even though potential demand supports 50-60%, granting hyperscalers with locked-in allocations a structural advantage.
Other drivers and restraints analyzed in the detailed report include:
- Transition To Advanced HBM3 And HBM3e Memory Stacks Boosting GPU ASPs
- Proliferation Of Sovereign AI Initiatives Driving Government Procurement
- Rising Total Cost Of Ownership For Cluster-Scale GPU Deployments
For complete list of drivers and restraints, kindly check the Table Of Contents.
Segment Analysis
Hyperscale and cloud installations accounted for 70.27% of 2025 revenue in the AI Training GPU market, reflecting routine deployments of clusters with more than 10,000 GPUs. Enterprises, however, are catching up, advancing at a 26.71% CAGR through 2031 as internal fine-tuning workloads grow. The AI Training GPU market size for enterprise buyers is forecast to expand steadily as more organizations weigh intellectual property control against cloud costs. Government and research institutions, supported by sovereign mandates, are layering incremental demand that diversifies the customer base.
Procurement patterns differ sharply. Hyperscalers lock in multi-year GPU and HBM supply, thereby capturing favorable pricing and guaranteed allocation during shortages. Enterprises often purchase spot inventory, which comes with 30% surcharges and longer lead times. Government tenders increasingly stipulate local assembly, steering contracts toward regional champions and limiting the addressable opportunity for export-constrained vendors. This bifurcation creates parallel supply chains that global suppliers must manage to sustain revenue growth without breaching licensing regimes.
HBM-equipped accelerators accounted for 53.47% of the 2025 value, significantly reducing the market share of GDDR products, which are now primarily used for legacy vision and recommendation models. The introduction of HBM3e into mass production led to a sharp increase in average selling prices, further solidifying the dominance of HBM-based cards in the AI Training GPU market with a CAGR of 26.98% over the forecast period. This segment is projected to maintain its leadership in the value mix through 2031. The HBM supply chain is controlled by three key suppliers, SK hynix, Samsung, and Micron, creating an oligopolistic market structure that ensures stable margins for these players.
While GDDR GPUs continue to serve smaller-parameter workloads, software development teams are increasingly preferring a unified HBM stack. This shift is driven by the need to avoid the complexities and inefficiencies associated with dual optimization flows. The anticipated sampling of HBM4 in late 2027 is expected to push per-package bandwidth to approximately 2 TB/s, reinforcing the trend of premium pricing in the market. Vendors that fail to secure sufficient HBM allocations risk losing market share, especially as transformer model sizes exceed 100 billion parameters. In such scenarios, memory bandwidth becomes the critical factor influencing training times, overtaking compute density in importance.
Geography Analysis
Asia-Pacific contributed 67.43% of global 2025 revenue and is forecast to sustain a 26.59% CAGR through 2031. China accelerated domestic adoption of accelerators after U.S. export controls, with Huawei's Ascend 910B and Biren BR104 capturing roughly one-quarter of internal demand. Japan's JPY 2 trillion (USD 13.2 billion) program and India's USD 1.23 billion mission underpin growth, while South Korea leverages memory-supply muscle to negotiate competitive bundle pricing. Singapore and Malaysia are emerging as regional data center hubs thanks to supportive policy frameworks, tax incentives, and access to subsea cables.
North America remains the epicenter of hyperscale outlays. Oracle and OpenAI's USD 165 billion Project Jupiter in Texas and Microsoft's expansion of Azure AI regions keep capital intensity high. Lower-cost hydroelectric, nuclear, and gas power enables favorable total-cost economics compared with Europe, where electricity can cost 3 times the U.S. average. Canada's CAD 890 million (USD 650 million) sovereign compute project is building regional capacity, while Mexico is attracting nearshore investments for Spanish-language model training workloads.
Europe trails in absolute value yet is closing the gap through the EuroHPC Joint Undertaking's EUR 7 billion (USD 7.5 billion) exascale initiative. Germany and France are adding 10,000-plus GPU clusters at national labs, and the United Kingdom's GBP 500 million (USD 630 million) AI Research Resource ensures domestic access to training compute. Regulatory overhead from the EU AI Act may consolidate demand among larger institutions that can absorb compliance costs. Overall, geographic spending remains concentrated but increasingly balanced by sovereign-funded projects that diversify procurement.
- NVIDIA Corporation
- Advanced Micro Devices Inc.
- Intel Corporation
- Baidu Inc.
- Huawei Technologies Co., Ltd.
- Graphcore Ltd.
- Cerebras Systems Inc.
- Alibaba Group Holding Limited
- Google LLC
- Amazon.com Inc.
- Meta Platforms Inc.
- Microsoft Corporation
- SambaNova Systems Inc.
- Tenstorrent Inc.
- Qualcomm Incorporated
- Tesla Inc.
- Fujitsu Limited
- IBM Corporation
- Hewlett Packard Enterprise Company
- Giga Computing Technology (GIGABYTE)
Additional Benefits:
- The market estimate (ME) sheet in Excel format
- 3 months of analyst support
TABLE OF CONTENTS
1 INTRODUCTION
- 1.1 Study Assumptions and Market Definition
- 1.2 Scope of the Study
2 RESEARCH METHODOLOGY
3 EXECUTIVE SUMMARY
4 MARKET LANDSCAPE
- 4.1 Market Overview
- 4.2 Market Drivers
- 4.2.1 Widespread Adoption of Generative AI in Enterprise Workloads
- 4.2.2 Rapid Scaling of Hyperscale AI Training Infrastructure Investments
- 4.2.3 Transition to Advanced HBM3 and HBM3e Memory Stacks Boosting GPU ASPs
- 4.2.4 Vendor-Neutral Open Interconnect Standards like NVLink-CXL Convergence
- 4.2.5 Proliferation of Sovereign AI Initiatives Driving Government Procurement
- 4.2.6 Emergence of Liquid Cooling as a Standard for High-TDP Training GPUs
- 4.3 Market Restraints
- 4.3.1 Persistent Supply-Chain Constraints in Advanced Packaging Capacity
- 4.3.2 Rising Total Cost of Ownership for Cluster-Scale GPU Deployments
- 4.3.3 Geopolitical Export Controls on High-End GPUs to China and Middle East
- 4.3.4 Increasing Competition from Custom AI Accelerators and ASICs
- 4.4 Impact of Macroeconomic Factors on the Market
- 4.5 Industry Value Chain Analysis
- 4.6 Regulatory Landscape
- 4.7 Technological Outlook
- 4.8 Porter's Five Forces Analysis
- 4.8.1 Bargaining Power of Suppliers
- 4.8.2 Bargaining Power of Buyers
- 4.8.3 Threat of New Entrants
- 4.8.4 Threat of Substitutes
- 4.8.5 Intensity of Competitive Rivalry
5 MARKET SIZE AND GROWTH FORECASTS (VALUE)
- 5.1 By Deployment Environment
- 5.1.1 Hyperscale / Cloud
- 5.1.2 Enterprise
- 5.1.3 Government and Research
- 5.2 By Memory Type
- 5.2.1 HBM
- 5.2.1.1 HBM2e
- 5.2.1.2 HBM3
- 5.2.1.3 HBM3e
- 5.2.1.4 HBM4
- 5.2.2 GDDR-based
- 5.2.2.1 Low-End Training / Legacy
- 5.2.1 HBM
- 5.3 By Interconnect and Scaling
- 5.3.1 Single GPU
- 5.3.2 Multi-GPU (Intra-node)
- 5.3.3 Cluster-Scale (Multi-node)
- 5.4 By End-Use Training Workload
- 5.4.1 Foundation Models / LLM Training
- 5.4.2 Computer Vision Training
- 5.4.3 Speech / NLP Models
- 5.4.4 Recommendation Systems / Graph Models
- 5.5 By Geography
- 5.5.1 North America
- 5.5.1.1 United States
- 5.5.1.2 Canada
- 5.5.1.3 Mexico
- 5.5.2 Europe
- 5.5.2.1 Germany
- 5.5.2.2 United Kingdom
- 5.5.2.3 France
- 5.5.2.4 Italy
- 5.5.2.5 Rest of Europe
- 5.5.3 Asia-Pacific
- 5.5.3.1 China
- 5.5.3.2 Japan
- 5.5.3.3 South Korea
- 5.5.3.4 India
- 5.5.3.5 Southeast Asia
- 5.5.3.6 Rest of Asia-Pacific
- 5.5.4 South America
- 5.5.5 Middle East
- 5.5.6 Africa
- 5.5.1 North America
6 COMPETITIVE LANDSCAPE
- 6.1 Market Concentration
- 6.2 Strategic Moves
- 6.3 Market Share Analysis
- 6.4 Company Profiles (includes Global Level Overview, Market Level Overview, Core Segments, Financials as available, Strategic Information, Market Rank/Share, Products and Services, Recent Developments)
- 6.4.1 NVIDIA Corporation
- 6.4.2 Advanced Micro Devices Inc.
- 6.4.3 Intel Corporation
- 6.4.4 Baidu Inc.
- 6.4.5 Huawei Technologies Co., Ltd.
- 6.4.6 Graphcore Ltd.
- 6.4.7 Cerebras Systems Inc.
- 6.4.8 Alibaba Group Holding Limited
- 6.4.9 Google LLC
- 6.4.10 Amazon.com Inc.
- 6.4.11 Meta Platforms Inc.
- 6.4.12 Microsoft Corporation
- 6.4.13 SambaNova Systems Inc.
- 6.4.14 Tenstorrent Inc.
- 6.4.15 Qualcomm Incorporated
- 6.4.16 Tesla Inc.
- 6.4.17 Fujitsu Limited
- 6.4.18 IBM Corporation
- 6.4.19 Hewlett Packard Enterprise Company
- 6.4.20 Giga Computing Technology (GIGABYTE)
7 MARKET OPPORTUNITIES AND FUTURE OUTLOOK
- 7.1 White-Space and Unmet-Need Assessment

 2026-2030年全球邊緣人工智慧加速器市場
 人工智慧加速器市場:按類型、技術、應用、最終用途、國家和地區分類-全球產業分析、市場規模及佔有率和未來預測(2026-2033)
 2026-2030年全球人工智慧加速器市場
 人工智慧訓練加速器市場分析及預測(至2035年):類型、產品類型、服務、技術、組件、應用、部署模式、最終用戶、功能
 人工智慧加速器市場預測至2034年——按加速器類型、組件、部署模式、技術、應用和區域分類的全球分析人工智慧加速器晶片市場預測至2034年-全球分析(按晶片類型、處理類型、部署類型、記憶體類型、資料中心類型、技術、應用、產業、最終用戶和地區分類)人工智慧加速器市場分析及預測(至2035年):類型、產品、技術、組件、應用、部署、最終用戶、功能、安裝配置
 2026年全球人工智慧加速器市場報告
 人工智慧加速晶片市場機會、成長要素、產業趨勢分析及預測(2026-2035年)
 人工智慧加速器市場規模、佔有率、成長及全球產業分析:按類型、應用和地區分類的洞察,2026-2034 年預測