

 |
市場調查報告書
商品編碼
2063821
顯存:市場佔有率分析、產業趨勢與統計、成長預測(2026-2031)VRAM - Market Share Analysis, Industry Trends & Statistics, Growth Forecasts (2026 - 2031) |
||||||
※ 本網頁內容可能與最新版本有所差異。詳細情況請與我們聯繫。
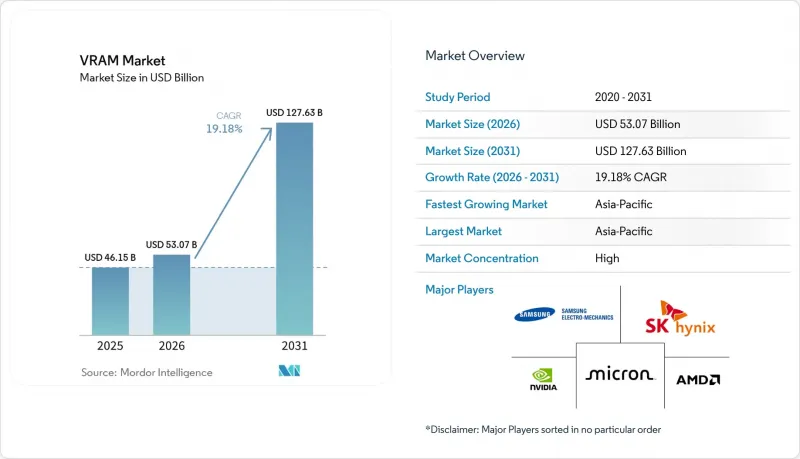
據 Mordor Intelligence 稱,2025 年 vRAM 市值為 461.5 億美元,預計到 2031 年將達到 1276.3 億美元,而 2026 年為 530.7 億美元,預測期(2026-2031 年)的複合年成長率為 19.18%。
本報告按記憶體架構(基於 GDDR 的顯存和基於 HBM 的顯存)、顯存容量(8GB 或以下、8-16GB、16-32GB、32-64GB、64GB 或以上)、應用領域(遊戲、資料中心和人工智慧、專業視覺化、邊緣人工智慧和嵌入式系統)以及以及北美地區(北美、歐洲亞地區細分、南美細分。市場預測以美元 (USD) 為單位。
全球顯存市場趨勢與洞察
超大規模資料中心人工智慧訓練工作負載的爆炸性成長
隨著大規模語言模型日益複雜,所有旗艦級的加速器都需要整合大規模的HBM記憶體堆疊。目前,單一高階GPU的記憶體成本甚至超過了其邏輯晶片的成本,而雲端服務供應商的多年容量預訂正在削弱現貨市場的柔軟性。由此帶來的需求激增賦予了記憶體製造商持續的定價權,並使VRAM市場擺脫了傳統DRAM市場的繁榮與蕭條週期。因此,對人工智慧級資料中心的資本投資正在增強HBM製造商的長期收入前景。
4K/8K遊戲和射線追蹤GPU的主流化
消費級GPU現在需要快取超高解析度紋理和資料結構以進行射線追蹤加速,這使得顯示卡的基準顯存容量提升至16GB或更高。中期主機型號的更新換代正在支援GDDR顯存的出貨,而工作站型號則將該技術擴展到96GB,以處理即時工程工作負載。 HBM顯存的供應緊張迫使供應商優先考慮利潤更高的技術棧,這間接導致GDDR顯存的供應更加緊張,並支撐了2027年底前的價格穩定。
HBM供應瓶頸和製造時間延長
堆疊式記憶體的先進封裝能力仍然是市場最大的瓶頸。建造解決此問題的新設施需要近兩年時間,之後還需要六個月或更長時間才能完成客戶認證。儘管業界已投入創紀錄的資金擴大產能,但如此漫長的周期仍然導致持續的供不應求。此外,最新HBM3E層低於70%的良率加劇了生產風險。更糟的是,為了滿足高效能需求,晶圓生產從GDDR轉向HBM,進一步收緊了中階GPU的供應,為市場帶來了新的挑戰。
細分市場分析
儘管配備 HBM 的設備在 2025 年的出貨量佔比仍然很小,但預計從 2026 年到 2031 年,其複合年成長率 (CAGR) 將達到 19.38%,成為市場成長最快的設備之一。這一成長趨勢反映了超大規模 AI 平台對Terabyte級頻寬的需求,這對於處理複雜的工作負載和大規模資料至關重要。由於 HBM 帶來的顯著效能提升,這些平台願意承擔更高的每 GB 成本。三星於 2026 年開始出貨商用 HBM4,單堆疊吞吐量達到 3.3 TB/s。這顯著拉大了 HBM 與 GDDR 等其他顯存技術的效能差距,進一步鞏固了 HBM 在高效能運算領域的地位。
GDDR技術仍保持著62.73%的市場佔有率,對於桌上遊戲、專業視覺化以及快速成長的8K內容製作等應用程式仍然至關重要。傳輸速度高達32Gbps的GDDR7的推出進一步拓展了這項技術的效用,並確保其在注重性價比的市場中持續得到應用。視訊隨機存取記憶體市場的這種多元化發展,避免了HBM在該領域的壟斷地位,並在高效能和具成本效益解決方案之間保持了平衡。
區域分析
亞太地區作為顯存(VRAM)供應鏈的製造地佔據主導地位,預計到2025年將佔全球銷售額的67.17%。該地區受惠於韓國和台灣代工廠的大量投資,這些工廠計劃在2026年投資超過1,000億美元,用於擴建其HBM潔淨室設施和先進封裝能力。這些舉措預計將使該地區維持20.14%的強勁複合年成長率。此外,印度和東南亞國家人工智慧基礎設施的快速發展正在推動當地消費,進一步促進出口主導成長,並鞏固該地區在全球顯存市場的領先地位。
儘管北美地區DRAM晶圓的國內產量很小,但如果將超大規模企業的進口量也計算在內,北美正成為最大的消費地區。 《晶片法案》(CHIPS Act)提供超過150億美元的津貼和貸款,旨在實現該地區晶圓和封裝能力的在地化。然而,預計要到2028年,產量才會顯著成長。 SK海力士已獲得4.58億美元的津貼和高達5億美元的貸款,用於在印第安納州建立先進封裝工廠。此舉旨在擴大其HBM組裝和測試能力,以縮短前置作業時間,並服務於美國的超大規模資料中心業者。同時,北美雲端服務供應商仍嚴重依賴跨太平洋供應鏈,極易受到地緣政治緊張局勢的影響。這種依賴性凸顯了供應鏈多元化對於降低潛在風險的重要性。
儘管歐洲在製造能力方面落後於全球,但對顯存(VRAM)的需求在汽車高級駕駛輔助系統(ADAS)和工業機器人等應用領域不斷成長。諸如「歐洲晶片法案」之類的舉措已撥款用於建立本地試點生產線,但大規模HBM(高密度記憶體)生產尚未開始,因此該地區對全球供應鏈的貢獻仍然有限。同時,南美洲以及中東和非洲地區,主要受遊戲和入門級專業工作負載需求的驅動,儘管供應量相對較小,但在全球顯存市場中仍穩步發展,保持著其在行業格局中的地位。
其他好處:
- Excel格式的市場預測(ME)表
- 3個月的分析師支持
目錄
第1章:引言
- 研究假設和市場定義
- 調查範圍
第2章:調查方法
第3章執行摘要
第4章 市場狀況
- 市場概覽
- 市場促進因素
- 超大規模資料中心人工智慧訓練工作負載的爆炸性成長
- 4K/8K遊戲和射線追蹤GPU的主流化
- 向 GDDR7 和 HBM3E 記憶體標準過渡
- 汽車ADAS和工業機器人領域邊緣人工智慧的發展
- 政府晶片獎勵加速國內記憶體晶圓廠建設
- 採用封裝內的記憶體運算架構以降低延遲
- 市場限制因素
- HBM供應瓶頸持續時間過長,製造時間延長。
- HBM 和傳統 GDDR 之間存在著巨大的成本差異。
- 對先進儲存技術的地緣政治出口限制
- 整合顯示卡的效能正在蠶食入門級GPU的市場。
- 宏觀經濟因素對市場的影響
- 產業價值鏈分析
- 監理情勢
- 技術展望
- 波特五力分析
第5章 市場規模與成長預測
- 依記憶體架構
- 基於GDDR的顯存
- 基於HBM的顯存
- 按顯存容量
- 8 GB 或更少
- 8~16 GB
- 16~32 GB
- 32~64 GB
- 超過 64 GB
- 透過使用
- 遊戲
- 資料中心和人工智慧
- 專業視覺化
- 邊緣人工智慧和嵌入式系統
- 按地區
- 北美洲
- 美國
- 加拿大
- 墨西哥
- 歐洲
- 英國
- 德國
- 法國
- 義大利
- 其他歐洲國家
- 亞太地區
- 中國
- 日本
- 印度
- 韓國
- 東南亞
- 其他亞太國家
- 南美洲
- 巴西
- 其他南美國家
- 中東和非洲
- 北美洲
第6章 競爭情勢
- 市場集中度
- 策略趨勢
- 市佔率分析
- 公司簡介
- Samsung Electronics Co. Ltd.
- SK Hynix Inc.
- Micron Technology Inc.
- NVIDIA Corporation
- Advanced Micro Devices Inc.
- Intel Corporation
- Qualcomm Technologies Inc.
- Taiwan Semiconductor Manufacturing Company Limited
- GLOBALFOUNDRIES Inc.
- ASE Technology Holding Co. Ltd.
- Rambus Inc.
- Cadence Design Systems Inc.
- Synopsys Inc.
- Winbond Electronics Corporation
- ChangXin Memory Technologies Inc.
- Nanya Technology Corporation
- Powerchip Semiconductor Manufacturing Corp.
- GigaDevice Semiconductor Inc.
- Arm Limited
- Kioxia Corporation
- Broadcom Inc.
- Marvell Technology Inc.
- IBM Corporation
第7章 市場機會與未來展望
According to Mordor Intelligence, the vRAM market size was valued at USD 46.15 billion in 2025 and is estimated to grow from USD 53.07 billion in 2026 to reach USD 127.63 billion by 2031, at a CAGR of 19.18% during the forecast period (2026-2031).
This report is Segmented by Memory Architecture (GDDR-Based VRAM, and HBM-Based VRAM), VRAM Capacity (≤8 GB, 8-16 GB, 16-32 GB, 32-64 GB, and Above 64 GB), Application (Gaming, Data Center and AI, Professional Visualization, and Edge AI and Embedded), and Geography (North America, Europe, Asia-Pacific, South America, and Middle East and Africa). The Market Forecasts are Provided in Terms of Value (USD).
Global VRAM Market Trends and Insights
Explosive AI Training Workloads in Hyperscale Data Centers
Rising complexity in large language models is forcing every flagship accelerator to integrate ever-larger HBM stacks. A single high-end GPU now carries memory that costs more than its logic die, and multi-year capacity reservations by cloud providers have removed spot-market flexibility. The resulting demand shock gives memory makers durable pricing power and decouples the VRAM market from historic DRAM boom-bust swings. Capital spending on AI-class data centers, therefore, reinforces long-run revenue visibility for HBM producers.
Mainstream Adoption of 4K/8K Gaming and Ray-Tracing GPUs
Consumer GPUs must now buffer ultra-high-resolution textures and ray-tracing acceleration data structures, lifting baseline card capacities to 16 GB and above. Mid-cycle console refreshes sustain a floor under GDDR shipments, while workstation variants stretch the same technology to 96 GB for real-time engineering workloads. Tight HBM supply is pushing suppliers to prioritize higher-margin stacks, indirectly tightening GDDR availability and supporting firm pricing through late 2027.
Persistent HBM Supply Bottlenecks and Long Fab Lead-Times
Advanced packaging capacity for stacked memory remains the most significant bottleneck in the market. Building new facilities to address this issue takes nearly 2 years, followed by an additional 6 months or more for customer qualification processes. This prolonged timeline has resulted in persistent shortages, even as the industry records record levels of capital investment to expand capacity. Furthermore, sub-70% yields observed in the latest HBM3E layers exacerbate production risks. To make matters worse, reallocating wafer starts from GDDR to HBM to meet high-performance demands has further constrained the availability of mid-range GPUs, creating additional challenges for the market.
Other drivers and restraints analyzed in the detailed report include:
- Transition to GDDR7 and HBM3E Memory Standards
- Edge AI Growth in Automotive ADAS and Industrial Robots
- High Cost Differential Between HBM and Conventional GDDR
For complete list of drivers and restraints, kindly check the Table Of Contents.
Segment Analysis
HBM-based devices accounted for a smaller share of shipments in 2025, yet are forecast to post a leading 19.38% CAGR between 2026 and 2031. This growth trajectory reflects hyperscale AI platforms' prioritization of terabyte-scale bandwidth, which is critical for handling complex workloads and large-scale data processing. These platforms are willing to absorb the higher cost per gigabyte due to the significant performance benefits HBM offers. Samsung began commercial HBM4 shipments in 2026, delivering 3.3 TB/s per stack, significantly widening the performance gap over GDDR alternatives and further solidifying HBM's position in high-performance computing applications.
GDDR technology, while still holding 62.73% market share, remains indispensable for applications such as desktop gaming, professional visualization, and the rapidly growing demand for 8K content creation. The introduction of GDDR7, with its up to 32 Gbps transfer rates, extends the technology's relevance and ensures its continued adoption in cost-sensitive and performance-driven markets. This diversification within the video random access memory market prevents HBM from monopolizing the segment, maintaining a balance between high-performance and cost-effective solutions.
Geography Analysis
Asia-Pacific holds a dominant position as the manufacturing backbone of the VRAM supply chain, accounting for 67.17% of the revenue share in 2025. The region benefits from the significant investments made by Korean and Taiwanese foundries, which are allocating over USD 100 billion in 2026 to expand HBM clean-room facilities and advanced packaging capabilities. These efforts are expected to help the region maintain a robust forecasted CAGR of 20.14%. Additionally, the rapid development of AI infrastructure in countries like India and Southeast Asia is driving local consumption, further supporting export-led growth and solidifying the region's leadership in the global VRAM market.
North America, despite having minimal domestic DRAM wafer production, emerges as the largest consumer block when hyperscale imports are included. The CHIPS Act, which provides over USD 15 billion in grants and loans, aims to localize wafer and packaging capacity within the region. However, significant production volumes are not anticipated before 2028. SK hynix secured USD 458 million in grants and up to USD 500 million in loans to establish an advanced packaging facility in Indiana, targeting HBM assembly and test capacity to serve U.S. hyperscalers with reduced lead times. In the meantime, North American cloud providers remain heavily dependent on trans-Pacific supply chains, which are susceptible to disruptions caused by geopolitical tensions. This reliance underscores the importance of diversifying supply sources to mitigate potential risks.
Europe, while lagging in fabrication capabilities, is witnessing a growing demand for VRAM in applications such as automotive advanced driver-assistance systems (ADAS) and industrial robotics. Initiatives like the European Chips Act have allocated funding to establish local pilot production lines, but the absence of full-scale HBM production continues to limit the region's contribution to the global supply chain. Meanwhile, South America and the Middle East and Africa contribute smaller volumes, primarily driven by demand in gaming and entry-level professional workloads. Although these regions exhibit relatively modest growth, they maintain steady progress within the global VRAM market, ensuring their relevance in the broader industry landscape.
- Samsung Electronics Co. Ltd.
- SK Hynix Inc.
- Micron Technology Inc.
- NVIDIA Corporation
- Advanced Micro Devices Inc.
- Intel Corporation
- Qualcomm Technologies Inc.
- Taiwan Semiconductor Manufacturing Company Limited
- GLOBALFOUNDRIES Inc.
- ASE Technology Holding Co. Ltd.
- Rambus Inc.
- Cadence Design Systems Inc.
- Synopsys Inc.
- Winbond Electronics Corporation
- ChangXin Memory Technologies Inc.
- Nanya Technology Corporation
- Powerchip Semiconductor Manufacturing Corp.
- GigaDevice Semiconductor Inc.
- Arm Limited
- Kioxia Corporation
- Broadcom Inc.
- Marvell Technology Inc.
- IBM Corporation
Additional Benefits:
- The market estimate (ME) sheet in Excel format
- 3 months of analyst support
TABLE OF CONTENTS
1 INTRODUCTION
- 1.1 Study Assumptions and Market Definition
- 1.2 Scope of the Study
2 RESEARCH METHODOLOGY
3 EXECUTIVE SUMMARY
4 MARKET LANDSCAPE
- 4.1 Market Overview
- 4.2 Market Drivers
- 4.2.1 Explosive AI Training Workloads in Hyperscale Data Centers
- 4.2.2 Mainstream Adoption of 4K/8K Gaming and Ray-Tracing GPUs
- 4.2.3 Transition to GDDR7 and HBM3E Memory Standards
- 4.2.4 Edge AI Growth in Automotive ADAS and Industrial Robots
- 4.2.5 Government CHIPS Incentives Accelerating Domestic Memory Fabs
- 4.2.6 On-Package Compute-in-Memory Architectures Reducing Latency
- 4.3 Market Restraints
- 4.3.1 Persistent HBM Supply Bottlenecks and Long Fab Lead-Times
- 4.3.2 High Cost Differential Between HBM and Conventional GDDR
- 4.3.3 Geopolitical Export Controls on Advanced Memory Technologies
- 4.3.4 Integrated Graphics Performance Cannibalizing Entry-Level GPUs
- 4.4 Impact of Macroeconomic Factors on the Market
- 4.5 Industry Value Chain Analysis
- 4.6 Regulatory Landscape
- 4.7 Technological Outlook
- 4.8 Porter's Five Forces Analysis
- 4.8.1 Bargaining Power of Suppliers
- 4.8.2 Bargaining Power of Buyers
- 4.8.3 Threat of New Entrants
- 4.8.4 Threat of Substitutes
- 4.8.5 Intensity of Competitive Rivalry
5 MARKET SIZE AND GROWTH FORECASTS (VALUE)
- 5.1 By Memory Architecture
- 5.1.1 GDDR-based VRAM
- 5.1.2 HBM-based VRAM
- 5.2 By VRAM Capacity
- 5.2.1 <= 8 GB
- 5.2.2 8-16 GB
- 5.2.3 16-32 GB
- 5.2.4 32-64 GB
- 5.2.5 Above 64 GB
- 5.3 By Application
- 5.3.1 Gaming
- 5.3.2 Data Center and AI
- 5.3.3 Professional Visualization
- 5.3.4 Edge AI and Embedded
- 5.4 By Geography
- 5.4.1 North America
- 5.4.1.1 United States
- 5.4.1.2 Canada
- 5.4.1.3 Mexico
- 5.4.2 Europe
- 5.4.2.1 United Kingdom
- 5.4.2.2 Germany
- 5.4.2.3 France
- 5.4.2.4 Italy
- 5.4.2.5 Rest of Europe
- 5.4.3 Asia-Pacific
- 5.4.3.1 China
- 5.4.3.2 Japan
- 5.4.3.3 India
- 5.4.3.4 South Korea
- 5.4.3.5 Southeast Asia
- 5.4.3.6 Rest of Asia-Pacific
- 5.4.4 South America
- 5.4.4.1 Brazil
- 5.4.4.2 Rest of South America
- 5.4.5 Middle East and Africa
- 5.4.1 North America
6 COMPETITIVE LANDSCAPE
- 6.1 Market Concentration
- 6.2 Strategic Moves
- 6.3 Market Share Analysis
- 6.4 Company Profiles (includes Global Level Overview, Market Level Overview, Core Segments, Financials as available, Strategic Information, Market Rank/Share, Products and Services, Recent Developments)
- 6.4.1 Samsung Electronics Co. Ltd.
- 6.4.2 SK Hynix Inc.
- 6.4.3 Micron Technology Inc.
- 6.4.4 NVIDIA Corporation
- 6.4.5 Advanced Micro Devices Inc.
- 6.4.6 Intel Corporation
- 6.4.7 Qualcomm Technologies Inc.
- 6.4.8 Taiwan Semiconductor Manufacturing Company Limited
- 6.4.9 GLOBALFOUNDRIES Inc.
- 6.4.10 ASE Technology Holding Co. Ltd.
- 6.4.11 Rambus Inc.
- 6.4.12 Cadence Design Systems Inc.
- 6.4.13 Synopsys Inc.
- 6.4.14 Winbond Electronics Corporation
- 6.4.15 ChangXin Memory Technologies Inc.
- 6.4.16 Nanya Technology Corporation
- 6.4.17 Powerchip Semiconductor Manufacturing Corp.
- 6.4.18 GigaDevice Semiconductor Inc.
- 6.4.19 Arm Limited
- 6.4.20 Kioxia Corporation
- 6.4.21 Broadcom Inc.
- 6.4.22 Marvell Technology Inc.
- 6.4.23 IBM Corporation
7 MARKET OPPORTUNITIES AND FUTURE OUTLOOK
- 7.1 White-Space and Unmet-Need Assessment
 混合儲存立方體和高頻寬儲存市場:按儲存類型、容量、外形規格、技術、產品類型、應用、國家和地區分類-全球產業分析、市場規模、市場佔有率及2026年至2033年預測高頻寬記憶體(HBM)市場:全球產業分析、市場規模、市場佔有率及按處理器類型、單堆疊記憶體容量、技術、應用、國家和地區分類的預測-2026年至2033年
 2034年HBM平台市場預測-按平台類型、記憶標準、應用和地區分類的全球分析高頻寬記憶體 (HBM) 和先進記憶體介面市場:預測(至 2034 年)—按記憶體類型、介面技術、應用和地區分類的全球分析高頻寬記憶體市場預測至2034年-按記憶體類型、產品類型、封裝技術、容量、應用、最終用戶和地區分類的全球分析
 混合儲存立方體市場規模、佔有率、趨勢和預測:按產品、應用、最終用戶產業和地區分類,2026-2034 年
 2026年全球高頻寬記憶體(HBM)市場報告2026年混合儲存立方體(HMC)全球市場報告
 HBM晶片市場按類型、儲存容量、介面類型、應用和最終用戶產業分類-2026-2032年全球預測
 混合記憶體立方體市場-全球產業規模、佔有率、趨勢、機會和預測,按產品類型、應用(高效能運算、網路、資料中心和圖形)、地區和競爭格局分類,2021-2031年預測