


 |
市場調查報告書
商品編碼
2063364
NPK複合肥料:市佔率分析、產業趨勢與統計、成長預測(2026-2031年)NPK Fertilizers - Market Share Analysis, Industry Trends & Statistics, Growth Forecasts (2026 - 2031) |
||||||
※ 本網頁內容可能與最新版本有所差異。詳細情況請與我們聯繫。
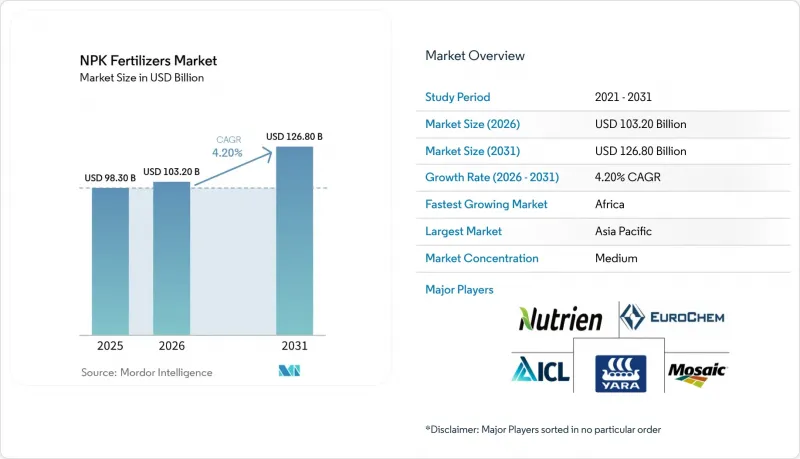
根據 Mordor Intelligence 預測,nPK 肥料市場規模將從 2025 年的 983 億美元和 2026 年的 1032 億美元成長到 2031 年的 1268 億美元,2026 年至 2031 年的年複合成長率(CAGR)為 4.2%。
本報告按形態(乾燥/顆粒狀、液體、水溶性粉末)、作物類型(穀物、水果和蔬菜、油籽和豆類、其他作物)、施用方法(土壤施用、施肥灌溉、葉面噴布)和地區(北美、南美、歐洲、亞太、中東和非洲)進行細分。市場預測以美元計價。
全球NPK複合肥市場趨勢及洞察
人口成長導致糧食需求激增
隨著人口成長,農業系統面臨越來越大的壓力,需要在有限的耕地上實現更高的產量,全球化肥料需求也穩定成長。根據聯合國預測,到2050年,世界人口將達到97億人。人口成長直接影響化肥的消費模式,尤其是對能夠促進作物永續生產的平衡型氮磷鉀(NPK)肥料的需求。在環境和土地利用的限制下,農民擴大採用養分高效的農業技術,以在滿足不斷成長的糧食需求的同時,保持土壤肥力。
政府獎勵促進養分利用效率的提高
在主要農業國家,政府措施正顯著促進均衡施肥和提高養分利用效率(NUE)。在印度,基於養分的補貼(NBS)計畫支持磷鉀肥的使用,旨在減少對氮肥的過度依賴。這些政策正引導農民轉向購買養分平衡的NPK複合肥。隨著全球永續性法規日益嚴格,預計這些措施將加速高效肥料產品和綜合養分管理實踐的推廣應用。
鉀和氨價格波動
氨相關肥料價格的波動持續影響複合肥市場的成本結構。根據世界銀行大宗商品市場數據,尿素價格從2026年2月的每噸472美元大幅上漲至2026年3月的每噸725.6美元,顯示其短期價格波動顯著。由於尿素直接由氨製成,這些價格波動凸顯了氮肥投入成本的不穩定性,而氮肥投入成本主要受天然氣價格波動的影響。這種波動推高了複合肥料的生產成本,加重了農民的採購負擔,擾亂了採購週期,並最終導致區域需求模式的差異。
細分市場分析
預計到2025年,液態肥料將佔據市場主導地位,市場佔有率高達61.3%,這主要得益於施肥和灌溉系統日益普及,這些系統需要完全溶解的養分和均勻分佈。液態肥料適用於高價值作物和可控農業系統,因為它們能夠實現精準施肥並減少灌溉損失。製造商也正在努力改進液態肥料的儲存、運輸和施用基礎設施,包括耐腐蝕儲存槽和計量系統。這一趨勢正在推動對液態肥料的需求,尤其是在採用精密農業和節水農業技術的地區。
由於易於操作且經濟高效,乾粉/顆粒狀肥料仍然是大規模田間作物種植的必需品。隨著種植者投資於先進的造粒技術和粒徑最佳化,預計2026年至2031年間,乾粉/顆粒狀肥料市場將以3.4%的最高複合年成長率成長。均勻的顆粒狀肥料可提高施肥精度,並與變數施肥法相容。各公司正在升級包膜和分選系統,以減少粉塵產生並提高產品一致性。能夠處理液體和顆粒狀肥料的靈活生產系統使種植者能夠適應需求和原料價格的波動。
區域分析
預計到2025年,亞太地區將佔據全球最大的市場佔有率,達到53.1%,這主要得益於印度和中國等國強勁的農業生產和高化肥消費量。該地區擁有廣大的耕地、多種作物輪作模式以及政府所推行的均衡施肥政策。隨著國內產能的擴大和整個化肥價值鏈的整合,化肥供應穩定性也不斷提高。此外,人口成長和日益成長的糧食需求持續推動化肥消費,鞏固了該地區在全球化肥消費領域的主導地位。
預計2026年至2031年間,非洲市場將以5.8%的複合年成長率(CAGR)高速成長,主要得益於化肥混合設施投資的增加和農業現代化進程的推進。各國政府和發展機構正積極推廣均衡施肥,以改善土壤健康和作物產量。擴大本地生產能力正在減少對進口的依賴,並改善化肥的取得途徑。主糧作物種植面積的擴大,以及相關農業政策的支持,正在推動非洲主要經濟體對營養解決方案的需求。
歐洲和北美是成熟的市場,其需求主要受永續性法規和政策以及注重效率的農業實踐的驅動。這些地區的環境政策鼓勵合理施肥,同時限制化學肥料的過度使用。農民擴大採用精密農業技術和改進的養分管理方法。這些趨勢正在影響消費者的購買行為,並推動對高效環保肥料產品的需求。根據國際肥料協會(IFA)預測,2024/25肥料年度全球肥料需求量約為2.01億噸,其中包括1.14億噸氮肥、4700萬噸磷肥和4000萬噸鉀肥。
其他好處:
- Excel格式的市場預測(ME)表
- 3個月的分析師支持
目錄
第1章:引言
- 研究假設和市場定義
- 調查範圍
第2章:調查方法
第3章執行摘要
第4章 市場狀況
- 市場概覽
- 市場促進因素
- 人口成長導致糧食需求激增
- 精準施肥的引進
- 特種作物向均衡氮磷鉀肥配方過渡
- 政府獎勵促進養分利用效率
- 低氧化亞氮(NPK)排碳權收入
- 從污水處理廠回收磷酸鹽
- 市場限制因素
- 鉀和氨的價格波動
- 加強尿素造粒生產線的排放法規
- 種植面積迅速轉向豆類和豆科作物
- 生物來源氮磷鉀肥替代品的興起
- 監理情勢
- 技術展望
- 波特五力分析
第5章 市場規模與成長預測
- 按形式
- 乾/顆粒狀
- 液體
- 水溶性粉末
- 按作物類型
- 穀類和穀類食品
- 水果和蔬菜
- 油籽/豆類
- 其他作物
- 透過應用方法
- 土壤施用
- 施肥和灌溉
- 葉面噴布
- 按地區
- 北美洲
- 美國
- 加拿大
- 墨西哥
- 其他北美國家
- 南美洲
- 巴西
- 阿根廷
- 其他南美國家
- 歐洲
- 德國
- 法國
- 俄羅斯
- 英國
- 其他歐洲國家
- 亞太地區
- 中國
- 印度
- 日本
- 澳洲
- 其他亞太國家
- 中東
- 沙烏地阿拉伯
- 土耳其
- 其他中東國家
- 非洲
- 奈及利亞
- 南非
- 其他非洲國家
- 北美洲
第6章 競爭情勢
- 市場集中度
- 策略趨勢
- 市佔率分析
- 公司簡介
- Yara International ASA
- Nutrien Ltd.
- The Mosaic Company
- EuroChem Group AG
- ICL Group Ltd.
- CF Industries Holdings, Inc.
- OCP SA
- K+S Aktiengesellschaft
- Coromandel International Limited
- Borealis AG
- Haifa Group
- Kingenta Ecological Engineering Group Co., Ltd.
- Public Joint Stock Company Acron
- Stanley Agriculture Group Co., Ltd.
第7章 市場機會與未來展望
According to Mordor Intelligence, the nPK fertilizers market size is projected to grow from USD 98.3 billion in 2025 and USD 103.2 billion in 2026 to USD 126.8 billion by 2031, registering a CAGR of 4.2% between 2026 and 2031.
This report is Segmented by Form (Dry/Granular, Liquid, and Water-Soluble Powder), by Crop Type (Cereals and Grains, Fruits and Vegetables, Oilseeds and Pulses, and Other Crops), by Mode of Application (Soil Broadcasting, Fertigation, Foliar Spray), and by Geography (North America, South America, Europe, Asia-Pacific, Middle East, and Africa). The Market Forecasts are Provided in Terms of Value (USD).
Global NPK Fertilizers Market Trends and Insights
Population-Driven Food-Demand Surge
Global fertilizer demand is steadily increasing as population growth places greater pressure on agricultural systems to achieve higher yields from limited arable land. According to the United Nations (UN), the global population is projected to reach 9.7 billion by 2050 . This population growth is directly impacting fertilizer consumption patterns, particularly for balanced NPK (Nitrogen, Phosphorus, and Potassium) products that promote sustainable crop productivity. Farmers are increasingly implementing nutrient-efficient practices to preserve soil fertility while addressing rising food demand amid environmental and land-use constraints.
Government Nutrient-Efficiency Incentives
Government initiatives are significantly contributing to the promotion of balanced fertilization and the enhancement of nutrient-use efficiency (NUE) in key agricultural economies. In India, the Nutrient Based Subsidy (NBS) scheme supports the use of phosphorus and potassium fertilizers, aiming to reduce the over-reliance on nitrogen-based inputs. These policies are shaping farmers' purchasing decisions toward NPK fertilizers with balanced nutrient compositions. As global sustainability regulations become more stringent, such measures are anticipated to drive the adoption of efficient fertilizer products and integrated nutrient management practices.
Potash and Ammonia Price Volatility
Fluctuations in ammonia-related fertilizer prices continue to impact cost structures in the NPK fertilizers market. According to the World Bank Commodity Markets, urea prices rose significantly from USD 472 per metric ton in February 2026 to USD 725.6 per metric ton in March 2026, indicating notable short-term volatility . Since urea is directly derived from ammonia, these price fluctuations underscore instability in nitrogen input costs, primarily influenced by changes in natural gas prices. This volatility increases production costs for NPK fertilizers, reduces affordability for farmers, and disrupts procurement cycles, ultimately resulting in inconsistent demand patterns across regions.
Other drivers and restraints analyzed in the detailed report include:
- Precision Fertilization Adoption
- Shift to Balanced NPK Blends in Specialty Crops
- Stricter Emission Rules on Urea Granulation Lines
For complete list of drivers and restraints, kindly check the Table Of Contents.
Segment Analysis
Liquid formulations led with the largest 61.3% of market share in 2025, supported by increasing adoption of fertigation systems that require fully soluble nutrients and uniform delivery. These products enable precise nutrient application and reduce losses during irrigation, making them suitable for high-value crops and controlled farming systems. Manufacturers are also improving storage, transport, and application infrastructure for liquids, including corrosion-resistant tanks and metering systems. This shift is reinforcing demand for liquid fertilizers, particularly in regions adopting precision agriculture practices and water-efficient farming techniques.
Dry/granular fertilizers remain essential for large-scale field crops due to ease of handling and cost efficiency. The dry/granular market size is projected to grow at the fastest 3.4% CAGR from 2026 to 2031 as producers invest in advanced granulation technologies and particle-size optimization. Uniform granules improve spreading accuracy and compatibility with variable rate equipment. Companies are upgrading coating and screening systems to reduce dust formation and enhance product consistency. Flexible manufacturing setups that support both liquid and granular formats are enabling producers to adapt to fluctuating demand and feedstock price dynamics.
Geography Analysis
Asia-Pacific is projected to hold the largest market share of 53.1% in 2025, driven by robust agricultural output and high fertilizer consumption in countries such as India and China. The region benefits from extensive arable land, multiple cropping cycles, and government initiatives promoting balanced fertilization. Expansion of domestic production capacity and integration across fertilizer value chains are enhancing supply stability. Additionally, the rising population and increasing food demand continue to fuel nutrient consumption, solidifying the region's leadership in global fertilizer usage.
Africa market size is projected to grow at the fastest CAGR of 5.8% from 2026 to 2031, driven by rising investments in fertilizer blending facilities and agricultural modernization. Governments and development organizations are actively promoting balanced fertilization to enhance soil health and crop productivity. The expansion of local production capacity is reducing reliance on imports and improving access to fertilizer. Growth in staple crop cultivation, coupled with supportive agricultural policies, is boosting demand for nutrient solutions across key African economies.
Europe and North America represent mature markets where demand is primarily driven by sustainability regulations and efficiency-focused farming practices. Environmental policies in these regions encourage optimized nutrient application while discouraging excessive fertilizer use. Farmers are increasingly adopting precision agriculture technologies and improved nutrient management practices. These trends are shaping purchasing behaviors and driving demand for high-efficiency, environmentally compliant fertilizer products. According to the International Fertilizer Association, global fertilizer demand reached approximately 201 million metric tons of nutrients in the 2024/25 fertilizer year, including 114 million metric tons of nitrogen, 47 million metric tons of phosphate, and 40 million metric tons of potash .
- Yara International ASA
- Nutrien Ltd.
- The Mosaic Company
- EuroChem Group AG
- ICL Group Ltd.
- CF Industries Holdings, Inc.
- OCP S.A.
- K+S Aktiengesellschaft
- Coromandel International Limited
- Borealis AG
- Haifa Group
- Kingenta Ecological Engineering Group Co., Ltd.
- Public Joint Stock Company Acron
- Stanley Agriculture Group Co., Ltd.
Additional Benefits:
- The market estimate (ME) sheet in Excel format
- 3 months of analyst support
TABLE OF CONTENTS
1 Introduction
- 1.1 Study Assumptions and Market Definition
- 1.2 Scope of the Study
2 Research Methodology
3 Executive Summary
4 Market Landscape
- 4.1 Market Overview
- 4.2 Market Drivers
- 4.2.1 Population-driven food-demand surge
- 4.2.2 Precision fertilization adoption
- 4.2.3 Shift to balanced NPK blends in specialty crops
- 4.2.4 Government nutrient-efficiency incentives
- 4.2.5 Carbon-credit revenue for low-nitrous-oxide NPKs
- 4.2.6 Phosphate recovery from wastewater plants
- 4.3 Market Restraints
- 4.3.1 Potash and ammonia price volatility
- 4.3.2 Stricter emission rules on urea granulation lines
- 4.3.3 Rapid acreage shift to pulses and legumes
- 4.3.4 Rise of biological N-P-K substitutes
- 4.4 Regulatory Landscape
- 4.5 Technological Outlook
- 4.6 Porter's Five Forces Analysis
- 4.6.1 Threat of New Entrants
- 4.6.2 Bargaining Power of Suppliers
- 4.6.3 Bargaining Power of Buyers
- 4.6.4 Threat of Substitutes
- 4.6.5 Intensity of Competitive Rivalry
5 Market Size and Growth Forecasts (Value, USD)
- 5.1 By Form
- 5.1.1 Dry/Granular
- 5.1.2 Liquid
- 5.1.3 Water-Soluble Powder
- 5.2 By Crop Type
- 5.2.1 Cereals and Grains
- 5.2.2 Fruits and Vegetables
- 5.2.3 Oilseeds and Pulses
- 5.2.4 Other Crops
- 5.3 By Mode of Application
- 5.3.1 Soil Broadcasting
- 5.3.2 Fertigation
- 5.3.3 Foliar Spray
- 5.4 By Geography
- 5.4.1 North America
- 5.4.1.1 United States
- 5.4.1.2 Canada
- 5.4.1.3 Mexico
- 5.4.1.4 Rest of North America
- 5.4.2 South America
- 5.4.2.1 Brazil
- 5.4.2.2 Argentina
- 5.4.2.3 Rest of South America
- 5.4.3 Europe
- 5.4.3.1 Germany
- 5.4.3.2 France
- 5.4.3.3 Russia
- 5.4.3.4 United Kingdom
- 5.4.3.5 Rest of Europe
- 5.4.4 Asia-Pacific
- 5.4.4.1 China
- 5.4.4.2 India
- 5.4.4.3 Japan
- 5.4.4.4 Australia
- 5.4.4.5 Rest of Asia-Pacific
- 5.4.5 Middle East
- 5.4.5.1 Saudi Arabia
- 5.4.5.2 Turkey
- 5.4.5.3 Rest of Middle East
- 5.4.6 Africa
- 5.4.6.1 Nigeria
- 5.4.6.2 South Africa
- 5.4.6.3 Rest of Africa
- 5.4.1 North America
6 Competitive Landscape
- 6.1 Market Concentration
- 6.2 Strategic Moves
- 6.3 Market Share Analysis
- 6.4 Company Profiles (Includes Global Level Overview, Market Level Overview, Core Segments, Financials as Available, Strategic Information, Market Rank/Share for Key Companies, Products and Services, and Recent Developments)
- 6.4.1 Yara International ASA
- 6.4.2 Nutrien Ltd.
- 6.4.3 The Mosaic Company
- 6.4.4 EuroChem Group AG
- 6.4.5 ICL Group Ltd.
- 6.4.6 CF Industries Holdings, Inc.
- 6.4.7 OCP S.A.
- 6.4.8 K+S Aktiengesellschaft
- 6.4.9 Coromandel International Limited
- 6.4.10 Borealis AG
- 6.4.11 Haifa Group
- 6.4.12 Kingenta Ecological Engineering Group Co., Ltd.
- 6.4.13 Public Joint Stock Company Acron
- 6.4.14 Stanley Agriculture Group Co., Ltd.
7 Market Opportunities and Future Outlook
 全球 NPK 複合肥料市場(用於飼料和食品)
 NPK複合肥市場:2026-2032年全球市場預測(依形態、作物、釋放形態、應用及通路分類)
 水溶性複合肥市場:依應用、作物和地區分類
 NPK複合肥料全球市場規模、佔有率、趨勢及成長分析報告(2026-2034年)
 2026年全球NPK複合肥料市場報告2026年全球水溶性NPK複合肥料市場報告2026年全球液態鉀肥市場報告
 水溶性複合肥市場-全球產業規模、佔有率、趨勢、機會、預測:按應用、作物類型、地區和競爭格局分類,2021-2031年
 NPK複合肥市場預測至2032年:按產品類型、形態、分銷管道、應用、最終用戶和地區分類的全球分析NPK複合肥市場-全球產業規模、佔有率、趨勢、機會及預測,依類型、形態、應用、地區及競爭格局分類,2020-2030年預測