


 |
市場調查報告書
商品編碼
2063300
碼頭和堆場管理系統:市場佔有率分析、行業趨勢和統計數據、成長預測(2026-2031 年)Dock And Yard Management Systems - Market Share Analysis, Industry Trends & Statistics, Growth Forecasts (2026 - 2031) |
||||||

※ 本網頁內容可能與最新版本有所差異。詳細情況請與我們聯繫。
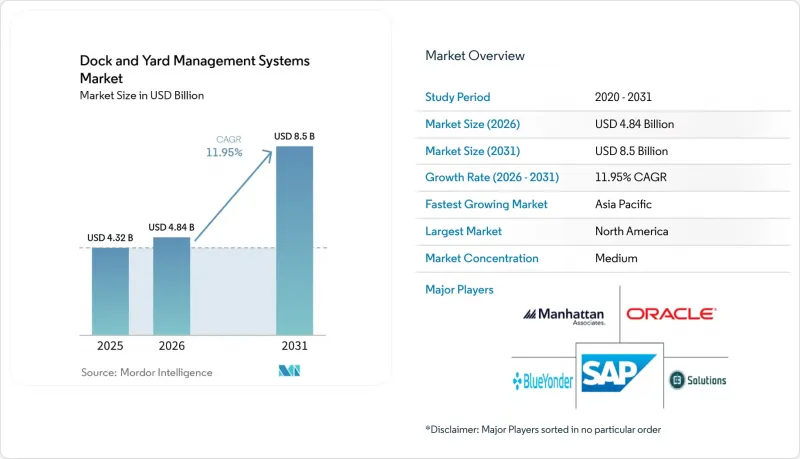
根據 Mordor Intelligence 預測,碼頭和堆場管理系統市場規模將從 2025 年的 43.2 億美元和 2026 年的 48.4 億美元成長到 2031 年的 85 億美元,2026 年至 2031 年的複合年成長率為 11.95%。
本報告按組件(軟體、硬體、服務)、部署模式(本地部署、雲端部署、混合部署)、行業(零售和電子商務、食品飲料、汽車等)、應用(裝卸貨平台調度、場地資產和拖車管理、閘門和保全行動等)以及地區進行細分。市場預測以美元(USD)為單位。
全球碼頭及堆場管理系統市場趨勢及洞察
電子商務小包裹量增加
預計2025年,全球小包裹量將達到1,210億件,屆時每日抵達零售物流中心的貨車數量將增加30%至40%。營運商正在實施動態碼頭調度系統,利用承運商的GPS資料和倉庫庫存優先級,即時重新分配泊位。亞馬遜已在2024年開設的55個履約中心引進了機器人分類系統,將從碼頭到出貨的週期縮短至45分鐘以內。沃爾瑪已在超過4000家門市部署了堆場模組,減少了12%至15%的生鮮食品浪費。隨著當日達服務成為標準,滯納金的風險也在增加,促使托運人實施預約遵守機制,對遲到行為進行處罰,並獎勵提前辦理入住手續。
遷移到即時視覺化平台
2025年的一項調查顯示,北美60%的堆場仍採用人工登記流程,這造成了資訊盲區,並影響了庫存準確性。新平台結合了GPS、RFID和電腦視覺技術,能夠即時將每輛拖車的移動情況反映到公司的系統中。 FourKites的YardWorks套件透過自動取得ID訊息,將閘口處理時間從最多7分鐘顯著縮短至90秒。 Project44和Celonis運用流程挖掘技術分析運輸數據,識別出卸貨時間長期延長20%至30%的裝卸貨位。隨著可視化功能與運輸管理系統的整合,承運商能夠接收移動警報,使爽約率降低了15%至20%。
傳統WMS/TMS整合的障礙
北美約70%的倉庫仍在運作2015年之前的WMS系統,這些系統的API功能有限。這導致倉庫管理軟體的部署需要客製化中間件,耗費專案預算的20%至30%,且跨多站點網路的部署週期長達一年。傳統的TMS平台缺乏事件驅動的通訊功能,需要供應商每隔幾分鐘輪詢更新,降低了預訂的準確性。雖然供應商正在為主流WMS套件發布標準化連接器,但小眾客製化系統仍然需要編寫定製程式碼。諸如EPCIS 2.0之類的行業標準有望帶來改進,但受成本限制的中型企業採用這些標準的速度仍然很慢。
細分市場分析
預計業務收益成長將超過碼頭和堆場管理系統市場的整體成長率(預計2026年至2031年間將增加12.38%),因為企業越來越依賴整合商進行流程映射、API配置和上運作後最佳化。軟體仍佔主導地位,憑藉經常性訂閱收入,預計2025年將佔總收入的55.53%,但雲端運算經濟正在壓縮授權利潤率,價值正向專業知識轉移。
隨著開放API將軟體與特定感測器品牌解耦,硬體市佔率持續下降。曼哈頓聯合公司提供「主動式堆場管理」服務,無需額外許可費,並透過部署支援和高級支援來實現盈利。 FoKites推出了一項託管服務,用於監控閘口吞吐量並調整演算法,而斑馬技術公司則將安裝和多年維護納入其營運費用合約中。
到2025年,雲端服務將佔總收入的60.44%,這主要得益於托運人對靈活運力和自動化升級的偏好。這一趨勢凸顯了物流業對雲端解決方案日益成長的依賴,以滿足其動態需求。然而,混合架構也正經歷顯著成長,成長速度達12.58%。這一成長主要源於運營商維護現場閘口攝影機和拖車識別推理系統,以確保亞秒級的響應時間,這對於營運效率和即時決策至關重要。
藥品低溫運輸倉庫必須遵守美國食品藥物管理局 (FDA) 21 CFR Part 11 的嚴格規定,通常會將即時資料儲存在本地以維護審計完整性。這些設施通常只在夜間將匯總資料發送到雲端,從而在監管合規性和營運效率之間取得平衡。邊緣運算在最佳化頻寬使用方面發揮著至關重要的作用。例如,一個擁有 50 個攝影機的倉庫可以將 10TB 的原始影像資料壓縮成僅 100GB 的元資料,從而顯著降低數據傳輸需求,同時確保即使在網路中斷期間也能不間斷運作。此外,Kubernetes 打包技術的進步使得容器能夠在本地或 AWS 環境中無縫運行,而無需對底層程式碼進行任何更改,從而為企業提供更大的柔軟性和可擴展性。
區域分析
預計到2025年,北美將佔全球銷售額的36.67%,這得益於DHL 20億歐元(約22.6億美元)的自動化投資和聯邦快遞59億美元的資本計畫。加州SB-415法案要求倉庫許可證的發放必須以提交詳細的貨運計畫為前提,進一步加速了自動化技術的普及。該地區對技術創新和監管措施的重視,並持續鞏固其市場地位。
亞太地區是成長最快的地區,由於對智慧倉庫的大規模投資,其成長率達到了12.67%。亞馬遜深圳履約中心透過人工智慧驅動的倉位分配和堆場自動化,將倉儲成本降低了45%;而大和控股在印度開設了一個佔地24900平方公尺的物流中心,為電商和低溫運輸客戶提供服務。在韓國,大創為其新建的物流中心簽署了一份價值6600萬美元的機器人相關合約,這表明本土零售商正在迎頭趕上跨國公司的雄心壯志。
在歐洲,隨著英國脫歐後局勢的複雜變化,工業4.0專案的採用正在加速。杜拜環球港務集團(DP World)已在倫敦門戶港的BOXBAY專案上投資1.7億歐元(約1.8億美元),旨在將卡車週轉時間縮短至60分鐘以內。同時,Swisslog和Bunting正在建造一座整合碼頭調度和低溫運輸監控功能的生鮮食品自動化倉庫。中東和非洲正受惠於沙烏地阿拉伯的「2030願景」和阿拉伯聯合大公國的物流樞紐策略,但由於基礎設施不足,南美市場仍處於發展中階段。
其他好處:
- Excel格式的市場預測(ME)表
- 3個月的分析師支持
目錄
第1章:引言
- 研究假設和市場定義
- 調查範圍
第2章:調查方法
第3章執行摘要
第4章 市場狀況
- 市場概覽
- 市場促進因素
- 電子商務小包裹處理量增加
- 遷移到即時視覺化平台
- 實施雲端原生供應鏈套件
- 監管部門努力縮短卡車週轉時間
- 人工智慧驅動的場地自動化輔助企業應對人手不足
- 將碼頭調度與ESG報告結合
- 市場限制因素
- 整合傳統WMS/TMS的挑戰
- 高昂的初始硬體成本(RFID、攝影機)
- 聯網庭院的網路安全問題
- 公司內部缺乏OT/IT整合技能
- 宏觀經濟因素對市場的影響
- 產業價值/價值鏈分析
- 監理情勢
- 技術展望
- 波特五力分析
第5章 市場規模與成長預測
- 按組件
- 軟體
- 硬體
- 服務
- 部署模式
- 現場
- 雲
- 混合
- 按行業分類
- 零售與電子商務
- 食品/飲料
- 車
- 藥品和醫療保健
- 製造和第三方物流
- 其他工業部門
- 透過使用
- 裝卸貨平台門調度
- 場地資產和拖車管理
- 門衛和安保工作
- 勞動力和資源管理
- 分析與報告
- 按地區
- 北美洲
- 美國
- 加拿大
- 墨西哥
- 歐洲
- 德國
- 英國
- 法國
- 俄羅斯
- 其他歐洲國家
- 亞太地區
- 中國
- 日本
- 印度
- 韓國
- 澳洲
- 其他亞太國家
- 中東和非洲
- 中東
- 沙烏地阿拉伯
- 阿拉伯聯合大公國
- 其他中東國家
- 非洲
- 南非
- 埃及
- 其他非洲國家
- 中東
- 南美洲
- 巴西
- 阿根廷
- 其他南美國家
- 北美洲
第6章 競爭情勢
- 市場集中度
- 策略趨勢
- 市佔率分析
- 公司簡介
- Manhattan Associates Inc.
- Oracle Corporation
- SAP SE
- Blue Yonder Group, Inc.
- C3 Solutions Inc.
- Descartes Systems Group Inc.
- Zebra Technologies Corporation
- Kaleris, Inc.
- FourKites, Inc.
- project44, Inc.
- Korber AG
- Infor, Inc.
- Yard Management Solutions LLC
- YardView, LLC
- Softeon, Inc.
- Epicor Software Corporation
- Peripass NV
- Softeon, Inc.
- Exotrac LLC
第7章 市場機會與未來展望
According to Mordor Intelligence, the dock and yard management systems market size is projected to expand from USD 4.32 billion in 2025 and USD 4.84 billion in 2026 to USD 8.50 billion by 2031, registering an 11.95% CAGR between 2026 and 2031.
This report is Segmented by Component (Software, Hardware, and Services), Deployment Mode (On-Premises, Cloud, and Hybrid), Industry Vertical (Retail and E-Commerce, Food and Beverages, Automotive, and More), Application (Dock Door Scheduling, Yard Asset and Trailer Management, Gate and Security Operations, and More), and Geography. The Market Forecasts are Provided in Terms of Value (USD).
Global Dock And Yard Management Systems Market Trends and Insights
Rising E-Commerce Parcel Volumes
Global parcel volume hit 121 billion units in 2025, lifting daily trailer arrivals at retail distribution centers by 30-40%. Operators are adopting dynamic dock scheduling that reallocates bays in real time using carrier GPS feeds and warehouse inventory priorities. Amazon equipped its 55 fulfillment centers opened in 2024 with robotic sortation, trimming dock-to-dispatch cycles to under 45 minutes. Walmart integrated yard modules across 4,000-plus stores, cutting perishable spoilage by 12-15%. Same-day fulfillment norms increase detention-fee exposure, prompting shippers to adopt appointment-compliance tools that penalize late arrivals and reward early check-ins.
Shift to Real-Time Visibility Platforms
A 2025 study found 60% of North American yards still used manual check-in processes, creating blind spots that hampered inventory accuracy. New platforms combine GPS, RFID, and computer vision so every trailer movement updates enterprise systems instantly. FourKites' YardWorks suite slashed gate processing from up to seven minutes to 90 seconds by automating ID capture. project44 and Celonis layered process mining on shipment data to uncover dock doors with chronic 20-30% longer unload times. As visibility converges with transportation management systems, carriers receive mobile alerts that reduce no-show rates by 15-20%.
Legacy WMS/TMS Integration Hurdles
Roughly 70% of North American warehouses still run pre-2015 WMS installations with limited APIs. Implementing yard software therefore requires custom middleware that can consume 20-30% of project budgets, extending rollouts to a year for multi-site networks. The absence of event-driven messaging in legacy TMS platforms forces vendors to poll for updates every few minutes, degrading appointment accuracy. Providers are releasing standardized connectors for top WMS suites, but long-tail custom systems continue to demand bespoke code. Industry standards such as EPCIS 2.0 promise relief, yet adoption remains slow among cost-constrained mid-tier operators.
Other drivers and restraints analyzed in the detailed report include:
- Adoption of Cloud-Native Supply-Chain Suites
- Regulatory Push for Truck-Turn-Time Reduction
- High Up-Front Hardware Costs (RFID, Cameras)
For complete list of drivers and restraints, kindly check the Table Of Contents.
Segment Analysis
Services revenue is set to outpace overall dock and yard management systems market growth, expanding 12.38% between 2026 and 2031 as enterprises lean on integrators for process mapping, API configuration, and post-go-live optimization. Software still dominated with 55.53% of 2025 turnover, thanks to recurring subscriptions, but cloud economics are compressing license margins and shifting value to expertise.
The share of hardware continues to decline because open APIs now decouple software from any one sensor brand. Manhattan Associates provides Active Yard Management at no extra license fee, monetizing via implementation and premium support. FourKites introduced managed services that monitor gate throughput and retune algorithms, while Zebra Technologies bundles installation and multi-year maintenance in operational-expense contracts.
In 2025, the cloud accounted for 60.44% of the revenue, driven by shippers' preference for elastic capacity and automatic upgrades. This trend highlights the increasing reliance on cloud-based solutions to meet the dynamic demands of the shipping industry. However, hybrid architectures are experiencing significant growth, expanding at a rate of 12.58%. This growth is primarily fueled by operators who maintain on-site gate cameras and trailer-ID inference systems to ensure sub-second response times, which are critical for operational efficiency and real-time decision-making.
Pharmaceutical cold-chain yards, which must comply with the stringent requirements of FDA's 21 CFR Part 11, often store real-time data locally to preserve audit integrity. These facilities typically transmit only summarized data to the cloud during overnight hours, balancing regulatory compliance with operational efficiency. Edge computing has emerged as a key enabler in optimizing bandwidth usage. For example, a yard equipped with 50 cameras can reduce 10 TB of raw video data to just 100 GB of metadata, significantly minimizing data transfer requirements while ensuring uninterrupted operations during internet outages. Additionally, advancements in Kubernetes packaging now allow containers to operate seamlessly on-premises or within AWS environments without requiring any modifications to the underlying code, offering greater flexibility and scalability for businesses.
Geography Analysis
North America accounted for 36.67% of global 2025 revenue, bolstered by DHL's EUR 2 billion (USD 2.26 billion) automation outlay and FedEx's USD 5.9 billion capital program. California's SB-415 further motivates adoption by conditioning warehouse permits on detailed truck-routing plans. The region's focus on technological advancements and regulatory measures continues to strengthen its market position.
Asia-Pacific is the fastest-growing region, with 12.67% growth, thanks to large-scale smart-warehouse investments. Amazon's Shenzhen fulfillment center cut storage costs 45% through AI-driven slotting and yard automation, and Yamato Holdings launched a 24,900 sq m hub in India to serve e-commerce and cold-chain clients. South Korea awarded USD 66 million in robotics contracts for Daiso's new distribution hub, showing that regional retailers are matching multinational ambition.
Europe's adoption of Industry 4.0 programs is accelerating amid post-Brexit complexity. DP World committed EUR 170 million (USD 180 million) for BOXBAY at London Gateway to achieve sub-60-minute truck cycles, while Swisslog and Bunting are building an automated fresh-goods warehouse that merges dock scheduling with cold-chain monitoring. The Middle East and Africa benefit from Saudi Vision 2030 and the UAE's logistics-hub strategies, whereas South America remains a nascent opportunity, limited by infrastructure gaps.
- Manhattan Associates Inc.
- Oracle Corporation
- SAP SE
- Blue Yonder Group, Inc.
- C3 Solutions Inc.
- Descartes Systems Group Inc.
- Zebra Technologies Corporation
- Kaleris, Inc.
- FourKites, Inc.
- project44, Inc.
- Korber AG
- Infor, Inc.
- Yard Management Solutions LLC
- YardView, LLC
- Softeon, Inc.
- Epicor Software Corporation
- Peripass NV
- Softeon, Inc.
- Exotrac LLC
Additional Benefits:
- The market estimate (ME) sheet in Excel format
- 3 months of analyst support
TABLE OF CONTENTS
1 INTRODUCTION
- 1.1 Study Assumptions and Market Definition
- 1.2 Scope of the Study
2 RESEARCH METHODOLOGY
3 EXECUTIVE SUMMARY
4 MARKET LANDSCAPE
- 4.1 Market Overview
- 4.2 Market Drivers
- 4.2.1 Rising E-Commerce Parcel Volumes
- 4.2.2 Shift to Real-Time Visibility Platforms
- 4.2.3 Adoption of Cloud-Native Supply-Chain Suites
- 4.2.4 Regulatory Push for Truck-Turn-Time Reduction
- 4.2.5 AI-Enabled Yard Automation for Labor-Scarce Sites
- 4.2.6 Convergence of Dock Scheduling With ESG Reporting
- 4.3 Market Restraints
- 4.3.1 Legacy WMS/TMS Integration Hurdles
- 4.3.2 High Up-Front Hardware Costs (RFID, Cameras)
- 4.3.3 Cyber-Security Concerns in Connected Yards
- 4.3.4 Shortage of In-House OT/IT Convergence Skills
- 4.4 Impact of Macroeconomic Factors on the Market
- 4.5 Industry Value / Supply-Chain Analysis
- 4.6 Regulatory Landscape
- 4.7 Technological Outlook
- 4.8 Porter's Five Forces Analysis
- 4.8.1 Threat of New Entrants
- 4.8.2 Bargaining Power of Buyers
- 4.8.3 Bargaining Power of Suppliers
- 4.8.4 Threat of Substitutes
- 4.8.5 Competitive Rivalry
5 MARKET SIZE AND GROWTH FORECASTS (VALUE)
- 5.1 By Component
- 5.1.1 Software
- 5.1.2 Hardware
- 5.1.3 Services
- 5.2 By Deployment Mode
- 5.2.1 On-Premises
- 5.2.2 Cloud
- 5.2.3 Hybrid
- 5.3 By Industry Vertical
- 5.3.1 Retail and E-Commerce
- 5.3.2 Food and Beverages
- 5.3.3 Automotive
- 5.3.4 Pharmaceutical and Healthcare
- 5.3.5 Manufacturing and 3PL
- 5.3.6 Rest of Industry Vertical
- 5.4 By Application
- 5.4.1 Dock Door Scheduling
- 5.4.2 Yard Asset and Trailer Management
- 5.4.3 Gate and Security Operations
- 5.4.4 Labor and Resource Management
- 5.4.5 Analytics and Reporting
- 5.5 By Geography
- 5.5.1 North America
- 5.5.1.1 United States
- 5.5.1.2 Canada
- 5.5.1.3 Mexico
- 5.5.2 Europe
- 5.5.2.1 Germany
- 5.5.2.2 United Kingdom
- 5.5.2.3 France
- 5.5.2.4 Russia
- 5.5.2.5 Rest of Europe
- 5.5.3 Asia-Pacific
- 5.5.3.1 China
- 5.5.3.2 Japan
- 5.5.3.3 India
- 5.5.3.4 South Korea
- 5.5.3.5 Australia
- 5.5.3.6 Rest of Asia-Pacific
- 5.5.4 Middle East and Africa
- 5.5.4.1 Middle East
- 5.5.4.1.1 Saudi Arabia
- 5.5.4.1.2 United Arab Emirates
- 5.5.4.1.3 Rest of Middle East
- 5.5.4.2 Africa
- 5.5.4.2.1 South Africa
- 5.5.4.2.2 Egypt
- 5.5.4.2.3 Rest of Africa
- 5.5.4.1 Middle East
- 5.5.5 South America
- 5.5.5.1 Brazil
- 5.5.5.2 Argentina
- 5.5.5.3 Rest of South America
- 5.5.1 North America
6 COMPETITIVE LANDSCAPE
- 6.1 Market Concentration
- 6.2 Strategic Moves
- 6.3 Market Share Analysis
- 6.4 Company Profiles (includes Global Level Overview, Market Level Overview, Core Segments, Financials as available, Strategic Information, Market Rank/Share, Products and Services, Recent Developments)
- 6.4.1 Manhattan Associates Inc.
- 6.4.2 Oracle Corporation
- 6.4.3 SAP SE
- 6.4.4 Blue Yonder Group, Inc.
- 6.4.5 C3 Solutions Inc.
- 6.4.6 Descartes Systems Group Inc.
- 6.4.7 Zebra Technologies Corporation
- 6.4.8 Kaleris, Inc.
- 6.4.9 FourKites, Inc.
- 6.4.10 project44, Inc.
- 6.4.11 Korber AG
- 6.4.12 Infor, Inc.
- 6.4.13 Yard Management Solutions LLC
- 6.4.14 YardView, LLC
- 6.4.15 Softeon, Inc.
- 6.4.16 Epicor Software Corporation
- 6.4.17 Peripass NV
- 6.4.18 Softeon, Inc.
- 6.4.19 Exotrac LLC
7 MARKET OPPORTUNITIES AND FUTURE OUTLOOK
- 7.1 White-Space and Unmet-Need Assessment


