


 |
市場調查報告書
商品編碼
2063283
化學品TIC:市場佔有率分析、行業趨勢和統計數據、成長預測(2026-2031)Chemical TIC - Market Share Analysis, Industry Trends & Statistics, Growth Forecasts (2026 - 2031) |
||||||

※ 本網頁內容可能與最新版本有所差異。詳細情況請與我們聯繫。
據 Mordor Intelligence 稱,2025 年化學行業的 TIC 市場價值為 238.4 億美元,預計將從 2026 年的 250.3 億美元成長到 2031 年的 319.1 億美元,2026 年至 2031 年的複合年成長率為 4.98%。
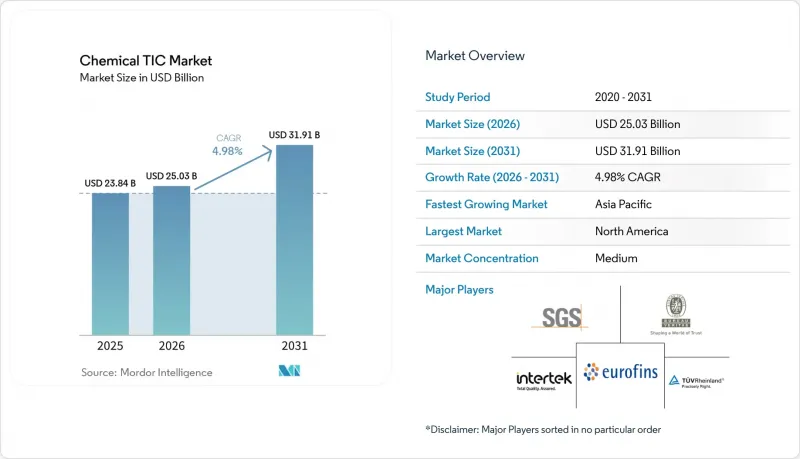
本報告按服務類型(測試、檢驗、認證)、採購類型(內部、外包)、服務交付方式(現場、異地/實驗室、遠端/數位化)和地區(北美、歐洲、亞太、中東和非洲、南美)進行細分。市場預測以美元計價。
全球化學TIC市場趨勢與洞察
加強全球化學品安全法規
歐盟「單一物質,單一評估」規則以及美國收緊 PFAS閾值,縮短了申請週期,提高了分析標準。諸如 EPA 方法 533、537.1 和 1633 等項目如今已成為決定是否授予合約的依據,而未獲得檢驗方案的檢測實驗室則錯失了參與盈利的市政競標的機會。歐盟統一的申報文件消除了各國重複審查,使得出口商必須儘早遵守規則。這些發展進一步增強了在多個司法管轄區獲得認證的檢測實驗室的競爭優勢,並促進了高利潤合規性檢測業務的發展。
對永續發展和ESG資訊揭露的要求日益提高。
歐盟的《企業永續性報告指令》(CSRD)和《環境、社會和管治報告標準》(ESRS)要求約5萬家公司從2024年起提交報告時必須接受第三方鑑證。如今,檢驗已擴展至溫室氣體排放、水資源、廢棄物和生物多樣性等指標,推動了對生命週期分析、環境產品聲明和碳足跡標籤的需求。美國證券交易委員會(SEC)的類似法規雖然範圍較窄,但也要求提供可審計的範圍1和範圍2數據。領先的測試、檢驗和認證(TIC)機構正透過將財務、環境和流程審計打包,並簽訂多年期合約來應對這項挑戰。
引進先進分析設備成本高昂
液相層析串聯質譜(LC-MS/MS)和電感耦合等離子體質譜(ICP-MS)系統能夠檢測出兆分之一等級的元素,通常售價超過50萬美元。年度維護合約和耗材費用加起來可達初始成本的20%。如果將無塵室建造、超純水系統和專用廢棄物處理管線等費用也計算在內,要實現盈利,每年所需的樣品量超過2.5萬個,這是當地實驗室難以企及的。新興市場低成本融資管道有限,進一步加劇了這一障礙,迫使小規模的公司選擇合作或出售業務。
細分市場分析
到2031年,認證服務將以5.25%的複合年成長率成長,反映出市場對「安全設計」聲明、再生材料含量檢驗和碳中和標籤的需求。受PFAS檢測、藥品活性成分批量放行和出口符合性測試等需求的驅動,檢測服務在2025年仍將佔據化學品檢測與認證(TIC)市場62.23%的主導佔有率。價值提案正從單純的處理能力轉向可靠的資料包和快速回應。雖然ISO/IEC 17025認證仍然是准入的基本要求,但客戶現在將其與特定產業的認證系統相結合,例如ISO 9001、ISO 14001或美國環保署國家環境檢測實驗室認可計劃(NELAP)。認證機構正在積極應對,尤其是在亞太地區,他們透過收購專注於特定領域的生命週期評估(LCA)諮詢公司和擴展其自願性生態標籤組合來滿足市場需求。
一個顯著的變化是下游產業(例如汽車和家用電子電器)自願性化學足跡基準測試的興起,迫使供應商獲得獨立的「從搖籃到大門」認證。歐盟更嚴格的產品環境足跡法規和永續產品的生態設計法規也創造了新的收入來源。因此,儘管認證預計將在化學品檢測與認證(TIC)市場中穩步成長,但實驗室之間的差異化優勢正日益體現在方法論的深度和數據的完整性上,而非價格。測試對於運行前安全評估和資產健康檢查仍然至關重要,但無人機、熱成像儀和氣體探測器的引入正在減少現場人工。
區域分析
預計到2025年,北美將佔據32.31%的市場佔有率。這主要得益於PFAS法規、藥品批次放行要求以及化學品製造產能回歸美國市場。新的水質標準要求採用液相層析串聯質譜法(LC-MS/MS)進行連續監測,促使美國檢測實驗室積極拓展業務,以在2027年4月合規截止日期前獲得認證。諸如SGS-ATS之類的收購迅速擴大了地理覆蓋範圍,而亞利桑那州和路易斯安那州的設施建設也推動了營運前安全審核的發展。加拿大和墨西哥正受益於「近岸外包」模式,即跨國製造商將其供應鏈轉移至此,從而促進了區域檢測中心的建立。
歐洲憑藉其《化學永續性戰略》(CSRD)和全部區域循環經濟目標,保持著堅實的基礎。目前,約有5萬家公司需要獲得有限或合理的永續性資料保證,這導致認證機構的工作量不斷增加。德國、法國、英國和義大利在訂單主導,但不斷上漲的能源價格和脫碳成本正在擠壓一些本地檢測機構的利潤空間。計劃於2029年推出的歐盟通用資料平台預計將進一步簡化跨國認證互認流程,從而為大規模營運商帶來顯著優勢。
預計到2031年,亞太地區將成為成長最快的地區,複合年成長率(CAGR)將達到5.81%。光是中國就計劃在2025年至2026年間將聚烯產能提高1,200萬噸以上,而印度則計劃在未來十年內投資870億美元用於石化業。新建廠需要進行運作前安全審核、ISO 14001認證和產品品質認證,這支撐了未來幾年內對技術引進成本(TIC)的需求。上海、孟買和新加坡等區域中心正在擴大業務範圍,涵蓋電池材料、氫能和半導體化學品等領域。
其他好處:
- Excel格式的市場預測(ME)表
- 3個月的分析師支持
目錄
第1章:引言
- 研究假設和市場定義
- 調查範圍
第2章:調查方法
第3章執行摘要
第4章 市場狀況
- 市場概覽
- 市場促進因素
- 加強全球化學品安全法規
- 將外包業務擴展到專業的TIC服務供應商
- 亞太地區化學品生產的快速工業成長
- 對永續性的日益重視以及ESG資訊揭露的強制性。
- 對 PFAS 超微量分析的需求正在激增。
- 化工工廠的數位雙胞胎檢驗
- 市場限制因素
- 先進分析設備的前期投資成本很高。
- 熟練化學家和檢驗員短缺
- 商品化例行檢查的價格壓力
- 雲端連線實驗室的網路安全職責
- 產業價值鏈分析
- 監理情勢
- 技術展望
- 宏觀經濟因素對市場的影響
- 波特五力分析
第5章 市場規模與成長預測
- 按服務類型
- 測試
- 檢查
- 認證
- 依採購類型
- 內部
- 外包
- 按服務交付方式
- 現場
- 異地/檢查室
- 遠端/數位
- 按地區
- 北美洲
- 美國
- 加拿大
- 墨西哥
- 歐洲
- 英國
- 德國
- 法國
- 義大利
- 其他歐洲國家
- 亞太地區
- 中國
- 日本
- 印度
- 韓國
- 其他亞太國家
- 中東
- 以色列
- 沙烏地阿拉伯
- 阿拉伯聯合大公國
- 土耳其
- 其他中東國家
- 非洲
- 南非
- 埃及
- 其他非洲國家
- 南美洲
- 巴西
- 阿根廷
- 其他南美國家
- 北美洲
第6章 競爭情勢
- 市場集中度
- 策略趨勢
- 市佔率分析
- 公司簡介
- SGS SA
- Bureau Veritas SA
- Intertek Group plc
- Eurofins Scientific SE
- TUV Rheinland AG
- DEKRA SE
- Applus Services SA
- UL LLC(UL Solutions Inc.)
- DNV AS
- TUV SUD AG
- ALS Limited
- Element Materials Technology Group Limited
- Lloyd's Register Group Limited
- MISTRAS Group, Inc.
- TUV Nord AG
- Kiwa NV
- SOCOTEC Group SA
- Apave International
- Centre Testing International Group Co., Ltd.
- Core Laboratories NV
第7章 市場機會與未來展望
According to Mordor Intelligence, the chemical TIC market was valued at USD 23.84 billion in 2025 and is estimated to grow from USD 25.03 billion in 2026 to USD 31.91 billion by 2031, at a CAGR of 4.98% from 2026 to 2031.
This report is Segmented by Service Type (Testing, Inspection, and Certification), Sourcing Type (In-House, and Outsourced), Mode of Service Delivery (On-Site, Off-site/Laboratory, and Remote/Digital), and Geography (North America, Europe, Asia-Pacific, Middle East, Africa, and South America). The Market Forecasts are Provided in Terms of Value (USD).
Global Chemical TIC Market Trends and Insights
Tightening Global Chemical-Safety Regulations
One-substance-one-assessment rules in the EU and stricter PFAS thresholds in the United States have cut filing times and raised analytical standards. Programs such as EPA Methods 533, 537.1, and 1633 now serve as pass-or-fail gates for contract awards, so labs without validated protocols lose access to lucrative municipal tenders. The unified EU dossier removes duplicate national reviews, making early compliance essential for exporters. These moves, taken together, widen the moat for laboratories with multi-jurisdictional accreditation, boosting high-margin compliance testing.
Rising Sustainability and ESG Disclosure Mandates
The EU CSRD and ESRS made third-party assurance obligatory for roughly 50 000 companies starting with fiscal-year 2024 reports. Verification now covers greenhouse gas emissions, water, waste, and biodiversity metrics, driving demand for life-cycle analysis, environmental product declarations, and carbon footprint labels. Similar rules by the U.S. SEC, though narrower, still require auditable Scope 1 and 2 data. Large testing, inspection and certification (TIC) groups have responded by bundling financial, environmental, and process audits, locking in multi-year contracts.
High Capital Cost of Advanced Analytical Instrumentation
LC-MS/MS and ICP-MS systems required for parts-per-trillion detection routinely cost more than USD 500 000. Annual service contracts and consumables add as much as 20% to the initial outlay. When cleanroom build-outs, ultra-pure water systems, and specialized waste lines are included, breakeven volumes can exceed 25 000 samples per year, levels unattainable for regional labs. Limited access to low-cost credit in emerging markets exacerbates the barrier, forcing smaller firms to enter into partnerships or divestments.
Other drivers and restraints analyzed in the detailed report include:
- Surge in PFAS Ultra-Trace Testing Demand
- Growing Outsourcing to Specialized TIC Providers
- Shortage of Skilled Chemists and Inspectors
For complete list of drivers and restraints, kindly check the Table Of Contents.
Segment Analysis
Certification services are expanding at a 5.25% CAGR through 2031, reflecting demand for safe-by-design claims, recycled-content verification, and carbon-neutral labels. Testing retained a dominant 62.23% share of the chemical TIC market in 2025, driven by PFAS detection, active pharmaceutical ingredient batch release, and export conformity checks. The value proposition is moving from sheer throughput to defensible data packages and quick turnaround. ISO/IEC 17025 accreditation remains the basic entry ticket, but clients now bundle it with ISO 9001 and ISO 14001, or sector-specific schemes such as the EPA National Environmental Laboratory Accreditation Program. Certification bodies are responding by acquiring niche LCA consultancies and expanding voluntary ecolabel portfolios, especially in the Asia-Pacific.
A notable shift is the rise of voluntary chemical-footprint benchmarks in downstream sectors such as automotive and consumer electronics, which press suppliers to obtain independent cradle-to-gate attestations. Tighter EU rules on Product Environmental Footprints and the Ecodesign for Sustainable Products Regulation are also steering new revenue. As a result, certification's share of the chemical TIC market size is projected to climb steadily, while testing laboratories differentiate on method depth and data integrity rather than price. Inspection stays relevant for pre-start-up safety reviews and asset-integrity checks, but drones, thermal cameras, and gas detectors are reducing on-site labor hours.
Geography Analysis
North America captured 32.31% market share in 2025, driven by PFAS regulations, pharmaceutical batch-release demand, and the reshoring of chemical capacity. New water-quality standards require continuous LC-MS/MS monitoring, so laboratories in the United States expanded aggressively to secure accreditation before the April 2027 compliance deadline. Acquisitions such as SGS-ATS immediately increased geographic coverage, while facility builds in Arizona and Louisiana attracted pre-operational safety audits. Canada and Mexico benefit from near-shoring as multinational producers relocate supply chains, spurring the establishment of regional test hubs.
Europe maintains a robust base because of the CSRD, the Chemicals Strategy for Sustainability, and region-wide circular-economy objectives. About 50 000 companies must now secure limited or reasonable assurance on sustainability data, driving volume to certified bodies. Germany, France, the United Kingdom, and Italy dominate orders, though elevated energy prices and decarbonization costs erode margins for some local labs. The coming EU common data platform, slated for 2029, is expected to further streamline cross-border certificate recognition, giving scale players an edge.
Asia-Pacific with 5.81% CAGR is the fastest-growing territory through 2031. China alone plans more than 12 million tonnes of extra polyolefin capacity between 2025 and 2026, while India targets USD 87 billion in petrochemical investments over the decade. Each greenfield plant requires start-up safety reviews, ISO 14001 certifications, and product-quality attestations, underpinning multi-year TIC demand. Regional hubs in Shanghai, Mumbai, and Singapore are widening their scope to battery materials, hydrogen, and semiconductor-grade chemicals.
- SGS SA
- Bureau Veritas SA
- Intertek Group plc
- Eurofins Scientific SE
- TUV Rheinland AG
- DEKRA SE
- Applus Services SA
- UL LLC (UL Solutions Inc.)
- DNV AS
- TUV SUD AG
- ALS Limited
- Element Materials Technology Group Limited
- Lloyd's Register Group Limited
- MISTRAS Group, Inc.
- TUV Nord AG
- Kiwa N.V.
- SOCOTEC Group SA
- Apave International
- Centre Testing International Group Co., Ltd.
- Core Laboratories N.V.
Additional Benefits:
- The market estimate (ME) sheet in Excel format
- 3 months of analyst support
TABLE OF CONTENTS
1 INTRODUCTION
- 1.1 Study Assumptions and Market Definition
- 1.2 Scope of the Study
2 RESEARCH METHODOLOGY
3 EXECUTIVE SUMMARY
4 MARKET LANDSCAPE
- 4.1 Market Overview
- 4.2 Market Drivers
- 4.2.1 Tightening Global Chemical-Safety Regulations
- 4.2.2 Growing Outsourcing to Specialized TIC Providers
- 4.2.3 Rapid Industrial Growth in Asia-Pacific Chemical Production
- 4.2.4 Rising Sustainability and ESG Disclosure Mandates
- 4.2.5 Surge in PFAS Ultra-Trace Testing Demand
- 4.2.6 Digital-Twin Validation for Chemical Plants
- 4.3 Market Restraints
- 4.3.1 High Capital cost of Advanced Analytical Instrumentation
- 4.3.2 Shortage of Skilled Chemists and Inspectors
- 4.3.3 Price Pressure on Commoditized Routine Tests
- 4.3.4 Cyber-Security Liabilities of Cloud-Connected Labs
- 4.4 Industry Value-Chain Analysis
- 4.5 Regulatory Landscape
- 4.6 Technological Outlook
- 4.7 Impact of Macroeconomic Factors on the Market
- 4.8 Porter's Five Forces Analysis
- 4.8.1 Threat of New Entrants
- 4.8.2 Bargaining Power of Suppliers
- 4.8.3 Bargaining Power of Buyers
- 4.8.4 Threat of Substitutes
- 4.8.5 Competitive Rivalry
5 MARKET SIZE AND GROWTH FORECASTS (VALUE)
- 5.1 By Service Type
- 5.1.1 Testing
- 5.1.2 Inspection
- 5.1.3 Certification
- 5.2 By Sourcing Type
- 5.2.1 In-house
- 5.2.2 Outsourced
- 5.3 By Mode of Service Delivery
- 5.3.1 On-site
- 5.3.2 Off-site / Laboratory
- 5.3.3 Remote / Digital
- 5.4 By Geography
- 5.4.1 North America
- 5.4.1.1 United States
- 5.4.1.2 Canada
- 5.4.1.3 Mexico
- 5.4.2 Europe
- 5.4.2.1 United Kingdom
- 5.4.2.2 Germany
- 5.4.2.3 France
- 5.4.2.4 Italy
- 5.4.2.5 Rest of Europe
- 5.4.3 Asia-Pacific
- 5.4.3.1 China
- 5.4.3.2 Japan
- 5.4.3.3 India
- 5.4.3.4 South Korea
- 5.4.3.5 Rest of Asia-Pacific
- 5.4.4 Middle East
- 5.4.4.1 Israel
- 5.4.4.2 Saudi Arabia
- 5.4.4.3 United Arab Emirates
- 5.4.4.4 Turkey
- 5.4.4.5 Rest of Middle East
- 5.4.5 Africa
- 5.4.5.1 South Africa
- 5.4.5.2 Egypt
- 5.4.5.3 Rest of Africa
- 5.4.6 South America
- 5.4.6.1 Brazil
- 5.4.6.2 Argentina
- 5.4.6.3 Rest of South America
- 5.4.1 North America
6 COMPETITIVE LANDSCAPE
- 6.1 Market Concentration
- 6.2 Strategic Moves
- 6.3 Market Share Analysis
- 6.4 Company Profiles (includes Global Level Overview, Market Level Overview, Core Segments, Financials as available, Strategic Information, Market Rank/Share, Products and Services, Recent Developments)
- 6.4.1 SGS SA
- 6.4.2 Bureau Veritas SA
- 6.4.3 Intertek Group plc
- 6.4.4 Eurofins Scientific SE
- 6.4.5 TUV Rheinland AG
- 6.4.6 DEKRA SE
- 6.4.7 Applus Services SA
- 6.4.8 UL LLC (UL Solutions Inc.)
- 6.4.9 DNV AS
- 6.4.10 TUV SUD AG
- 6.4.11 ALS Limited
- 6.4.12 Element Materials Technology Group Limited
- 6.4.13 Lloyd's Register Group Limited
- 6.4.14 MISTRAS Group, Inc.
- 6.4.15 TUV Nord AG
- 6.4.16 Kiwa N.V.
- 6.4.17 SOCOTEC Group SA
- 6.4.18 Apave International
- 6.4.19 Centre Testing International Group Co., Ltd.
- 6.4.20 Core Laboratories N.V.
7 MARKET OPPORTUNITIES AND FUTURE OUTLOOK
- 7.1 White-Space and Unmet-Need Assessment

 化學品即服務 (CaaS) 市場規模、佔有率和成長分析:按服務類型、化學品類型、部署模式、企業規模、應用、最終用戶產業和地區分類-2026-2033 年產業預測
 雲端運算:2026年全球工業產業市場報告
 地質軟體市場:依組織規模、部署模式、定價模式、應用程式類型和最終用戶分類,全球預測,2026-2032年
 化學品回收和廢棄物再生利用服務市場預測至2032年:按原料、服務類型、最終用戶和地區分類的全球分析
 化學品管理服務 (CMS) - 全球市場佔有率和排名、總收入和需求預測(2025-2031 年)
 全球化學品管理服務市場
 全球化學軟體市場規模(按產品類型、功能、地區和預測)
 全球化學品管理服務市場規模研究,按類型(採購、交付/分銷、庫存)、應用(航空運輸、汽車)和 2022-2032 年區域預測
 全球化學軟體市場 2025-2029