


 |
市場調查報告書
商品編碼
2063281
汽車儀錶群:市場佔有率分析、產業趨勢與統計、成長預測(2026-2031)Automotive Instrument Cluster - Market Share Analysis, Industry Trends & Statistics, Growth Forecasts (2026 - 2031) |
||||||

※ 本網頁內容可能與最新版本有所差異。詳細情況請與我們聯繫。
根據 Mordor Intelligence 預測,汽車儀錶群市場規模將從 2025 年的 102.3 億美元和 2026 年的 110.4 億美元成長到 2031 年的 161.3 億美元,2026 年至 2031 年的複合年成長率為 7.89%。
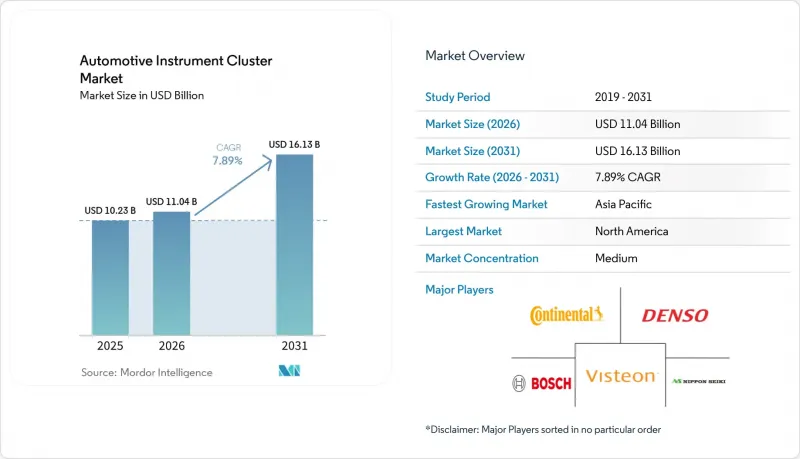
本報告按叢集類型(類比儀錶叢集、數位叢集等)、車輛類型(二輪車、三輪車等)、動力系統(內燃機 (ICE)、純電動車 (BEV) 等)、顯示技術(類比儀表、液晶顯示器等)、銷售管道(OEM、售後市場)和地區進行細分。市場預測以美元 (USD) 計價。
全球汽車儀錶群市場趨勢及洞察
從類比集群向全數位叢集的過渡
汽車製造商正在逐步淘汰機械儀表,因為純軟體佈局可以降低換刀成本、支援無線定位,並顯示豐富的駕駛輔助圖形。就連曾經偏愛Optitron指針式儀表的日本品牌,現在也開始在其所有量產車型上配備全液晶儀表,這表明全球正在向數位化叢集轉變。福特2025年召回事件,起因是部分皮卡車型存在螢幕黑屏問題,凸顯了在失去模擬冗餘的情況下進行嚴格檢驗的重要性。為了安撫那些懷念實體指南的消費者,高階品牌正在採用高對比度OLED面板,以模擬觸覺回饋和物理深度感。隨著叢集可靠性逐漸成為安全性的衡量標準,那些在字體清晰度、色彩科學和瞬時啟動性能方面擁有卓越表現的供應商,正在設計競爭中佔據優勢。
隨著電動車產量的擴大,電池狀態顯示器變得不可或缺。
電池動力傳動系統的普及要求叢集能夠顯示詳細的能量數據,包括充電狀態、剩餘續航里程、能量回收煞車強度以及溫度相關的續航里程。雪佛蘭Equinox EV的叢集樹立了新的標桿,其顯示器讓駕駛員能夠一目了然地查看充電水平、能量歷史記錄和即時功率流。駕駛者對剩餘續航里程的擔憂日益加劇,因此對能夠根據地形和天氣狀況動態調整的視覺資訊的需求也隨之增加。正因如此,叢集正從被動的儀表裝置演變為主動的駕駛指導工具,鼓勵駕駛人養成有利於電池健康的駕駛習慣。隨著越來越多的地區宣布逐步淘汰內燃機汽車,儀錶叢集供應商正將電池分析功能作為核心功能整合到儀錶板中,而不再僅僅將其作為電動車的附加功能。
大眾市場領域高成本且價格敏感
由於數位儀錶叢集仍然是一大障礙。儘管售後市場套件的出現顯示消費者對現代顯示器的需求,但也凸顯了消費者支付意願的限制。供應商正努力透過垂直整合來降低成本,例如自主生產背光、觸控感測器和基板組件。一些汽車製造商(OEM)則採取分級配置,將全數位叢集限制在高階車型上,這削弱了規模經濟效益,並降低了其對消費者購買力的影響。
細分市場分析
到2025年,類比儀錶板將佔據汽車儀錶板市場49.14%的佔有率,這主要得益於注重成本的車型以及優先考慮穩健簡潔規格的商用車車隊。然而,全數位叢集正以8.34%的複合年成長率成長,並正在為整合導航、ADAS警報和個人化功能的下一代駕駛座奠定基礎。供應商正利用發光面板實現深邃的黑色和低延遲,從而支援在運動、節能和自動駕駛模式之間切換的上下文感知主題。法規要求顯示駕駛輔助狀態,這加速了這一轉變,因為僅靠物理指南已不再足夠。對於愛好者來說,指針的觸感依然令人喜愛,一些傳統品牌有時也會將模擬環形指針和中央螢幕融合在一起,以此喚起人們的懷舊情懷。
汽車儀錶群市場正透過調整供應鏈來應對數位化需求。製造商正投資於圖形處理流程,這些流程只需編譯一次即可部署到任何螢幕大小,從而減輕了工程負擔。隨著儀錶叢集與抬頭顯示器同步,冗餘警告資訊減少,為更詳細的地圖騰出了空間。類比儀表的應用範圍越來越窄,例如新興市場的摩托車和一些小眾越野車,在這些應用中,眩光、振動以及戴手套操作的便利性比設計更為重要。然而,混合解決方案也逐漸在這些領域獲得認可,例如在機械儀表之間整合緊湊型TFT顯示螢幕,無需重新設計整個儀錶板即可顯示必要的資訊。
到2025年,乘用車將佔據汽車儀錶群市場佔有率的56.21%,同時也是成長最快的細分市場,到2031年複合年成長率將達到7.75%。這反映出乘用車在互聯內裝的生產和消費需求方面佔據主導地位。大型數位儀錶叢集已廣泛應用於電動跨界車和高階轎車,隨著車型更新換代,這一趨勢也逐漸蔓延至中檔車市場。就連曾經僅配備速度表和油量表的摩托車,如今也開始採用小型TFT螢幕來顯示導航箭頭和來電通知,這反映了都市區騎乘者日益成長的智慧型手機使用習慣。廂型車和中型卡車的發展相對滯後,但監管資料登錄要求正在推動它們向數位化儀錶板轉型,以標準化駕駛員性能回饋。
在汽車儀錶群市場,乘用車佔據主導地位,由此產生的規模經濟效益也延伸至摩托車和輕型商用車領域,降低了進入門檻。騎士們青睞即時檔位顯示和藍牙音樂通知等功能,緊湊型叢集已成為一種生活方式的象徵。汽車製造商正在統一不同車身樣式的設計語言,例如SUV和掀背車共用底層圖形,僅採用不同的配色。這種方法降低了軟體驗證的成本,而隨著更新頻率的加快,軟體檢驗變得至關重要。商用車業者關注的是可靠性指標,如果固態儀錶叢集在實際應用中展現出耐用性,其應用範圍將擴展到公車和最後一公里配送三輪車等領域,因為在這些領域,貨物可視性變得越來越重要。
區域分析
預計到2025年,北美將佔據汽車儀錶群市場35.66%的佔有率。這主要得益於皮卡和SUV的強勁產量,以及消費者對更大、更可客製化螢幕的需求。聯邦政府關於防止駕駛分心的指導方針迫使底特律的汽車製造商檢驗字體清晰度和警報優先級,從而影響全球設計語言。該地區還在試點空中下載(OTA)更新,以實現主題包的商業化,使北美成為供應商在全球推廣前的試驗場。半導體短缺導致的供應中斷增加了近岸外包的興趣,刺激了對墨西哥電子工廠的新投資,這些工廠可以在滿足美墨加協定(USMCA)規定的同時縮短前置作業時間。各州關於觸覺回饋和夜間駕駛最低亮度的新法規也進一步影響儀表叢集背光的要求。
亞太地區是成長最快的市場,預計到2031年複合年成長率將達到8.05%。中國大力推動電氣化,推動了對能夠處理電池分析的叢集的需求;同時,計劃於2027年強制使用實體開關,確保了必要的運作功能,凸顯了叢集的持續作用。在世界最大的二輪車市場印度,隨著騎乘者對導航指導和來電通知的需求,TFT顯示器正迅速普及。在安得拉邦進行面板模組的本地組裝,降低了關稅負擔,並確保了供應。日本憑藉其在顯示領域的深厚專業知識出口高對比度面板,但工廠整合顯示其正轉向利潤更高的OLED生產線。在東南亞國家,配備小型彩色叢集的低成本電動滑板車廣受歡迎,開闢了新的銷售領域。
儘管整體擴張速度有所放緩,但歐洲仍然是技術潮流的先驅。豪華汽車製造商正在嘗試採用橫跨駕駛員和乘客區域的曲面OLED叢集,並透過軟體動態分配導航和娛樂顯示區域。聯合國歐洲經濟委員會(UNECE)的網路安全管治法規提高了認證成本,但也增強了豪華車買家的信任。歐洲安全標準強制要求在叢集顯示駕駛輔助圖標,迫使先前堅持使用類比系統的製造商轉向混合或全數位系統。由於地緣政治因素導致能源價格波動,車隊營運商正在引入配備節能駕駛評分儀錶板的電動貨車。東歐契約製造製造商正在吸引西歐品牌的組裝項目,這些品牌希望避免單一國家的風險,而歐盟的碳邊境調節機制(CBAM)可能會進一步促進關鍵子部件在叢集內的在地採購。
其他好處:
- Excel格式的市場預測(ME)表
- 3個月的分析師支持
目錄
第1章:引言
- 研究假設和市場定義
- 調查範圍
第2章:調查方法
第3章執行摘要
第4章 市場狀況
- 市場概覽
- 市場促進因素
- 從類比集群向全數位叢集的過渡
- 隨著電動車產量的擴大,電池狀態顯示功能變得不可或缺。
- ADAS與聯網汽車HMI的整合
- 促進可重構叢集的軟體定義車輛架構
- 利用軟性OLED面板降低物料清單成本
- 對身臨其境型3D/AR駕駛座體驗的需求
- 市場限制因素
- 大眾市場領域高成本且價格敏感
- 傳統積體電路和顯示器供應鏈出現短缺
- 互聯叢集集中網路安全合規的負擔
- 更嚴格的駕駛分心相關法規限制了使用者介面的複雜性。
- 價值供應鏈分析
- 監理情勢
- 技術展望
- 波特五力模型
第5章 市場規模與成長預測
- 按叢集類型
- 模擬叢集
- 數位叢集
- 混合叢集
- 車輛類型
- 摩托車
- 三輪車
- 搭乘用車
- 輕型商用車(LCV)
- 中型和重型商用車輛(MHCV)
- 巴士和長途汽車
- 依推進類型
- 內燃機(ICE)
- 電池式電動車(BEV)
- 插電式混合動力車(PHEV)
- 混合動力電動車(HEV)
- 燃料電池汽車(FCEV)
- 顯示技術
- 類比儀表
- LCD
- OLED
- TFT
- HUD(抬頭顯示器)
- 按銷售管道
- 目的地設備製造商 (OEM)
- 售後市場
- 按地區
- 北美洲
- 美國
- 加拿大
- 其他北美國家
- 南美洲
- 巴西
- 阿根廷
- 其他南美國家
- 歐洲
- 英國
- 德國
- 西班牙
- 義大利
- 法國
- 俄羅斯
- 其他歐洲國家
- 亞太地區
- 印度
- 中國
- 日本
- 韓國
- 其他亞太國家
- 中東和非洲
- 阿拉伯聯合大公國
- 沙烏地阿拉伯
- 土耳其
- 埃及
- 南非
- 其他中東和非洲國家
- 北美洲
第6章 競爭情勢
- 市場集中度
- 策略趨勢
- 市佔率分析
- 公司簡介
- Continental AG
- Robert Bosch GmbH
- Denso Corporation
- Visteon Corporation
- Yazaki Corporation
- Nippon Seiki Co., Ltd.
- Marelli SpA
- Panasonic Automotive Systems Co., Ltd.
- Pricol Limited
- Stoneridge Inc.
- Valeo SA
- Harman International
- LG Display Co., Ltd.
- Hyundai Mobis Co., Ltd.
- Forvia SE
- Innolux Corporation
第7章 市場機會與未來展望
According to Mordor Intelligence, the automotive instrument cluster market size is projected to expand from USD 10.23 billion in 2025 and USD 11.04 billion in 2026 to USD 16.13 billion by 2031, registering a 7.89% CAGR between 2026 and 2031.
This report is Segmented by Cluster Type (Analog Cluster, Digital Cluster, and More), Vehicle Type (Two-Wheelers, Three-Wheelers, and More), Propulsion Type (Internal Combustion Engine (ICE), Battery Electric Vehicle (BEV), and More), Display Technology (Analog Gauge, LCD, and More), Sales Channel (OEM, Aftermarket), and Geography. The Market Forecasts are Provided in Terms of Value (USD).
Global Automotive Instrument Cluster Market Trends and Insights
Shift from Analog to Fully-Digital Clusters
Automakers are retiring mechanical gauges because software-only layouts cut tool-change expense, support over-the-air localization, and accommodate rich driver-assistance graphics. Japanese brands that once favored optitron dials now ship full-LCD meters across volume models, underscoring a global tipping point toward digital clusters. Ford's 2025 recall, triggered by black-screen failures on certain pickups, highlighted the importance of rigorous validation when analog redundancy disappears. To reassure buyers who miss tactile pointers, premium marques are adding haptic feedback and high-contrast OLED panels that mimic physical depth. Suppliers that refine font legibility, color science, and instantaneous wake-up behavior are winning design contests as cluster reliability becomes a safety proxy.
Growing EV Production Needing Battery-State Displays
Battery-electric powertrains compel clusters to show granular energy data, state of charge, distance-to-empty, regenerative braking intensity, and temperature-linked range. Chevrolet's Equinox EV cluster sets a new baseline, presenting charge percentage, energy history, and real-time power flow at a single glance. Driver anxiety over remaining range intensifies demand for dynamic visuals that adapt to terrain and weather. The cluster, therefore, evolves from a passive gauge set to an active coaching tool, nudging behavior that preserves battery health. As more jurisdictions announce combustion-engine phase-outs, instrument-cluster suppliers bundle battery analytics as a core feature rather than an electric-only add-on.
High Cost and Price Sensitivity in Mass-Market Segments
Digital clusters still add material cost compared to analog units, an obstacle in entry-level cars and motorcycles, where buyers favor lower transaction prices. Aftermarket kits demonstrate consumer demand for modern displays but also reveal willingness-to-pay thresholds. Suppliers pursue vertical integration, owning back-light, touch sensor, and board assembly, to shave every dollar. Some OEMs tier options, reserving full digital clusters for premium trims, yet that fragments scale economies and dilutes purchasing leverage.
Other drivers and restraints analyzed in the detailed report include:
- ADAS and Connected-Car Integration Into HMI
- Software-Defined Vehicle Architectures Driving Re-Configurable Clusters
- Legacy Supply-Chain Shortages for ICs / Displays
For complete list of drivers and restraints, kindly check the Table Of Contents.
Segment Analysis
Analog units retained 49.14% of the Automotive instrument cluster market share in 2025, underpinned by cost-driven models and commercial fleets that value rugged simplicity. Yet fully digital clusters, growing at 8.34% CAGR, anchor next-generation cockpits that merge navigation, ADAS alerts, and personalization. Suppliers leverage emissive panels to achieve deep blacks and low latency, enabling context-sensitive themes that switch between sport, eco, and autonomous modes. Regulatory mandates to surface driver-assist status make physical pointers insufficient, accelerating the pivot. Enthusiast circles still admire the tactile sweep of a needle, and heritage brands sometimes blend analog rings with center screens as a bridge to nostalgia.
The Automotive instrument cluster market responds by aligning supply with digital demand. Manufacturers invest in graphics pipelines that compile once and deploy across screen sizes, reducing engineering overhead. As clusters synchronize with head-up displays, redundant warnings fade, freeing real estate for richer maps. Analog holdouts increasingly serve emerging-market two-wheelers or niche off-highway machinery, where glare, vibration, and glove-friendly controls trump styling. Even there, hybrid solutions creep in, a compact TFT inserts between mechanical gauges to satisfy minimum information sets without re-engineering entire dashboards.
Passenger cars captured 56.21% of the Automotive instrument cluster market share in 2025 and are also the fastest-growing segment at 7.75% CAGR through 2031, reflecting lion 's-share production volumes and consumer appetite for connected interiors. Electric crossovers and premium sedans frequently debut large digital clusters that cascade to mid-segments within model-cycle refreshes. Two-wheelers, once content with speed and fuel needles, now adopt small TFT screens to show navigation arrows and call alerts, mirroring smartphone culture among urban riders. Fleet vans and medium trucks lag, yet regulatory data-logging requirements nudge them toward digital dashboards that standardize driver-score feedback.
Within the Automotive instrument cluster market, passenger-car dominance seeds scale economies that bleed into motorcycles and light commercial vehicles, lowering entry barriers. Riders appreciate instantaneous gear-position cues and Bluetooth music prompts, turning compact clusters into lifestyle statements. Carmakers unify design language across multiple body styles, so an SUV and a hatchback share underlying graphics while toggling color accents. The approach reduces software validation overhead, which is crucial as update cadence accelerates. Commercial operators watch reliability metrics; once solid-state clusters prove durable in the field, adoption broadens to buses and last-mile delivery trikes with escalating cargo-visibility needs.
Geography Analysis
North America secured 35.66% of the Automotive instrument cluster market share in 2025, aided by strong pickup and SUV output and consumers eager for large, configurable screens. Federal distraction guidelines press Detroit automakers to validate font clarity and alert priorities, influencing global design language. The region also pilots over-the-air updates that monetize theme bundles, giving suppliers a North American test bed before global rollout. Supply disruptions during semiconductor shortages spurred interest in near-shoring, driving fresh investment in Mexican electronics plants that can meet USMCA rules while shortening lead times. Emerging state-level mandates for haptic feedback and minimum luminance during night driving further shape the back-light requirements for clusters.
Asia-Pacific is the fastest climber, slated for an 8.05% CAGR through 2031. China's electrification push demands clusters tuned to battery analytics, while its 2027 mandate for physical switches safeguards critical controls, confirming the cluster's enduring role. India, the world's largest two-wheeler market, is seeing rapid adoption of TFT displays as riders seek navigation prompts and call alerts. Local assembly of panel modules in Andhra Pradesh reduces tariff load and secures supply. Japan leverages deep display expertise to export high-contrast panels, although plant consolidations signal a shift toward higher-margin OLED lines. Southeast Asian nations welcome budget electric scooters with small color clusters, opening new volume tiers.
Europe remains a technology trendsetter despite slower overall expansion. Luxury OEMs experiment with curved OLED clusters spanning the driver and passenger zones, using software to dynamically allocate space between navigation and entertainment. Cybersecurity governance, anchored by UNECE regulations, adds certification costs but also underwrites trust among premium buyers. The continent's safety rules require clusters to host driver-assist icons, coaxing analog holdouts toward hybrid or full digital systems. Geopolitical energy volatility nudges fleets to electrified vans whose dashboards showcase eco-driving scores. Eastern European contract manufacturers attract assembly programs that hedge Western brands against single-country risk, and EU carbon border rules may further promote local sourcing of critical sub-components within their clusters.
- Continental AG
- Robert Bosch GmbH
- Denso Corporation
- Visteon Corporation
- Yazaki Corporation
- Nippon Seiki Co., Ltd.
- Marelli S.p.A.
- Panasonic Automotive Systems Co., Ltd.
- Pricol Limited
- Stoneridge Inc.
- Valeo SA
- Harman International
- LG Display Co., Ltd.
- Hyundai Mobis Co., Ltd.
- Forvia SE
- Innolux Corporation
Additional Benefits:
- The market estimate (ME) sheet in Excel format
- 3 months of analyst support
TABLE OF CONTENTS
1 Introduction
- 1.1 Study Assumptions & Market Definition
- 1.2 Scope of the Study
2 Research Methodology
3 Executive Summary
4 Market Landscape
- 4.1 Market Overview
- 4.2 Market Drivers
- 4.2.1 Shift from Analog to Fully-Digital Clusters
- 4.2.2 Growing EV Production Needing Battery-State Displays
- 4.2.3 ADAS and Connected-Car Integration Into HMI
- 4.2.4 Software-Defined Vehicle Architectures Driving Re-Configurable Clusters
- 4.2.5 Flexible OLED Panels Reducing BOM Cost
- 4.2.6 Demand for Immersive 3D/AR Cockpit Experiences
- 4.3 Market Restraints
- 4.3.1 High Cost and Price Sensitivity in Mass-Market Segments
- 4.3.2 Legacy Supply-Chain Shortages for ICs / Displays
- 4.3.3 Cyber-Security Compliance Burden for Connected Clusters
- 4.3.4 Stricter Driver-Distraction Regulations Capping UI Complexity
- 4.4 Value / Supply-Chain Analysis
- 4.5 Regulatory Landscape
- 4.6 Technological Outlook
- 4.7 Porter's Five Forces
- 4.7.1 Threat of New Entrants
- 4.7.2 Bargaining Power of Suppliers
- 4.7.3 Bargaining Power of Buyers
- 4.7.4 Threat of Substitutes
- 4.7.5 Competitive Rivalry
5 Market Size & Growth Forecasts (Value, (USD))
- 5.1 By Cluster Type
- 5.1.1 Analog Cluster
- 5.1.2 Digital Cluster
- 5.1.3 Hybrid Cluster
- 5.2 By Vehicle Type
- 5.2.1 Two-Wheelers
- 5.2.2 Three-Wheelers
- 5.2.3 Passenger Cars
- 5.2.4 Light Commercial Vehicles (LCV)
- 5.2.5 Medium and Heavy Commercial Vehicles (MHCVs)
- 5.2.6 Buses and Coaches
- 5.3 By Propulsion Type
- 5.3.1 Internal Combustion Engine (ICE)
- 5.3.2 Battery Electric Vehicle (BEV)
- 5.3.3 Plug-in Hybrid Electric Vehicle (PHEV)
- 5.3.4 Hybrid Electric Vehicle (HEV)
- 5.3.5 Fuel Cell Electric Vehicle (FCEV)
- 5.4 By Display Technology
- 5.4.1 Analog Gauge
- 5.4.2 LCD
- 5.4.3 OLED
- 5.4.4 TFT
- 5.4.5 HUD (Head-Up Display)
- 5.5 By Sales Channel
- 5.5.1 Original Equipment Manufacturer (OEM)
- 5.5.2 Aftermarket
- 5.6 By Geography
- 5.6.1 North America
- 5.6.1.1 United States
- 5.6.1.2 Canada
- 5.6.1.3 Rest of North America
- 5.6.2 South America
- 5.6.2.1 Brazil
- 5.6.2.2 Argentina
- 5.6.2.3 Rest of South America
- 5.6.3 Europe
- 5.6.3.1 United Kingdom
- 5.6.3.2 Germany
- 5.6.3.3 Spain
- 5.6.3.4 Italy
- 5.6.3.5 France
- 5.6.3.6 Russia
- 5.6.3.7 Rest of Europe
- 5.6.4 Asia-Pacific
- 5.6.4.1 India
- 5.6.4.2 China
- 5.6.4.3 Japan
- 5.6.4.4 South Korea
- 5.6.4.5 Rest of Asia-Pacific
- 5.6.5 Middle East and Africa
- 5.6.5.1 United Arab Emirates
- 5.6.5.2 Saudi Arabia
- 5.6.5.3 Turkey
- 5.6.5.4 Egypt
- 5.6.5.5 South Africa
- 5.6.5.6 Rest of Middle East and Africa
- 5.6.1 North America
6 Competitive Landscape
- 6.1 Market Concentration
- 6.2 Strategic Moves
- 6.3 Market Share Analysis
- 6.4 Company Profiles (Includes Global Level Overview, Market Level Overview, Core Segments, Financials as Available, Strategic Information, Market Rank/Share for Key Companies, Products and Services, SWOT Analysis, and Recent Developments)
- 6.4.1 Continental AG
- 6.4.2 Robert Bosch GmbH
- 6.4.3 Denso Corporation
- 6.4.4 Visteon Corporation
- 6.4.5 Yazaki Corporation
- 6.4.6 Nippon Seiki Co., Ltd.
- 6.4.7 Marelli S.p.A.
- 6.4.8 Panasonic Automotive Systems Co., Ltd.
- 6.4.9 Pricol Limited
- 6.4.10 Stoneridge Inc.
- 6.4.11 Valeo SA
- 6.4.12 Harman International
- 6.4.13 LG Display Co., Ltd.
- 6.4.14 Hyundai Mobis Co., Ltd.
- 6.4.15 Forvia SE
- 6.4.16 Innolux Corporation
7 Market Opportunities & Future Outlook
- 7.1 White-Space & Unmet-Need Assessment

 汽車智慧製造市場預測(2034 年)—按製造流程、車輛類型、部署模式、技術、應用、最終用戶和地區分類的全球分析人工智慧工廠檢測市場預測至2034年—按部署類型、組件、技術、應用、最終用戶和地區分類的全球分析AI數位化工廠平台市場預測至2034年—按組件、部署模式、技術、應用、最終用戶和地區分類的全球分析數位工廠平台市場預測至2034年—按平台類型、應用、最終用戶和地區分類的全球分析
 汽車儀錶群市場規模、佔有率、趨勢和預測:叢集類型、車輛類型、銷售管道、應用和地區分類,2026-2034年
 全球儀錶叢集市場規模、佔有率、趨勢和成長分析報告(2026-2034)汽車智慧工廠市場:策略洞察與預測(2026-2031年)
 數位儀錶叢集市場:按顯示技術、解析度、叢集類型、銷售管道和車輛類別分類-2026-2032年全球預測
 數位儀錶叢集市場分析及預測(至2035年):依類型、產品類型、服務、技術、組件、應用、最終用戶、功能、安裝類型、解決方案分類2026-2034年全球汽車儀錶叢集市場規模、佔有率、趨勢及成長分析報告