


 |
市場調查報告書
商品編碼
2063261
清潔氫能:市場佔有率分析、產業趨勢與統計、成長預測(2026-2031)Clean Hydrogen - Market Share Analysis, Industry Trends & Statistics, Growth Forecasts (2026 - 2031) |
||||||
※ 本網頁內容可能與最新版本有所差異。詳細情況請與我們聯繫。
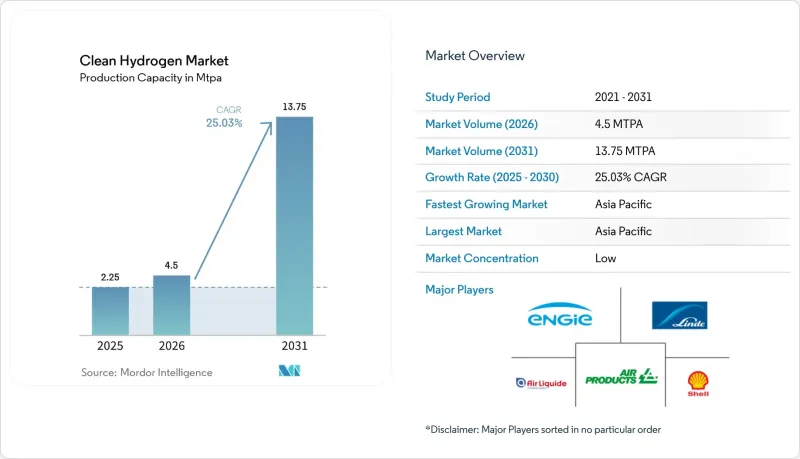
根據 Mordor Intelligence 的數據,清潔氫市場規模(按產能計算)預計將從 2025 年的 225 萬噸/年成長到 2026 年的 450 萬噸/年,並將從 2026 年到 2031 年以 25.03% 的複合年成長率成長,達到 2031 萬噸。
本報告依生產方法(綠氫、藍氫、綠松石氫及其他)、電解槽技術(鹼性電解槽、PEM電解槽及其他)、供應形式(壓縮氣體、液氫及其他)、應用領域(運輸、工業及其他)及地區(北美、歐洲、亞太及其他)進行細分。市場預測以噸為單位。
全球清氫市場趨勢及洞察
從 2026 年開始,電解槽能過剩的急劇增加將導致價格暴跌。
2025年,全球電解槽的額定產能達到每年61-63吉瓦,但運作的僅有2.15吉瓦,導致供應過剩。這使得歐洲鹼性電解槽的價格跌至每千瓦2,407美元,PEM電解槽的價格跌至每千瓦2,547美元。中國供應商控制著超過一半的在運作中工廠產能,並以低於成本的價格出口組件以維持市場佔有率,這給歐美製造商的利潤率帶來了壓力。隨著硬體價格的下降,預計到2030年,在太陽能資源豐富的地區,未補貼的綠氫的均等化成本將降至每公斤1.50-2.50美元,低於因碳捕獲成本飆升而價格上漲的藍氫的價格區間。這種價格競爭正在加速中東和印度等再生能源豐富且價格低廉的地區的最終投資決策。然而,組件價格的急劇下降給中小型OEM廠商的營運資金帶來了壓力,使得未來兩年產業整合的可能性更大。
歐盟、印度和巴西都推出了類似IRA的生產稅額扣抵。
美國《通膨控制法案》(IRA)為低碳氫化合物提供每公斤高達3美元的45V稅額扣抵,已成為全球標桿,目前正被歐洲的「氫能銀行」、印度的SIGHT計劃以及巴西正在考慮的獎勵框架所效仿。這些補貼設定了可預測收益的下限,並允許開發商以更低的利差獲得無追索權債務。光是印度就累計24億美元用於電解和生產獎勵,促成了AM Green公司年產100萬噸綠色氨計畫的最終投資決定(FID)。然而,《一項宏偉法案》(One Big, Beautiful Bill Act)中的提前終止條款(該法案要求美國項目必須在2028年1月1日前開工)凸顯了政策風險依然存在,到2025年,已有超過490萬噸/年的項目被取消。
自2030年起,可再生能源發電削減將收取罰款(併網費)。
德國已將2024年綠色電力裝置容量上限設定為8.2太瓦時(TWh),並引入了分時電價機制。此機制在用電低谷時段對電解收取每兆瓦時5.8至17.4美元的費用,推翻了能源成本為零的假設。西班牙和丹麥正在試行類似的浮動電價機制。由於鹼性電解槽需要5至15分鐘來調整輸出,因此它們無法像鋰離子電池那樣快速吸收價格波動,監管機構優先考慮使用電池來穩定電網。此外,歐盟法規規定可再生能源發電量和氫氣產量必須按小時匹配,這限制了開發商在競標區域之間透過套利採購廉價進口氫氣的機會。 2030年後,電網罰款可能會使氫氣成本增加每公斤0.20至0.50美元,這可能會削弱氫氣在天然氣資源豐富地區與藍氫的競爭力。
細分市場分析
預計到2025年,藍氫將佔清潔氫市場68.5%的佔有率,凸顯了這種結合天然氣重整和碳捕獲技術的先發優勢。然而,向綠氫的轉型速度更快,預計到2031年將以34.6%的複合年成長率成長。這主要歸功於電解槽成本的下降,在太陽能資源豐富的地區,藍氫與蒸氣重整的交付差距已縮小至每公斤不到0.20美元。這種轉變正在縮小曾經在企劃案融資模式中有利於蒸氣重組專案的“藍氫溢價”,尤其是在政府對碳捕獲的獎勵開始減少的地區。因此,開發商繼續建造吉瓦級電解叢集,例如年產能達21.9萬噸的NEOM綜合體,這正在推動其大規模出口到亞洲。
從2026年起,與綠色專案相關的清潔氫市場在已公佈產能方面將超過藍氫,儘管藍氫在運作中生產方面仍將佔據主導地位。二氧化碳捕集與儲存(CCS)成本的上升(從2025年的每噸50-100美元增加至2030年的每噸80-150美元)正在削弱藍氫的價格優勢,而可再生能源的增加、土地租賃制度的改革以及稅額扣抵正在加速電解計畫的推進。由於碳貨幣化示範不足以及物流障礙,綠松石氫和生質能氣化在清潔氫市場中所佔佔有率較低。除非碳捕獲與封存成本曲線趨於平緩,否則政策風險預計將進一步縮減藍氫計畫的儲備,從而為綠氫成為採購競標的標準創造空間。
鹼性電池系統憑藉其低資本密集度和在氯鹼行業數十年的成熟經驗,預計到2025年將佔據清潔氫市場58.9%的佔有率。中國供應商預計將推動價格競爭並提高其在出口競標中的佔有率,從而推動歐洲組件價格在2025年降至每千瓦2436美元以下。然而,隨著銥負載容量從2020年的每千瓦2-3克降至2025年的每千瓦0.3-0.5克,PEM電池正在縮小差距,催化劑成本將降低70%以上。 PEM電池具有快速功率擴展和部分負載柔軟性(可在不到一秒的時間內響應額定容量的10%),使其成為混合風能和太陽能發電系統的理想選擇。
儘管固體氧化物電解(SOEC) 目前市佔率較小,但初步試驗顯示其電效率已達 72%,目標是透過工業廢熱回收,使電堆效率超過 85%。在電力成本超過每兆瓦時 40 美元的市場中,這有望為每公斤原料節省 0.30 至 0.80 美元,使 SOEC 成為鋼鐵和氨複合體的可選方案。同時,陰離子交換膜 (AEM) 原型預計將在不使用貴金屬的情況下達到與質子交換膜 (PEM) 類似的性能,但其耐久性超過 40,000 小時的測試仍不足以證明其有效性。總體而言,技術格局正從以成本主導的鹼金屬主導模式轉向更加平衡的配置,其中 PEM(最終是 SOEC)將開闢與靈活可再生能源和高等級熱能整合相關的應用領域。
區域分析
預計亞太地區將引領全球氫能發展,2025年產量將佔全球總產量的43.7%,到2031年將維持27.4%的年複合成長率,成為該地區氫能成長最快的區域。 2025年全球共有59個氫能計畫運作,其中25個位於中國,包括中石化年產2萬噸的庫車電解槽聯合裝置。印度的「國家綠色氫能計畫」獲得了20.5億美元的獎勵支持,透過氨和交通運輸領域的先導計畫,已實現了每年超過100萬噸的確認產能。日本正在發展進口基礎設施,目標是到2030年達到每年300萬噸,到2050年達到每年2000萬噸,這顯示該地區對氫能出口有結構性需求。在東協地區,印尼和越南正在考慮建造低成本的水力發電廠,但這些項目的實施取決於港口授權和資金籌措銷售合約的可用性。
歐洲預計在2025年將佔據全球氫氣生產的大部分佔有率,但由於限制可再生能源發電的處罰力度不斷增加以及嚴格的時間一致性法規,歐洲正面臨許多挑戰。德國計劃在2024年限制8.2太瓦時的綠色電力,並引入了動態電網收費機制,使氫氣成本每公斤增加0.20至0.50美元。儘管如此,歐洲大陸正在建造一條貫穿整個大陸的氫氣主幹管道網路。具體而言,該網路包括全長3300公里的“南氫走廊”(SouthH2)和全長11600公里的“氫氣主幹線(一期)”,後者計劃於2030年完工。荷蘭和西班牙的主要叢集正在將離岸風力發電電購電協議(PPA)與200-250兆瓦的電解設備結合,以支持其向煉油廠供應氫氣和出口氫氣的目標。
在北美,美國墨西哥灣沿岸地區受益於現有的1000英里氫氣管道和12億美元的樞紐津貼,但45伏稅收優惠政策的提前終止迫使相關項目在2028年前做出最終投資決定(FID),預計到2025年將有超過490萬噸的項目被取消。沙烏地阿拉伯的NEOM綜合體利用太陽能以每公斤1.50至2.50美元的價格供應綠色氨,從而推動該地區的電力出口。巴西預計於2026年最終確定獎勵,並將重點放在其氨出口走廊上。同時,南非的鉑金和銥礦供應關鍵的PEM催化劑,提升了它們在材料安全方面的地緣政治重要性。
其他好處:
- Excel格式的市場預測(ME)表
- 3個月的分析師支持
目錄
第1章:引言
- 研究假設和市場定義
- 調查範圍
第2章:調查方法
第3章執行摘要
第4章 市場狀況
- 市場概覽
- 市場促進因素
- 從 2026 年開始,電解槽能過剩的急劇增加將導致價格暴跌。
- 歐盟、印度和巴西引進IRA型生產稅額扣抵抵免
- 鋼鐵和氨採購商對「綠色溢價」採購要求的日益提高
- 歐盟、美國沿岸地區和中東地區氫氣管道走廊的開發
- 將再生能源和氫氣採購結合的企業購電協議(PPA)。
- 固體氧化物電解效率有突破性進展,超過 85%(從實驗室到試驗規模)
- 市場限制因素
- 自2030年起,可再生能源發電削減將受到處罰(電網使用費)。
- 碳捕集與封存成本的上升削弱了藍氫的競爭力。
- 全球氫能認證互通性滯後
- PEM電池組關鍵礦物相關的地緣政治風險
- 供應鏈分析
- 監理情勢和政策趨勢
- 技術展望
- 波特五力模型
第5章 市場規模與成長預測
- 透過製造方法
- 綠氫能
- 藍氫
- 綠松石(熱解)氫
- 其他
- 透過電解技術
- 鹼
- PEM
- 固體氧化物
- 陰離子交換
- 按規定表格
- 壓縮氣體
- 液態氫
- 氨
- LOHC
- 透過使用
- 交通運輸(燃料電池電動車、鐵路、船舶、航空)
- 工業用途(氨生產、甲醇生產、煉鋼等)
- 發電
- 其他
- 按地區
- 北美洲
- 美國
- 加拿大
- 墨西哥
- 歐洲
- 德國
- 英國
- 法國
- 義大利
- 北歐國家
- 俄羅斯
- 其他歐洲國家
- 亞太地區
- 中國
- 印度
- 日本
- 韓國
- 東南亞國協
- 其他亞太國家
- 南美洲
- 巴西
- 阿根廷
- 其他南美國家
- 中東和非洲
- 沙烏地阿拉伯
- 阿拉伯聯合大公國
- 南非
- 埃及
- 其他中東和非洲國家
- 北美洲
第6章 競爭情勢
- 市場集中度
- 策略趨勢(併購、聯盟、購電協議)
- 市場佔有率分析(主要公司的市場排名和市場佔有率)
- 公司簡介
- Air Liquide
- Linde plc
- Air Products
- Shell
- BP
- Engie
- Orsted
- Plug Power
- Nel ASA
- ITM Power
- Siemens Energy
- Thyssenkrupp Nucera
- Cummins
- Topsoe
- Kawasaki Heavy
- Hyundai Motor Group
- Toyota
- Mitsubishi Power
- Posco Future M
- ADNOC
- ACWA Power
第7章 市場機會與未來展望
According to Mordor Intelligence, the clean hydrogen market size in terms of production capacity is expected to grow from 2.25 MTPA in 2025 to 4.5 MTPA in 2026 and is forecast to reach 13.75 MTPA by 2031 at 25.03% CAGR over 2026-2031.
This report is Segmented by Production Method (Green Hydrogen, Blue Hydrogen, Turquoise Hydrogen, Others), Electrolyzer Technology (Alkaline, PEM, and More), Delivery Form (Compressed Gas, Liquid Hydrogen, and More), Application (Transportation, Industrial, and More), and Geography (North America, Europe, Asia-Pacific, and More). The Market Forecasts are Provided in Terms of Volume (Tons).
Global Clean Hydrogen Market Trends and Insights
Soaring electrolyzer manufacturing over-capacity drives price collapse post-2026
Global nameplate electrolyzer capacity hit 61-63 GW per year in 2025, but only 2.15 GW was operating, creating an oversupply that forced European alkaline prices down to USD 2,407 per kilowatt and PEM to USD 2,547per kilowatt. Chinese vendors control more than half of the installed factory capacity and are exporting modules below cost to maintain their share, impairing Western manufacturers' margins. As hardware deflates, the unsubsidized levelized cost of green hydrogen is projected to fall toward USD 1.50-2.50 per kilogram in high-solar regions by 2030, overtaking blue hydrogen ranges burdened by escalating carbon-capture charges. The price war is accelerating final-investment decisions across the Middle East and India, two locations with abundant low-priced renewable electricity. However, plummeting module prices are squeezing working-capital lines for smaller OEMs, raising the prospect of sector consolidation over the next two years.
IRA-style production tax credits replicated in EU, India, Brazil
The U.S. Inflation Reduction Act's 45V credit of up to USD 3 per kilogram for low-carbon hydrogen has become a global benchmark that Europe's Hydrogen Bank, India's SIGHT scheme, and Brazil's pending incentive framework now mirror. These subsidies establish predictable revenue floors, permitting developers to secure non-recourse debt at lower spreads. India alone earmarked USD 2.4 billion for electrolysis manufacturing and production incentives, triggering a 1 MTPA green-ammonia FID by AM Green. Yet an accelerated sunset clause in the One Big, Beautiful Bill Act, which requires U.S. projects to start construction before January 1, 2028, prompted cancellations exceeding 4.9 MTPA in 2025, underscoring persistent policy risk.
2030-onwards renewable-power curtailment penalties (grid fees)
Germany curtailed 8.2 TWh of green power in 2024 and is introducing time-of-use tariffs that charge electrolyzers USD 5.8-17.4/MWh during surplus periods, undercutting assumptions of zero-cost energy. Similar dynamic-fee pilots are underway in Spain and Denmark. Because alkaline electrolyzers need 5-15 minutes to ramp, they cannot absorb volatility as quickly as lithium-ion storage, prompting regulators to favor batteries for grid balancing. EU rules also force hourly matching between renewable output and hydrogen production, limiting developers' ability to arbitrage cheap imports across bidding zones. From 2030, grid penalties could add USD 0.20-0.50/kg to hydrogen costs, eroding competitiveness versus blue hydrogen in gas-rich regions.
Other drivers and restraints analyzed in the detailed report include:
- Rise of green-premium procurement mandates by steel and ammonia buyers
- Development of H2 pipeline corridors in EU, U.S. Gulf and Middle East
- CCS cost inflation undermines blue-H2 competitiveness
For complete list of drivers and restraints, kindly check the Table Of Contents.
Segment Analysis
Blue hydrogen retained 68.5% of the clean hydrogen market share in 2025, underscoring the early-mover advantage of reforming natural gas paired with carbon capture. Yet the green pathway is on a faster cadence, expanding at 34.6% CAGR through 2031 as falling electrolyzer costs compress the delivered price gap to less than USD 0.20 per kilogram in high-solar regions. That swing reduces the blue premium that once placed steam-reforming projects ahead on project finance models, especially where government incentives for captured carbon have begun to taper. Developers, therefore, continue to break ground on gigawatt-scale electrolysis clusters, such as the 219,000-tonne-per-year NEOM complex, which will anchor large export volumes into Asia.
From 2026 onward, the clean hydrogen market size attached to green projects eclipses blue in announced capacity, even though blue still dominates volumes in operation. CCS cost escalation, running from USD 50-100 per tonne in 2025 toward USD 80-150 per tonne by 2030, erodes blue's price edge, while renewable energy additions, land-leasing reforms, and tax credits speed up electrolysis pipelines. Turquoise hydrogen and biomass gasification has low share of the clean hydrogen market size because of unproven carbon monetization and logistics barriers. Unless CCS price curves flatten, policy risk is expected to dilute further blue project pipelines, opening room for green to become the reference pathway in procurement tenders.
Alkaline systems captured 58.9% of the clean hydrogen market size in 2025, benefiting from lower capital intensity and decades of deployment in the chlor-alkali industry. European module quotations slipped below USD 2,436 per kilowatt during 2025 as Chinese suppliers triggered a price war, widening their reach in export tenders. The PEM segment, however, is closing the gap, helped by iridium-loading reductions from 2-3 grams per kilowatt in 2020 to as low as 0.3-0.5 grams per kilowatt in 2025, cutting catalyst bills by more than 70%. Faster ramp rates and partial-load flexibility, reaching 10% of nameplate capacity in sub-second response, make PEM the preferred option for co-located wind-solar hybrids.
Solid-oxide electrolysis commands a smaller market share, yet pilot runs have logged 72% electrical efficiency and aim for stack-level efficiencies above 85% once industrial waste heat is harvested. That translates into a potential USD 0.30-0.80 per kilogram saving in markets where power costs exceed USD 40 per megawatt-hour, positioning SOEC for steel and ammonia complexes. Meanwhile, anion-exchange membrane prototypes promise PEM-like dynamics without noble metals, but lifetime validation past 40,000 hours is still lacking. Overall, the technology mix is tilting from cost-driven alkaline dominance toward a more balanced profile in which PEM and, later, SOEC carve out applications tied to flexible renewables and high-grade heat integration.
Geography Analysis
Asia-Pacific led with 43.7% of 2025 volumes and should post the highest regional CAGR at 27.4% through 2031. China alone commissioned 25 of the 59 global projects that came online in 2025, including Sinopec's 20,000-tonne-per-year Kuqa electrolyzer complex. India's National Green Hydrogen Mission, backed by USD 2.05 billion in incentives, has seeded more than 1 MTPA of committed capacity across ammonia and mobility pilots. Japan is building import infrastructure that targets 3 MTPA by 2030 and 20 MTPA by 2050, signalling a structural pull on regional exports. Across ASEAN, Indonesia and Vietnam eye low-cost hydropower sites, though execution hinges on port permitting and bankable offtake deals.
Europe accounted for a significant share of the 2025 output but faces challenges due to increasing renewable curtailment penalties and strict temporal matching regulations. Germany curtailed 8.2 TWh of green power in 2024 and is rolling out dynamic grid fees that add USD 0.20-0.50 per kilogram to hydrogen costs. Still, the continent is knitting a pipeline backbone: the 3,300 km SoutH2 Corridor and an 11,600 km first-phase Hydrogen Backbone by 2030. Major clusters in the Netherlands and Spain pair offshore-wind PPAs with 200-250 MW electrolyzers, anchoring refinery supply and export ambitions.
In North America, the U.S. Gulf Coast benefits from 1,000 miles of existing hydrogen pipelines and USD 1.2 billion in hub grants, but the accelerated 45V sunset forces projects to reach FID before 2028, triggering more than 4.9 MTPA of cancellations in 2025. Saudi Arabia's NEOM complex leverages solar resources to deliver green ammonia at USD 1.50-2.50 per kilogram, advancing the region as an export powerhouse. Brazil expects to finalize incentives in 2026 and focus on ammonia export corridors, while South Africa's platinum and iridium mines supply critical PEM catalysts, raising geopolitical stakes for material security.
- Air Liquide
- Linde plc
- Air Products
- Shell
- BP
- Engie
- Orsted
- Plug Power
- Nel ASA
- ITM Power
- Siemens Energy
- Thyssenkrupp Nucera
- Cummins
- Topsoe
- Kawasaki Heavy
- Hyundai Motor Group
- Toyota
- Mitsubishi Power
- Posco Future M
- ADNOC
- ACWA Power
Additional Benefits:
- The market estimate (ME) sheet in Excel format
- 3 months of analyst support
TABLE OF CONTENTS
1 Introduction
- 1.1 Study Assumptions & Market Definition
- 1.2 Scope of the Study
2 Research Methodology
3 Executive Summary
4 Market Landscape
- 4.1 Market Overview
- 4.2 Market Drivers
- 4.2.1 Soaring electrolyser manufacturing over-capacity drives price collapse post-2026
- 4.2.2 IRA-style production tax credits replicated in EU, India, Brazil
- 4.2.3 Rise of "green-premium" procurement mandates by steel & ammonia buyers
- 4.2.4 Development of H2 pipeline corridors in EU, US Gulf & Middle East
- 4.2.5 Corporate PPAs bundling renewable power + H2 offtake
- 4.2.6 Break-through in solid-oxide electrolysis efficiency >85 % (lab-to-pilot)
- 4.3 Market Restraints
- 4.3.1 2030-onwards renewable power curtailment penalties (grid fees)
- 4.3.2 CCS cost inflation undermines blue-H2 competitiveness
- 4.3.3 Delay in global H2 certification interoperability
- 4.3.4 Geopolitical risk around critical minerals for PEM stacks
- 4.4 Supply-Chain Analysis
- 4.5 Regulatory & Policy Landscape
- 4.6 Technological Outlook
- 4.7 Porter's Five Forces
- 4.7.1 Threat of New Entrants
- 4.7.2 Bargaining Power of Buyers
- 4.7.3 Bargaining Power of Suppliers
- 4.7.4 Threat of Substitutes
- 4.7.5 Competitive Rivalry
5 Market Size & Growth Forecasts
- 5.1 By Production Method
- 5.1.1 Green Hydrogen
- 5.1.2 Blue Hydrogen
- 5.1.3 Turquoise (Pyrolysis) Hydrogen
- 5.1.4 Others
- 5.2 By Electrolyzer Technology
- 5.2.1 Alkaline
- 5.2.2 PEM
- 5.2.3 Solid-Oxide
- 5.2.4 Anion-Exchange
- 5.3 By Delivery Form
- 5.3.1 Compressed Gas
- 5.3.2 Liquid Hydrogen
- 5.3.3 Ammonia
- 5.3.4 LOHC
- 5.4 By Application
- 5.4.1 Transportation (FCEV, Rail, Marine, Aviation)
- 5.4.2 Industrial (Ammonia Production, Methanol Production, Steelmaking, etc)
- 5.4.3 Power Generation
- 5.4.4 Others
- 5.5 By Geography
- 5.5.1 North America
- 5.5.1.1 United States
- 5.5.1.2 Canada
- 5.5.1.3 Mexico
- 5.5.2 Europe
- 5.5.2.1 Germany
- 5.5.2.2 United Kingdom
- 5.5.2.3 France
- 5.5.2.4 Italy
- 5.5.2.5 NORDIC Countries
- 5.5.2.6 Russia
- 5.5.2.7 Rest of Europe
- 5.5.3 Asia-Pacific
- 5.5.3.1 China
- 5.5.3.2 India
- 5.5.3.3 Japan
- 5.5.3.4 South Korea
- 5.5.3.5 ASEAN Countries
- 5.5.3.6 Rest of Asia-Pacific
- 5.5.4 South America
- 5.5.4.1 Brazil
- 5.5.4.2 Argentina
- 5.5.4.3 Rest of South America
- 5.5.5 Middle East and Africa
- 5.5.5.1 Saudi Arabia
- 5.5.5.2 United Arab Emirates
- 5.5.5.3 South Africa
- 5.5.5.4 Egypt
- 5.5.5.5 Rest of Middle East and Africa
- 5.5.1 North America
6 Competitive Landscape
- 6.1 Market Concentration
- 6.2 Strategic Moves (M&A, Partnerships, PPAs)
- 6.3 Market Share Analysis (Market Rank/Share for key companies)
- 6.4 Company Profiles (includes Global level Overview, Market level overview, Core Segments, Financials as available, Strategic Information, Products & Services, and Recent Developments)
- 6.4.1 Air Liquide
- 6.4.2 Linde plc
- 6.4.3 Air Products
- 6.4.4 Shell
- 6.4.5 BP
- 6.4.6 Engie
- 6.4.7 Orsted
- 6.4.8 Plug Power
- 6.4.9 Nel ASA
- 6.4.10 ITM Power
- 6.4.11 Siemens Energy
- 6.4.12 Thyssenkrupp Nucera
- 6.4.13 Cummins
- 6.4.14 Topsoe
- 6.4.15 Kawasaki Heavy
- 6.4.16 Hyundai Motor Group
- 6.4.17 Toyota
- 6.4.18 Mitsubishi Power
- 6.4.19 Posco Future M
- 6.4.20 ADNOC
- 6.4.21 ACWA Power
7 Market Opportunities & Future Outlook
- 7.1 White-space & Unmet-need Assessment
 清潔氫能市場規模、佔有率、趨勢和預測:按技術、最終用戶和地區分類,2026-2034年
 清潔氫能市場:按技術、最終用戶和地區分類
 基於再生能源來源的氫氣生產市場分析及預測(至2035年):類型、產品、服務、技術、應用、組件、形式、製程、最終用戶、安裝類型
 清潔氫氣市場規模、佔有率和成長分析(按類型、生產方法、應用和地區分類)-2026-2033年產業預測
 太陽能製氫:全球市場佔有率和排名、總銷售額和需求預測(2025-2031 年)清潔氫氣生產技術市場分析與預測(至2034年):類型、產品、服務、技術、組件、應用、流程、最終用戶、設備
 清潔氫市場報告:2031 年趨勢、預測與競爭分析