

 |
市場調查報告書
商品編碼
2063255
油井精修設備及服務:市場佔有率分析、產業趨勢及統計、成長預測(2026-2031)Well Completion Equipment and Services - Market Share Analysis, Industry Trends & Statistics, Growth Forecasts (2026 - 2031) |
||||||
※ 本網頁內容可能與最新版本有所差異。詳細情況請與我們聯繫。
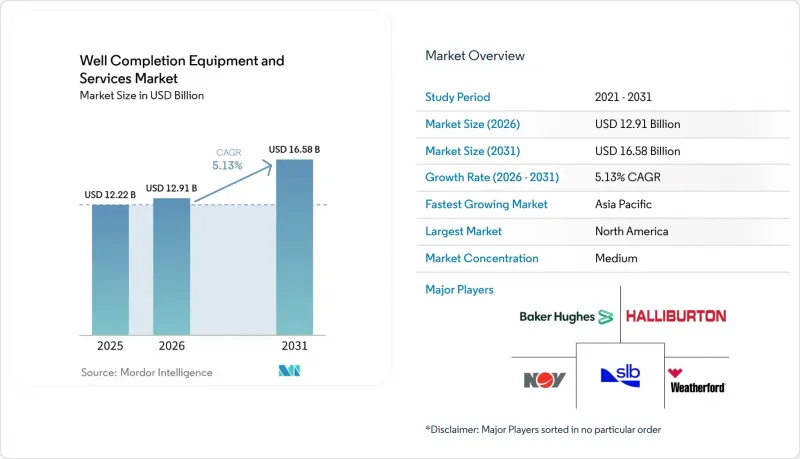
根據 Mordor Intelligence 預測,油井精加工設備和服務市場規模將從 2025 年的 122.2 億美元和 2026 年的 129.1 億美元成長到 2031 年的 165.8 億美元,2026 年至 2031 年的年複合成長率(CAGR)。
本報告按類型(設備:封隔器、侵蝕控制工具、多級壓裂工具、襯管吊架、閥門等;服務:水力壓裂等)、井型(傳統型、傳統型)、應用領域(陸上、海上)和地區(北美、歐洲等)進行細分。市場預測以美元計價。
全球油井修整設備及服務市場趨勢及洞察
全球鑽探活動增加
截至2025年初,全球鑽井鑽機數量達到1,112台,較前一年增加15台,儘管北美地區的鑽井活動減少。這凸顯了中東和亞洲國有業者優先考慮能源安全而非短期利潤的趨勢。沙烏地阿美公司Jafurah計畫的投產以及ADNOC Drilling公司斥資10億美元擴建鑽井平台,都印證了這個趨勢。更深、更熱的油井推動了對耐高溫高壓(HPHT)封隔器、耐腐蝕襯管吊架和多級壓裂工具的需求,預計到2025年下半年,前置作業時間將延長至26週。因此,完井收入的成長速度超過了鑽機數量的成長速度,每口井消耗的增值硬體也更多。 ONGC的Krishna Godavari叢集充分體現了其資本密集的特點,每口井的投入約為6,900萬美元。這些資金大部分用於最終硬體和海底回接工程。
人們越來越關注傳統型蘊藏量
隨著阿根廷、沙烏地阿拉伯和中國效仿北美頁岩油氣經濟模式,傳統型蘊藏量的開發正以每年6.9%的速度成長。在瓦卡穆埃爾塔(Vaca Muerta),2025年共進行了23,784次壓裂作業,較去年同期成長34%。此外,到2032年,還需要新增1,000口井,以滿足國內需求和液化天然氣(LNG)供應承諾。沙烏地阿美公司的賈夫拉(Jafurah)氣田計畫在2030年採用低碳電壓裂系統,實現日產20億標準立方英尺(scf/d)天然氣。同時,在中國四川盆地和鄂爾多斯盆地,光纖監測技術的引進使完井時間縮短了18%。以本地為中心的供應鏈和政府資金支持正在降低學習曲線,並推動完井設備和服務市場向北美以外的地區多元化發展。
原油價格波動
2025年布蘭特原油均價為每桶69美元,但到2026年3月飆升至每桶94美元。這36%的波動給完井預算帶來了壓力,因為上市的油氣探勘開發公司儘管面臨價格上漲,卻仍保持支出穩定。 2026年第一季,儘管柴油燃料成本上漲,水力壓裂的日租金卻下降了8%,這給壓裂泵業者的利潤率帶來了壓力。海上專案受價格波動的影響較小,因為它們的完井進度受到多年合約的保障,但探勘預算和未來的鑽井計劃仍然會受到價格趨勢的影響。
細分市場分析
隨著營運商將水力壓裂、纜線和層間隔離等作業外包,預計到2031年,業務收益將以6.8%的複合年成長率成長。 Liberty公司2025年第三季7.27億美元的營收凸顯了市場對電壓裂(e-frac)設備日益成長的需求,該設備可降低30%的燃料消耗。纜線正向智慧鑽井服務轉型,斯倫貝謝公司的ReSOLVE iX平台可將非生產時間減少12%。在深水井中,砂粒控制對於保護數十億美元的投資至關重要,因此對礫石填充的需求也不斷成長。
在2025年的油井完井設備和服務市場中,設備市佔率維持在54.4%。這主要得益於封隔器、多級壓裂工具和襯管吊架等產品的強勁成長,但隨著維修計劃延長工具壽命並降低更換頻率,設備市場的成長速度正在放緩。 NOV公司在2025年第四季錄得價值4.2億美元的油井完井設備訂單,其中大部分用於圭亞那和巴西的海底系統。能夠轉型至高溫高壓(HPHT)或海底等細分領域,或提供捆綁式安裝服務的供應商,預計將維持利潤率。
區域分析
預計到2025年,北美仍將維持40.3%的市場佔有率,但各盆地之間的差距正在擴大。二疊紀盆地透過在EPA甲烷排放關稅實施前採用電子壓裂技術減少排放以及鑽探更長的水平井,保持了成長動能。同時,巴肯盆地和鷹灘盆地由於營運商優先考慮自由現金流,產量下降。加拿大Montney和杜韋爾奈盆地則依靠高產量開採,其建造成本最終計入液化天然氣出口價值鏈。
亞太地區正經歷最快成長,成長速度達7.2%。中海油的文昌16-2、荊州11-4和番禺擴建工程配備了防砂篩管和高溫高壓封隔器,預計到2025年,透過海底完井作業,日產量將增加10萬桶油當量以上。同時,印度石油天然氣公司(ONGC)的克里希納-戈達瓦里叢集通過8口井,日產量為2.5萬桶,投資額達4.7728億美元。印尼和馬來西亞的傳統天然氣開發項目正在推動合作協議的達成;例如,印尼國家石油公司(Pertamina)已與哈里伯頓公司簽署協議,並計劃於2025年實現完井作業的自動化。
在中東和非洲,關注的焦點是沙烏地阿美公司的賈富拉(Jafurah)和阿布達比國家石油公司(ADNOC)的薩爾布(SARB)深水天然氣開發項目,以及德希尼布FMC公司在西非的綜合海底作業。 ADNOC鑽井公司計劃在2025年投資超過10億美元後,到2028年將鑽機數量擴大到151座,顯示除了石油開採之外,長期完工作業需求依然存在。南美洲的瓦卡穆爾塔(Vaca Muerta)油田仍是亮點,壓裂作業量年增34%,並且已獲準向巴西石油公司(Petrobras)跨境銷售天然氣,這將確保未來十年作業活動的持續開展。
其他好處:
- Excel格式的市場預測(ME)表
- 3個月的分析師支持
目錄
第1章:引言
- 研究假設和市場定義
- 調查範圍
第2章:調查方法
第3章執行摘要
第4章 市場狀況
- 市場概覽
- 市場促進因素
- 全球鑽探活動增加
- 人們越來越關注傳統型蘊藏量。
- 對先進完井技術的需求日益成長
- 深海海洋產業資本投資的復甦
- 電氣化 FLAK 車隊可降低營運成本 (OpEx) 和二氧化碳排放量。
- 將已完工的油井改造為碳捕集、利用與封存(CCUS)井和地熱井
- 市場限制因素
- 原油價格波動
- 更嚴格的環境和監管措施
- 高溫高壓級彈性體及合金供不應求
- 數據平台之間的互通性差距
- 供應鏈分析
- 監理情勢
- 技術展望
- 波特五力模型
第5章 市場規模與成長預測
- 按類型
- 裝置
- 包裝工
- 水土保持工具
- 多層次破碎工具
- 襯管吊架
- 閥門和其他
- 服務
- 水力壓裂
- 有線服務
- 穿孔
- 礫石填築
- 區域隔離服務
- 裝置
- 按井類型
- 傳統的
- 傳統型
- 透過使用
- 陸上
- 離岸
- 按地區
- 北美洲
- 美國
- 加拿大
- 墨西哥
- 歐洲
- 德國
- 英國
- 法國
- 義大利
- 北歐國家
- 俄羅斯
- 其他歐洲國家
- 亞太地區
- 中國
- 印度
- 日本
- 韓國
- 東南亞國協
- 其他亞太國家
- 南美洲
- 巴西
- 阿根廷
- 其他南美國家
- 中東和非洲
- 沙烏地阿拉伯
- 阿拉伯聯合大公國
- 南非
- 埃及
- 其他中東和非洲國家
- 北美洲
第6章 競爭情勢
- 市場集中度
- 策略趨勢(併購、聯盟、購電協議)
- 市場佔有率分析(主要公司的市場排名和佔有率)
- 公司簡介
- Schlumberger
- Halliburton
- Baker Hughes
- Weatherford
- NOV
- TechnipFMC
- Superior Energy Services
- Trican Well Service
- Nine Energy Service
- TAM International
- Liberty Oilfield Services
- NexTier Oilfield Solutions
- Calfrac Well Services
- FTS International
- Packers Plus Energy Services
- Welltec
- Archer Limited
- Patterson-UTI Pressure Pumping
- Core Laboratories
- CNPC Chuanqing Drilling & Completion
第7章 市場機會與未來展望
According to Mordor Intelligence, the well completion equipment and Services Market size is projected to expand from USD 12.22 billion in 2025 and USD 12.91 billion in 2026 to USD 16.58 billion by 2031, registering a CAGR of 5.13% between 2026 to 2031.
This report is Segmented by Type (Equipment: Packers, Sand-Control Tools, Multi-Stage Fracturing Tools, Liner Hangers, Valves and Others; Services: Hydraulic Fracturing, and More), Well Type (Conventional, Unconventional), Application (Onshore, Offshore), and Geography (North America, Europe, and Others). The Market Forecasts are Provided in Terms of Value (USD).
Global Well Completion Equipment and Services Market Trends and Insights
Rise in Global Drilling Activities
International rig counts climbed to 1,112 units in early 2025, adding 15 rigs year-on-year even as North American activity contracted, highlighting a pivot toward state-owned operators in the Middle East and Asia that prioritize energy security over short-cycle returns. Saudi Aramco's Jafurah start-up and ADNOC Drilling's USD 1 billion fleet expansion underline this trend. Deeper, hotter wells are driving demand for HPHT-rated packers, corrosion-resistant liner hangers, and multi-stage fracturing tools, pushing lead times to 26 weeks in late 2025. Completion revenue is therefore rising faster than rig count because every well consumes more value-added hardware. ONGC's Krishna-Godavari cluster evidences the capital intensity, with roughly USD 69 million spent per well, most of which funds completion hardware and subsea tie-backs.
Increasing Focus on Unconventional Reserves
Unconventional plays are expanding at 6.9% annually as Argentina, Saudi Arabia, and China replicate North American shale economics. Vaca Muerta executed 23,784 fracturing stages in 2025, up 34% year-on-year, and will require another 1,000 wells by 2032 to meet domestic and LNG commitments. Saudi Aramco's Jafurah aims for 2 billion scf/d of gas by 2030 from carbon-lite electric frac fleets, while China's Sichuan and Ordos basins employ fiber-optic monitoring to trim completion time by 18%. Localized supply chains and state financing are smoothing learning curves, allowing the well-completion equipment and services market to diversify beyond North America.
Volatile Crude-Oil Prices
Brent averaged USD 69/bbl in 2025 before spiking to USD 94 in March 2026, a 36% swing that compressed completion budgets as listed E&Ps held spending flat despite higher prices. Day rates for hydraulic fracturing slipped 8% in Q1 2026 even as diesel costs rose, squeezing pressure-pumper margins. Offshore projects are less price-sensitive because multi-year commitments insulate completion schedules, yet exploration budgets and the future pipeline of wells remain tied to price sentiment.
Other drivers and restraints analyzed in the detailed report include:
- Electrified Frac Fleets Reduce OpEx/CO2
- Repurposing Completions for CCUS and Geothermal Wells
- HPHT-Grade Elastomer and Alloy Shortages
For complete list of drivers and restraints, kindly check the Table Of Contents.
Segment Analysis
Services revenue is projected to grow at a 6.8% CAGR to 2031 as operators outsource hydraulic fracturing, wireline, and zonal isolation. Liberty's USD 727 million Q3 2025 revenue highlights demand for e-frac fleets that save 30% in fuel. Wireline is evolving into an intelligent-perforation service, with Schlumberger's ReSOLVE iX platform reducing non-productive time by 12%. Gravel-packing demand is climbing in deepwater wells where sand control protects billion-dollar investments.
Equipment maintained a 54.4% share of the well completion equipment and services market size in 2025, fueled by packers, multi-stage fracturing tools, and liner hangers, yet growth is slowing as refurbishment programs increasingly extend tool lifespans and decrease replacement frequency. NOV logged USD 420 million in completion-equipment orders for Q4 2025, mainly from subsea systems destined for Guyana and Brazil. Suppliers able to pivot into HPHT and subsea niches or bundle installation services stand to defend margins.
Geography Analysis
North America maintained a 40.3% share in 2025, yet basin-level divergence is widening. The Permian sustains momentum with longer laterals and e-frac adoption that lowers emissions ahead of EPA methane fees, while the Bakken and Eagle Ford contract as operators prioritize free cash flow. Canada's Montney and Duvernay programs rely on high-rate pumping and dissipate completion dollars into LNG export value chains.
Asia-Pacific is the fastest-growing region at 7.2%. CNOOC's Wenchang 16-2, Weizhou 11-4, and Panyu expansions added more than 100,000 boe/d in 2025 through subsea completions equipped with sand-control screens and HPHT packers, while ONGC's Krishna-Godavari cluster produced 25,000 b/d from eight wells and a USD 477.28 million investment . Indonesian and Malaysian unconventional gas targets are driving collaboration accords, such as Pertamina's 2025 pact with Halliburton to automate completions.
The Middle East and Africa revolve around Aramco's Jafurah and ADNOC's SARB deep-gas buildouts, along with TechnipFMC's integrated subsea work in West Africa. ADNOC Drilling plans to expand its fleet to 151 rigs by 2028 after investing more than USD 1 billion in 2025, signaling longer-term completion demand beyond oil recovery. South America's Vaca Muerta remains a bright spot, with a 34% annual jump in fracture stages and cross-border gas sales approved to Petrobras, ensuring sustained activity through the decade.
- Schlumberger
- Halliburton
- Baker Hughes
- Weatherford
- NOV
- TechnipFMC
- Superior Energy Services
- Trican Well Service
- Nine Energy Service
- TAM International
- Liberty Oilfield Services
- NexTier Oilfield Solutions
- Calfrac Well Services
- FTS International
- Packers Plus Energy Services
- Welltec
- Archer Limited
- Patterson-UTI Pressure Pumping
- Core Laboratories
- CNPC Chuanqing Drilling & Completion
Additional Benefits:
- The market estimate (ME) sheet in Excel format
- 3 months of analyst support
TABLE OF CONTENTS
1 Introduction
- 1.1 Study Assumptions and Market Definition
- 1.2 Scope of the Study
2 Research Methodology
3 Executive Summary
4 Market Landscape
- 4.1 Market Overview
- 4.2 Market Drivers
- 4.2.1 Rise in global drilling activities
- 4.2.2 Increasing focus on unconventional reserves
- 4.2.3 Growing demand for advanced well-completion techniques
- 4.2.4 Offshore deep-water CAPEX rebound
- 4.2.5 Electrified frac fleets reduce OpEx/CO2
- 4.2.6 Repurposing completions for CCUS and geothermal wells
- 4.3 Market Restraints
- 4.3.1 Volatile crude-oil prices
- 4.3.2 Environmental and regulatory stringency
- 4.3.3 HPHT-grade elastomer and alloy shortages
- 4.3.4 Data-platform interoperability gaps
- 4.4 Supply-Chain Analysis
- 4.5 Regulatory Landscape
- 4.6 Technological Outlook
- 4.7 Porter's Five Forces
- 4.7.1 Threat of New Entrants
- 4.7.2 Bargaining Power of Buyers
- 4.7.3 Bargaining Power of Suppliers
- 4.7.4 Threat of Substitutes
- 4.7.5 Competitive Rivalry
5 Market Size & Growth Forecasts
- 5.1 By Type
- 5.1.1 Equipment
- 5.1.1.1 Packers
- 5.1.1.2 Sand-control tools
- 5.1.1.3 Multi-stage fracturing tools
- 5.1.1.4 Liner hangers
- 5.1.1.5 Valves and others
- 5.1.2 Services
- 5.1.2.1 Hydraulic fracturing
- 5.1.2.2 Wireline services
- 5.1.2.3 Perforating
- 5.1.2.4 Gravel packing
- 5.1.2.5 Zonal-isolation services
- 5.1.1 Equipment
- 5.2 By Well Type
- 5.2.1 Conventional
- 5.2.2 Unconventional
- 5.3 By Application
- 5.3.1 Onshore
- 5.3.2 Offshore
- 5.4 By Geography
- 5.4.1 North America
- 5.4.1.1 United States
- 5.4.1.2 Canada
- 5.4.1.3 Mexico
- 5.4.2 Europe
- 5.4.2.1 Germany
- 5.4.2.2 United Kingdom
- 5.4.2.3 France
- 5.4.2.4 Italy
- 5.4.2.5 NORDIC Countries
- 5.4.2.6 Russia
- 5.4.2.7 Rest of Europe
- 5.4.3 Asia-Pacific
- 5.4.3.1 China
- 5.4.3.2 India
- 5.4.3.3 Japan
- 5.4.3.4 South Korea
- 5.4.3.5 ASEAN Countries
- 5.4.3.6 Rest of Asia-Pacific
- 5.4.4 South America
- 5.4.4.1 Brazil
- 5.4.4.2 Argentina
- 5.4.4.3 Rest of South America
- 5.4.5 Middle East and Africa
- 5.4.5.1 Saudi Arabia
- 5.4.5.2 United Arab Emirates
- 5.4.5.3 South Africa
- 5.4.5.4 Egypt
- 5.4.5.5 Rest of Middle East and Africa
- 5.4.1 North America
6 Competitive Landscape
- 6.1 Market Concentration
- 6.2 Strategic Moves (M&A, Partnerships, PPAs)
- 6.3 Market Share Analysis (Market Rank/Share for key companies)
- 6.4 Company Profiles (includes Global level Overview, Market level overview, Core Segments, Financials as available, Strategic Information, Products & Services, and Recent Developments)
- 6.4.1 Schlumberger
- 6.4.2 Halliburton
- 6.4.3 Baker Hughes
- 6.4.4 Weatherford
- 6.4.5 NOV
- 6.4.6 TechnipFMC
- 6.4.7 Superior Energy Services
- 6.4.8 Trican Well Service
- 6.4.9 Nine Energy Service
- 6.4.10 TAM International
- 6.4.11 Liberty Oilfield Services
- 6.4.12 NexTier Oilfield Solutions
- 6.4.13 Calfrac Well Services
- 6.4.14 FTS International
- 6.4.15 Packers Plus Energy Services
- 6.4.16 Welltec
- 6.4.17 Archer Limited
- 6.4.18 Patterson-UTI Pressure Pumping
- 6.4.19 Core Laboratories
- 6.4.20 CNPC Chuanqing Drilling & Completion
7 Market Opportunities & Future Outlook
- 7.1 White-space & unmet-need assessment


