

 |
市場調查報告書
商品編碼
2063253
地下天然氣儲存:市場佔有率分析、產業趨勢與統計、成長預測(2026-2031)Underground Gas Storage - Market Share Analysis, Industry Trends & Statistics, Growth Forecasts (2026 - 2031) |
||||||
※ 本網頁內容可能與最新版本有所差異。詳細情況請與我們聯繫。
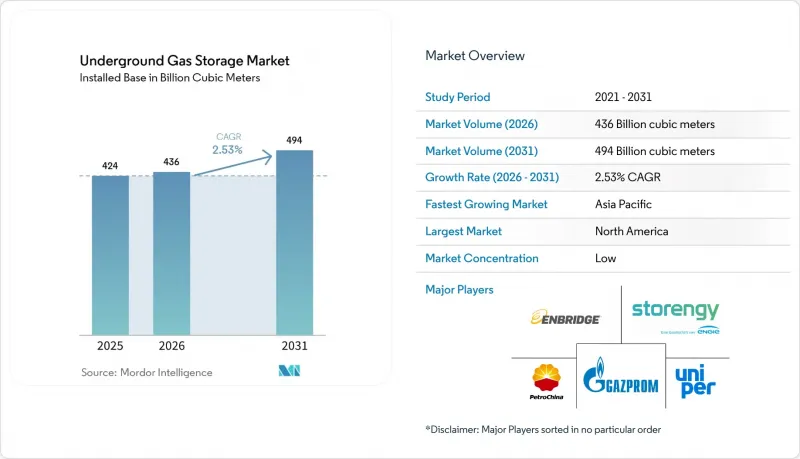
根據 Mordor Intelligence 預測,地下天然氣儲存市場(以裝置容量計算)預計將從 2025 年的 4,240 億立方公尺和 2026 年的 4,360 億立方公尺成長到 2031 年的 4,940 億立方米,2026 年至 2031 年的年複合成長率(CAGR)。
本報告按類型(枯竭儲存、鹽洞等)、儲水容量等級(小於10億立方英尺、10億至50億立方英尺、其他)、應用(季節性、戰略性、其他)、最終用戶(公共產業、工業、其他)和地區(北美、歐洲、亞太、南美、中東和非洲)進行細分。市場預測以體積(十億立方米)為單位。
全球地下儲氣市場趨勢及洞察
對季節性和策略性運作氣體的需求
季節性暖氣需求和具有法律約束力的儲氣義務支撐著天然氣利用率。德國已強制規定2024年冬季的天然氣儲備量為78太瓦時(TWh),而歐盟則規定每年11月天然氣儲量必須達到90%,這迫使公共產業確保更多的運作氣量和注入能力。印度累計7億美元用於第二階段戰略天然氣儲備,為枯竭的氣井增加30億至40億立方米的儲量,從而降低其對液化天然氣進口的依賴。中國石油透過斥資55.9億美元收購其北部省份的舊氣田,穩定了當地的季節性需求波動,並新增了60億立方公尺的運作能。這些政策主導的擴張正在形成天然氣利用率的結構性下限,保護營運商免受現貨價格劇烈波動的影響,並支持長期投資。
燃氣發電規模擴大和抑低尖峰負載需求
從煤炭轉向天然氣以及可再生能源的間歇性,都提升了短週期儲能的價值。北美電力可靠性委員會 (NERC) 的一份報告指出,日供給能力超過 70 億立方英尺 (Bcf) 將使北美電力公司能夠在滿足日常需求波動的同時,避免渦輪機運作。鹽隧道儲能可以滿足每小時的周期性需求。安大略省的安橋公司 (Enbridge) 正在投資 4 億美元建設 Dawn Hub,以在燃煤發電廠逐步淘汰之際,為該州電網增加每日 15 億立方英尺的供給能力。印度計劃在 2030 年之前將其天然氣發電裝置容量增加兩倍,這要求古吉拉突邦和拉賈斯坦邦的含水層和枯竭油田項目調整以應對季風帶來的需求下降。
除了巨額的資金成本外,還有緩衝氣體成本的負擔。
西班牙天然氣工業委員會 (CEDIGAZ) 預計,到 2035 年,累積投資需求將達到 1,000 億至 1,700 億歐元,其中儲存氣藏的改造成本為每兆瓦時 190 歐元,新建洞穴氣藏計畫的成本為每兆瓦時 235 歐元。在含水層氣藏工程中,45% 至 80% 的產能將固定為基礎天然氣。假設 2025 年現貨價格約為每百萬英熱單位 3 美元,一個 100 億立方英尺規模的氣藏項目將有 1500 萬至 2400 萬美元的固定成本,而這部分成本無法產生收益。印度政府已為該戰略計畫撥款高達 20 億美元,這意味著財政壓力可能會導致計畫延期。
細分市場分析
到2025年,枯竭的儲存將佔總儲氣能力的78.5%,這反映出20-40%的有利緩衝氣比例。同時,由於鹽穴能夠按小時循環運作並儲存氫氣,其複合年成長率預計將達到9.1%。鹽穴倉儲設施的地下儲氣市場規模預計將比含水層儲氣市場成長更快。這是因為鹽穴的日供給能力超過10億立方英尺(Bcf),這對於平衡高比例可再生能源電網至關重要。
儘管枯竭油田因其季節性用途在資本效率方面仍具有優勢,但監管部門對氫能的支持正使鹽庫倉儲設施更具吸引力。德國聯邦經濟事務和氣候行動部(BMWK)預測,到2045年,將有250個儲存改造為氫氣倉儲設施,從而確保76-80太瓦時的氫氣儲存能力。森特理克公司宣布,將投資20億英鎊,2050年改造540億立方英尺的儲存儲氣庫,使其可用於氫氣儲存。這表明,隨著脫碳進程的推進,現有企業正在重新配置資產,以保護其在地下天然氣儲存市場的佔有率。
到2025年,儲量超過200億立方英尺(Bcf)的天然氣田將佔總裝置容量的54%,其中以拉夫(Rough)和金三角(Golden Triangle)等巨型儲存主導。這些氣田具有規模經濟優勢,裝機協議也更為簡單。儘管如此,儲量在50億至200億立方英尺之間的天然氣田預計將以每年6.8%的速度成長,因為中游運營商正在收購工業集群附近的閒置礦區。威廉斯公司(Williams Companies)斥資19.5億美元收購路易斯安那州和密西西比州1150億立方英尺的天然氣田,便是這種擴大策略的鮮明例證。
監管正在推動產業整合。美國環保署(EPA)的甲烷排放法規適用於每日處理量超過5,000萬立方英尺(MMcf)的設施,由此產生的合規成本對於小規模設施而言難以負擔。因此,投資者傾向於選擇規模大規模、收入來源多元化且單位成本更低的資產,從而加速了地下天然氣儲存市場向更高容量層級的轉型。
區域分析
到2025年,北美將佔據地下天然氣儲存市場37.9%的佔有率,擁有超過400座設施,總合運作容量達4.8兆立方英尺(Tcf)。在美國,為符合美國環保署(EPA)2024年甲烷排放法規而維修工程,已使已探明峰值儲存能力增加了700億立方英尺(Bcf)。同時,加拿大的Dawn Hub擴建工程旨在確保每日新增15億立方英尺(Bcf)的供給能力。 Six Street和Carice等私募股權公司已收購了Central Valley Storage和Golden Triangle Storage,以確保獲得對沖通膨的穩定現金流。
能源安全需求正推動歐洲儲能能力的擴張。根據“補充指令”,德國將在2024年底前儲存78太瓦時(TWh)的氫氣,德國聯邦經濟事務和氣候部(BMWK)預計到2030年將儲存2-7太瓦時的氫氣。英國已重新啟用其位於魯夫(Rough)的倉儲設施,並撥款20億英鎊用於氫氣轉化。同時,丹麥的里爾-特魯普(Lille-Trup)洞穴倉儲設施計畫於2030年與一條通往荷蘭的550公里長的管道連接。俄羅斯目前仍保持大規模的儲氫規模,但由於制裁導致出口轉向東方,其前景尚不明朗。
亞太地區是成長最快的地下天然氣儲存市場,預計到2031年將以每年11.5%的速度成長。中國已躍升至全球第六位,新增60億立方公尺儲存能力,並以59億美元的成本保障了109.7億立方公尺可用天然氣。印度的第二階段計畫預計到2030年將投資30億至40億立方米,而日本大阪燃氣公司正在投資4.69億美元建造連接地下倉儲設施的抗震管道。韓國麗水和蔚山液化LNG接收站正在提升尖峰時段供給能力,且不受地質障礙的影響,而東南亞國協正在探索試點項目,以支持新興的燃氣發電廠。
其他好處:
- Excel格式的市場預測(ME)表
- 3個月的分析師支持
目錄
第1章:引言
- 研究假設和市場定義
- 調查範圍
第2章:調查方法
第3章執行摘要
第4章 市場狀況
- 市場概覽
- 市場促進因素
- 運作天然氣的季節性和策略性需求
- 燃氣發電規模擴大和抑低尖峰負載需求
- 俄烏危機後的能源安全多角化
- 地下儲能系統與低碳氫能樞紐的整合
- 數位雙胞胎和人工智慧驅動的儲存最佳化提高了經濟效益。
- 甲烷洩漏法規將加快維修計畫的實施。
- 市場限制因素
- 除了高昂的資本成本外,還有緩衝氣體的成本負擔。
- 環境、地震及海水處置風險
- 電池儲能和液化天然氣再氣化是相互競爭的峰值負載電源。
- 長壽命天然氣資產淨零排放政策的不確定性
- 供應鏈分析
- 監理情勢
- 技術展望
- 波特五力模型
第5章 市場規模與成長預測
- 按類型
- 枯竭的天然氣儲存
- 鹽洞
- 儲存儲層
- 液化天然氣回注設施
- 按儲存容量等級
- 少於10億立方英尺
- 1~5 Bcf
- 5~20 Bcf
- 200億立方英尺或更多
- 透過使用
- 季節性存儲
- 戰略儲備
- 尖峰用電調節
- 負荷調整和負荷管理
- 最終用戶
- 天然氣和電力業務
- 工業和石油化工
- 商業和住宅經銷商
- 中游營運商
- 政府和緊急應變機構
- 按地區
- 北美洲
- 美國
- 加拿大
- 墨西哥
- 歐洲
- 德國
- 英國
- 法國
- 義大利
- 北歐國家
- 俄羅斯
- 其他歐洲國家
- 亞太地區
- 中國
- 印度
- 日本
- 韓國
- 東南亞國協
- 其他亞太國家
- 南美洲
- 巴西
- 阿根廷
- 其他南美國家
- 中東和非洲
- 沙烏地阿拉伯
- 阿拉伯聯合大公國
- 南非
- 埃及
- 其他中東和非洲國家
- 北美洲
第6章 競爭情勢
- 市場集中度
- 策略趨勢(併購、聯盟、購電協議)
- 市場佔有率分析(主要公司的市場排名和佔有率)
- 公司簡介
- Gazprom
- PetroChina(CNPC)
- Royal Dutch Shell plc
- TotalEnergies SE
- Chevron Corp.
- Uniper SE
- Enbridge Inc.
- TC Energy Corp.
- NAFTA as
- Eni SpA
- Storengy(ENGIE)
- Centrica Storage
- Kinder Morgan
- RWE Gas Storage
- INEOS Energy Storage
- Linde Engineering(Hydrogen Caverns)
- Enagas SA
- Osaka Gas Co.
- Gasunie(Gasunie UGS)
- Energinet DK
第7章 市場機會與未來展望
According to Mordor Intelligence, the underground gas storage market size in terms of installed base is projected to expand from 424 billion cubic meters in 2025 and 436 billion cubic meters in 2026 to 494 billion cubic meters by 2031, registering a CAGR of 2.53% between 2026 and 2031.
This report is Segmented by Type (Depleted Reservoirs, Salt Caverns, and More), Storage-Capacity Class (Below 1 Bcf, 1-5 Bcf, and More), Application (Seasonal, Strategic, and More), End-User (Utilities, Industrial, and More), and Geography (North America, Europe, Asia-Pacific, South America, Middle East and Africa). The Market Forecasts are Provided in Terms of Volume (bcm).
Global Underground Gas Storage Market Trends and Insights
Demand for Seasonal & Strategic Working Gas
Seasonal heating cycles and binding storage mandates underpin utilization levels. Germany required 78 TWh of reserves for winter 2024, while the European Union set a 90% fill rule each November, pushing utilities to secure more working gas and injection capacity. India earmarked USD 700 million in its 2025 budget for Phase II strategic gas reserves that will add 3-4 bcm in depleted wells, trimming LNG-import exposure. PetroChina added 6 bcm of working capacity by purchasing former production fields for USD 5.59 billion, stabilizing seasonal swings in northern provinces. Such policy-led expansions create a structural utilization floor, shielding operators from spot-price shocks and supporting long-cycle investment.
Growing Gas-Fired Power Generation & Peak-Shaving Demand
Coal-to-gas switching and renewable intermittency boost the premium on rapid-cycle storage. NERC reports that deliverability above 70 Bcf per day lets North American utilities meet intra-day ramps without over-scheduling turbines . Salt caverns satisfy hourly cycling; Enbridge's Dawn Hub in Ontario is investing USD 400 million to add 1.5 Bcf per day of deliverability for the province's grid as coal plants retire . India plans to triple gas-fired capacity by 2030, requiring aquifer and depleted-field projects in Gujarat and Rajasthan to modulate monsoon-related demand troughs.
High Capital Plus Cushion-Gas Cost Burden
CEDIGAZ pegs the cumulative investment need at EUR 100-170 billion through 2035, with depleted-reservoir conversions costing EUR 190 per MWh and greenfield caverns EUR 235 per MWh . Aquifer projects immobilize 45-80% of capacity in base gas; at 2025 spot prices near USD 3/MMBtu, a 10 Bcf site locks up USD 15-24 million that yields no revenue. India's government budgeted up to USD 2 billion for its strategic program, showing how fiscal pressure can delay timelines.
Other drivers and restraints analyzed in the detailed report include:
- Energy-Security Diversification after Russia-Ukraine Crisis
- Integration of UGS with Low-Carbon Hydrogen Hubs
- Battery Storage & LNG Regasification as Competing Peakers
For complete list of drivers and restraints, kindly check the Table Of Contents.
Segment Analysis
Depleted reservoirs delivered 78.5% of capacity in 2025, reflecting their favorable cushion-gas ratios of 20-40%, yet salt caverns are on a 9.1% CAGR trajectory because they enable hourly cycling and hydrogen storage. The underground gas storage market size for salt caverns is projected to expand faster than aquifers because caverns support deliverability of 1 Bcf per day or more, a crucial attribute for balancing renewable-heavy grids.
Capital efficiency still favors depleted fields for seasonal roles, but regulatory pushes toward hydrogen raise the appeal of caverns. Germany's BMWK foresees 250 caverns converting for 76-80 TWh hydrogen capacity by 2045. Centrica committed GBP 2 billion to ready the 54 Bcf Rough site for hydrogen by 2050, showing incumbents repositioning assets to defend the underground gas storage market share amid decarbonization.
Sites above 20 Bcf controlled 54% of installed capacity in 2025, led by mega-reservoirs such as Rough and Golden Triangle, which offer economies of scale and simplified offtake contracts. Still, 5-20 Bcf facilities will grow 6.8% annually as midstream operators acquire stranded fields near industrial clusters. Williams Companies' USD 1.95 billion purchase of 115 Bcf in Louisiana and Mississippi illustrates this scaling tactic.
Regulation nudges consolidation upward. The EPA methane rule applies to throughput above 50 MMcf per day, adding compliance costs that smaller sites struggle to absorb. Consequently, investors gravitate to larger assets with diversified revenue and lower unit costs, reinforcing a tilt toward the upper capacity tiers of the underground gas storage market.
Geography Analysis
North America held 37.9% of the underground gas storage market share in 2025, underpinned by more than 400 facilities totaling 4.8 Tcf of working capacity. The U.S. added 70 Bcf of demonstrated peak capacity after retrofits aligned with the EPA's 2024 methane rule, while Canada's Dawn Hub expansion targets 1.5 Bcf per day of new deliverability. Private-equity firms such as Sixth Street and Caliche bought Central Valley and Golden Triangle Storage to capture stable, inflation-hedged cash flows.
Energy-security imperatives drive Europe's capacity build. Germany stored 78 TWh by late 2024 under its refill decree, and BMWK foresees 2-7 TWh of hydrogen storage by 2030. The UK reopened Rough and earmarked GBP 2 billion for hydrogen conversion, while Denmark's Lille Torup caverns will tie into a 550 km pipeline to the Netherlands by 2030. Russia remains sizable but opaque as sanctions steer exports eastward.
Asia-Pacific represents the fastest-growing underground gas storage market, expanding 11.5% per year to 2031. China moved to sixth globally after adding 6 bcm of capacity and acquiring 10.97 bcm of working gas for USD 5.9 billion. India's Phase II program funds 3-4 bcm by 2030, and Japan's Osaka Gas invests USD 469 million for quake-proofed pipelines linked to underground storage. South Korea's Yeosu and Ulsan LNG terminals enhance peaking supply without geological barriers, while ASEAN states explore pilots to backstop nascent gas-fired power fleets.
- Gazprom
- PetroChina (CNPC)
- Royal Dutch Shell plc
- TotalEnergies SE
- Chevron Corp.
- Uniper SE
- Enbridge Inc.
- TC Energy Corp.
- NAFTA a.s.
- Eni SpA
- Storengy (ENGIE)
- Centrica Storage
- Kinder Morgan
- RWE Gas Storage
- INEOS Energy Storage
- Linde Engineering (Hydrogen Caverns)
- Enagas S.A.
- Osaka Gas Co.
- Gasunie (Gasunie UGS)
- Energinet DK
Additional Benefits:
- The market estimate (ME) sheet in Excel format
- 3 months of analyst support
TABLE OF CONTENTS
1 Introduction
- 1.1 Study Assumptions & Market Definition
- 1.2 Scope of the Study
2 Research Methodology
3 Executive Summary
4 Market Landscape
- 4.1 Market Overview
- 4.2 Market Drivers
- 4.2.1 Demand for seasonal & strategic working gas
- 4.2.2 Growing gas-fired power generation & peak-shaving demand
- 4.2.3 Energy-security diversification after Russia-Ukraine crisis
- 4.2.4 Integration of UGS with low-carbon hydrogen hubs
- 4.2.5 Digital-twin & AI reservoir optimisation boosts economics
- 4.2.6 Methane-leakage regulations incentivising retrofit projects
- 4.3 Market Restraints
- 4.3.1 High capital plus cushion-gas cost burden
- 4.3.2 Environmental, seismic & brine-disposal risks
- 4.3.3 Battery-storage & LNG regasification as competing peakers
- 4.3.4 Net-zero policy uncertainty for long-lived gas assets
- 4.4 Supply-Chain Analysis
- 4.5 Regulatory Landscape
- 4.6 Technological Outlook
- 4.7 Porter's Five Forces
- 4.7.1 Threat of New Entrants
- 4.7.2 Bargaining Power of Buyers
- 4.7.3 Bargaining Power of Suppliers
- 4.7.4 Threat of Substitutes
- 4.7.5 Competitive Rivalry
5 Market Size & Growth Forecasts
- 5.1 By Type
- 5.1.1 Depleted Gas Reservoirs
- 5.1.2 Salt Caverns
- 5.1.3 Aquifer Reservoirs
- 5.1.4 LNG Re-injection Facilities
- 5.2 By Storage-Capacity Class
- 5.2.1 Below 1 Bcf
- 5.2.2 1 to 5 Bcf
- 5.2.3 5 to 20 Bcf
- 5.2.4 Above 20 Bcf
- 5.3 By Application
- 5.3.1 Seasonal Storage
- 5.3.2 Strategic Reserve
- 5.3.3 Peak Shaving
- 5.3.4 Balancing and Load Management
- 5.4 By End-user
- 5.4.1 Gas and Power Utilities
- 5.4.2 Industrial and Petrochemical
- 5.4.3 Commercial/Residential Distributors
- 5.4.4 Mid-stream Operators
- 5.4.5 Government and Emergency Agencies
- 5.5 By Geography
- 5.5.1 North America
- 5.5.1.1 United States
- 5.5.1.2 Canada
- 5.5.1.3 Mexico
- 5.5.2 Europe
- 5.5.2.1 Germany
- 5.5.2.2 United Kingdom
- 5.5.2.3 France
- 5.5.2.4 Italy
- 5.5.2.5 NORDIC Countries
- 5.5.2.6 Russia
- 5.5.2.7 Rest of Europe
- 5.5.3 Asia-Pacific
- 5.5.3.1 China
- 5.5.3.2 India
- 5.5.3.3 Japan
- 5.5.3.4 South Korea
- 5.5.3.5 ASEAN Countries
- 5.5.3.6 Rest of Asia-Pacific
- 5.5.4 South America
- 5.5.4.1 Brazil
- 5.5.4.2 Argentina
- 5.5.4.3 Rest of South America
- 5.5.5 Middle East and Africa
- 5.5.5.1 Saudi Arabia
- 5.5.5.2 United Arab Emirates
- 5.5.5.3 South Africa
- 5.5.5.4 Egypt
- 5.5.5.5 Rest of Middle East and Africa
- 5.5.1 North America
6 Competitive Landscape
- 6.1 Market Concentration
- 6.2 Strategic Moves (M&A, Partnerships, PPAs)
- 6.3 Market Share Analysis (Market Rank/Share for key companies)
- 6.4 Company Profiles (includes Global level Overview, Market level overview, Core Segments, Financials as available, Strategic Information, Products & Services, and Recent Developments)
- 6.4.1 Gazprom
- 6.4.2 PetroChina (CNPC)
- 6.4.3 Royal Dutch Shell plc
- 6.4.4 TotalEnergies SE
- 6.4.5 Chevron Corp.
- 6.4.6 Uniper SE
- 6.4.7 Enbridge Inc.
- 6.4.8 TC Energy Corp.
- 6.4.9 NAFTA a.s.
- 6.4.10 Eni SpA
- 6.4.11 Storengy (ENGIE)
- 6.4.12 Centrica Storage
- 6.4.13 Kinder Morgan
- 6.4.14 RWE Gas Storage
- 6.4.15 INEOS Energy Storage
- 6.4.16 Linde Engineering (Hydrogen Caverns)
- 6.4.17 Enagas S.A.
- 6.4.18 Osaka Gas Co.
- 6.4.19 Gasunie (Gasunie UGS)
- 6.4.20 Energinet DK
7 Market Opportunities & Future Outlook
- 7.1 Hydrogen-ready cavern conversions
- 7.2 Digitalised smart-storage optimisation
- 7.3 Rising strategic stockpiles in emerging Asia
- 7.4 Modular micro-cavern solutions for LNG-to-gas projects
 2026-2030年全球地下天然氣儲存市場
 商業天然氣儲存市場-全球產業規模、佔有率、趨勢、機會與預測:按類型、地區和競爭格局分類,2021-2031年
 液化石油氣(LPG)儲存市場:商業機會、成長要素、產業趨勢分析及2026-2035年預測
 地下天然氣儲存市場:儲存類型、服務、合約期限、應用、最終用途-2026-2032年全球市場預測液化石油氣儲存市場-全球產業規模、佔有率、趨勢、機會和預測:按應用、儲存類型、終端用戶產業、地區和競爭格局分類,2021-2031年石油和天然氣儲存服務市場-全球產業規模、佔有率、趨勢、機會及預測(按服務、產品類型、最終用戶、地區和競爭格局分類,2021-2031年)
 全球地下儲氣庫市場全球液化石油氣儲存市場
 亞太多元素氣瓶市場(按應用、類型和國家分類)分析與預測(2024 年至 2034 年)
 歐洲多元氣體容器市場:重點關注應用、產品類型與國家級分析-2024 年至 2034 年的分析與預測