


 |
市場調查報告書
商品編碼
2063241
太陽能發電測試設備:市場佔有率分析、產業趨勢與統計、成長預測(2026-2031)Solar PV Testing Equipment - Market Share Analysis, Industry Trends & Statistics, Growth Forecasts (2026 - 2031) |
||||||
※ 本網頁內容可能與最新版本有所差異。詳細情況請與我們聯繫。
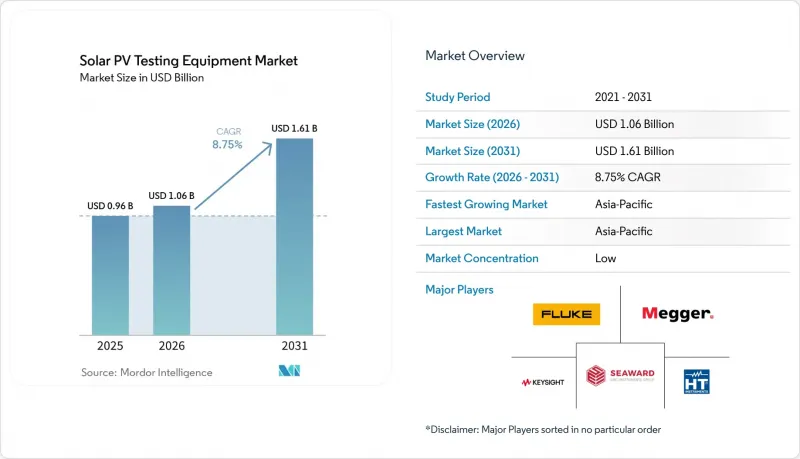
根據 Mordor Intelligence 預測,太陽能測試設備的市場規模預計將從 2025 年的 9.6 億美元成長到 2026 年的 10.6 億美元,然後從 2026 年到 2031 年以 8.75% 的複合年成長率成長,到 2031 年達到 16.1 億美元。
本報告按設備類型(功率分析儀、IV曲線追蹤儀等)、技術(自動化等)、測試階段(安裝前測試、現場測試、維護測試)、應用領域(製造商等)、最終用戶(能源、製造等)和地區(北美、歐洲、亞太、南美、中東和非洲)進行細分。市場預測以美元計價。
全球太陽能測試設備市場趨勢與洞察
全球太陽能發電能力擴張
預計到2024年,全球新增太陽能發電裝置容量將達到601吉瓦,累積裝置容量超過2.26太瓦,導致大規模太陽能陣列積壓等待併網測試。亞太地區約佔該發電容量的71%,光是中國就已運作357吉瓦,進一步延長了工廠和現場測試的排隊時間。由於運作是在機械竣工後進行的,太陽能測試設備市場的收入通常比裝置容量的成長滯後6至12個月,從而緩解了銷售波動。雙面組件的激增(目前已佔出貨量的四分之三以上)需要使用背面太陽輻射感測器,而單面測試儀無法處理,這迫使EPC公司升級其設備。因此,據分銷商稱,目前1500V IV曲線追蹤儀的訂單積壓長達8週,是2023年前置作業時間的兩倍,凸顯了市場的緊張需求。
快速降低太陽能發電硬體和維運成本;數位化
2024年第四季度,歐洲組件價格平均為每瓦0.20歐元,這壓縮了硬體資本支出,並將試運行成本推高至總安裝成本的3-5%。因此,開發商將測試視為保障收益的手段,因為漏檢熱點可能導致年度發電效率降低200-300個基點,進而可能導致內部收益率低於債務合約條款。對於超過500兆瓦的投資組合而言,能夠自動將資料輸入資產管理入口網站的雲端分析儀仍然具有吸引力,儘管其價格溢價高達20-30%,因為手動資料輸入已不再經濟高效。因此,硬體成本的下降反而增加了高精度測試儀的每瓦支出,這為高階供應商帶來了利多。同時,這種數位轉型也催生了訂閱收入模式,使供應商免受硬體需求週期性波動的影響。
對先進測試設備的大量資金投入
一套能夠對整個1500V組串進行IEC 62446-1全面檢測的全自動鑽機造價在5萬至8萬美元之間,這筆費用超過了埃及、印尼和阿根廷小規模安裝商的年收入。歐美EPC公司可以將此類設備的成本分攤到超過200兆瓦的專案中,而發展中地區的承包商卻只能依靠手持式電錶和熱像儀,而保險公司可能不認可這些設備。在銀行不熟悉設備殘值的地區,租賃方案仍然有限,這進一步擴大了成本效益差距。服務公司開始提供租賃設備,按需試運行的費用為每兆瓦500至1500美元,從而在無需終端用戶資本投資的情況下擴大了市場覆蓋範圍。
細分市場分析
2025年,功率分析儀在太陽能測試設備市場銷售中佔35.3%。這反映了其在檢驗逆變器效率、諧波失真和電網相容性方面的多功能性。同時,預計到2031年,IV曲線追蹤儀將以9.4%的複合年成長率實現最高成長,因為開發商正在增強組串級診斷能力,並主動預防可能導致保險公司性能閾值的污染引起的熱點。無人機搭載的熱成像器保留了一定的市場空間。將IV曲線追蹤、絕緣電阻測量和紅外線成像功能整合於機殼的整合式測試儀可將試運行工作量減少30%,使其成為極具吸引力的升級選擇。
額定電壓為1500V的第二代示踪儀目前已成為印度和中東地區競標文件中的主流產品,而2000V原型機已於2025年進入現場測試階段。因此,預計太陽能測試設備市場將在2028年迎來中期更換需求的激增,屆時最初的1500V設備將需要重新校準。對於2015年之前運作營運的項目,熱成像器在維護計畫中仍然發揮核心作用,因為這些項目正面臨著封裝層加速劣化的問題,而這種退化無法透過電氣測試檢測到。另一方面,太陽能模擬器目前仍主要局限於工廠品管和研究實驗室的使用。
截至2025年,手動設備仍將佔據太陽能測試設備市場46.1%的佔有率,這主要是由於在嚴格的現代標準訂定之前購買的萬用電錶所致。然而,隨著勞動力短缺迫使承包商投資購買資本設備,自動化平台預計將以10.2%的複合年成長率成長。雲端分析儀器簡化了資產管理公司(管理超過500兆瓦的資產組合)的報告流程。在這種規模下,資料輸入的減少足以抵銷硬體成本。配備鋰離子電池組的可攜式設計可實現8小時的連續運作,從而無需在偏遠沙漠地區使用發電機,並降低了物流成本。
然而,完全自動化仍面臨監管方面的障礙。保險承銷商仍然要求專家審核原始的IV曲線,這限制了人工的替代。目前,需要技術人員簽署確認的混合系統,例如可自動排序電網故障測試的可程式設計直流電源,是典型的部署模式。為現有測試儀加裝藍牙模組以增加自動記錄功能的成本不到1200美元,這使其對小規模安裝商具有吸引力,同時也延長了產品的使用壽命。因此,光伏測試設備產業正在努力平衡創新與向後相容性,以確保與現有設備的兼容性。
區域分析
預計到2025年,歐洲將佔據太陽能測試設備市場32.5%的佔有率。這主要歸功於其嚴格的合規體系,以及德國雙面組件安裝率的顯著成長——從2024年的17%飆升至2024年的74%。歐盟透過CINEA支持的ECODESIGN PV TESTING計畫提供的新資金表明,背面太陽輻射檢驗標準的收緊勢在必行,這可能在2020年代中期引發新一輪的採購需求激增。然而,在一些成員國,核准流程可能需要四年以上的時間,導致在獲得併網證書之前測試設備的採購被延誤,從而造成需求出現間歇性高峰。
亞太地區是成長最快的地區,預計到2031年將以10.4%的複合年成長率成長。到2025年9月,中國的分散式太陽能發電裝置容量將超過508吉瓦,並且正在實施「四項能力」規則,強制要求使用分析儀檢驗自癒和互動功能。在印度,除了2024年新增的31.9吉瓦裝置容量外,還推出了與組件製造生產連結獎勵計畫,這導致對工廠內測試儀的需求相應增加。東南亞地區工程師短缺,減緩了全自動系統的應用,承包商傾向於使用由當地校準實驗室支援的可靠的手動工具。
在北美,2024年新增裝置容量為47吉瓦,但超過2太瓦的併網等待名單推遲了專案里程碑的啟動,也延緩了測試設備的採購。儘管如此,《通貨膨脹控制法案》下的長期稅額扣抵正在支撐著強勁的項目儲備,隨著電網升級釋放更多容量,這些抵免很可能轉化為設備訂單。在中東,沙烏地阿拉伯和阿拉伯聯合大公國的吉瓦級競標正在加速進行,1500伏特組串的採用也增加了對高壓認證設備的需求。非洲和南美洲面臨資金籌措挑戰,但可攜式測試設備的租賃模式正在降低小規模安裝商的進入門檻。
其他好處:
- Excel格式的市場預測(ME)表
- 3個月的分析師支持
目錄
第1章:引言
- 研究假設和市場定義
- 調查範圍
第2章:調查方法
第3章執行摘要
第4章 市場狀況
- 市場概覽
- 市場促進因素
- 全球太陽能發電能力擴張
- 快速降低成本並實現太陽能發電設備和運維的數位化
- 不斷發展的安全合規標準(IEC 62446-1、NEC 2023)
- 過渡到 1500V 組串配置需要使用高壓測試儀。
- 資產擁有者採用以ESG主導的零缺陷採購政策。
- 保險承保人須提交基準績效資料。
- 市場限制因素
- 對先進測試設備進行大量資本投資
- 新興市場缺乏經認證的太陽能電力測試技術人員
- 智慧型逆變器內建的自我診斷功能降低了對外部測試儀的需求。
- 雲端連線測試設備的網路安全問題
- 供應鏈分析
- 監理情勢
- 技術展望
- 波特五力分析
第5章 市場規模與成長預測
- 依設備類型
- 功率分析儀
- IV曲線追蹤器
- 熱成像器
- 太陽模擬器
- 萬用電表
- 分路電阻器
- 透過技術
- 自動測試設備
- 手動測試設備
- 可攜式測試設備
- 整合測試系統
- 通過測試階段
- 安裝前測試
- 現場檢查
- 維護測試
- 透過使用
- 太陽能板製造商
- 太陽能發電系統安裝公司
- 太陽能發電場和公用事業規模設施
- 研究與開發
- 維護和維修服務
- 按最終用戶行業分類
- 能源與電力
- 製造業
- 建築和基礎設施
- 政府/公共部門
- 研究機構
- 按地區
- 北美洲
- 美國
- 加拿大
- 墨西哥
- 歐洲
- 德國
- 英國
- 法國
- 義大利
- 北歐國家
- 俄羅斯
- 其他歐洲國家
- 亞太地區
- 中國
- 印度
- 日本
- 韓國
- 東南亞國協
- 其他亞太國家
- 南美洲
- 巴西
- 阿根廷
- 其他南美國家
- 中東和非洲
- 沙烏地阿拉伯
- 阿拉伯聯合大公國
- 南非
- 埃及
- 其他中東和非洲國家
- 北美洲
第6章 競爭情勢
- 市場集中度
- 策略趨勢(併購、聯盟、購電協議)
- 市場佔有率分析(主要公司的市場排名和佔有率)
- 公司簡介
- Fluke Corporation(incl. Solmetric)
- Seaward Electronic Ltd.
- HT Instruments(HT-Italia)
- Chauvin Arnoux Group
- Megger Group
- Kyoritsu Electrical Instruments Works Ltd.
- Gossen Metrawatt GmbH
- MECO Instruments
- Metrel dd
- Keysight Technologies
- Yokogawa Electric Corporation
- Chroma ATE Inc.
- Newport Corporation(MKS Instruments)
- PV Measurements Inc.
- EKO Instruments
- OTT HydroMet(Kipp & Zonen)
- Sevensense
- Apogee Instruments
- Delta OHM
- AMETEK/Abet Technologies
- AEMC Instruments
- PV-One(IVy)
- CMW Solar
- Eltest Engineering
第7章 市場機會與未來展望
According to Mordor Intelligence, the solar pV testing equipment market size is expected to grow from USD 0.96 billion in 2025 to USD 1.06 billion in 2026 and is forecast to reach USD 1.61 billion by 2031 at 8.75% CAGR over 2026-2031.
This report is Segmented by Equipment Type (Power Analyzers, IV Curve Tracers, and More), Technology (Automated, and More), Testing Phase (Pre-Installation, On-Site, Maintenance), Application (Manufacturers, and More), End-User (Energy, Manufacturing, and More), and Geography (North America, Europe, Asia-Pacific, South America, Middle East and Africa). Market Forecasts are Provided in Value (USD).
Global Solar PV Testing Equipment Market Trends and Insights
Escalating Global PV Installation Volumes
World solar additions hit 601 GW in 2024, lifting cumulative installations above 2.26 TW and generating a sizable backlog of arrays awaiting grid-connection testing. Asia-Pacific contributed roughly 71% of those megawatts, with China alone commissioning 357 GW, which in turn elongates factory and field-testing queues. Because commissioning happens after mechanical completion, Solar PV Testing Equipment Market revenues typically trail capacity additions by six to twelve months, smoothing topline volatility. The steep rise of bifacial modules, now more than three-quarters of shipments, necessitates rear-irradiance sensors unavailable in single-plane testers, pushing EPCs toward fleet upgrades. As a result, distributors report that back-orders for 1,500 V IV curve tracers now stretch eight weeks, double the 2023 lead time, underscoring demand tightness.
Rapid Cost Decline of PV Hardware & O&M Digitalization
Module prices across Europe averaged EUR 0.20 per watt in Q4 2024, compressing hardware capex and elevating commissioning to 3-5% of total installed cost. Developers, therefore, treat testing as yield insurance: missed hotspots can lower annual performance ratios by 200-300 basis points, pushing IRRs below debt covenants. Cloud-ready analyzers that autopopulate asset-management portals attract 20-30% price premiums yet remain attractive above 500 MW portfolio scale, where manual data entry becomes cost-prohibitive. Lower hardware costs thus paradoxically raise per-watt spending on high-precision testers, a tailwind for premium suppliers. This digital shift simultaneously unlocks subscription revenue models, cushioning vendors against cyclical hardware demand.
High CAPEX for Advanced Testing Equipment
Fully automated rigs able to execute all IEC 62446-1 checks across 1,500 V strings cost USD 50,000-80,000, a figure that eclipses the annual revenue of small installers in Egypt, Indonesia, and Argentina. European and U.S. EPCs amortize such gear over portfolios surpassing 200 MW, but contractors in developing regions rely on handheld meters and thermal cameras that insurers may reject. Leasing solutions remain scarce where banks lack familiarity with residual equipment values, deepening the affordability gap. Service companies are stepping in with rental fleets, charging USD 500-1,500 per MW for on-demand commissioning, thus broadening market reach without requiring end-user capex.
Other drivers and restraints analyzed in the detailed report include:
- Evolving Safety-Compliance Standards
- Shift to 1,500 V String Architectures
- Shortage of Certified PV Test Technicians in Emerging Markets
For complete list of drivers and restraints, kindly check the Table Of Contents.
Segment Analysis
Power analyzers contributed 35.3% of the Solar PV Testing Equipment market revenue in 2025, reflecting their multipurpose roles in inverter efficiency, harmonic distortion, and grid-compliance verification. IV curve tracers, however, are forecast to post the fastest 9.4% CAGR through 2031 as developers elevate string-level diagnostics to preempt soiling-induced hotspots that can breach insurers' 80% performance-ratio thresholds. Drone-borne thermal imagers scan up to 100 MW per day, outperforming ground crews by a factor of ten, yet aviation restrictions near airports preserve a niche for handheld cameras. Integrated testers that merge IV tracing, insulation resistance, and infrared imaging in one chassis reduce commissioning labor by 30%, positioning that category as an attractive upgrade pathway.
Second-generation tracers rated for 1,500 V now dominate bid documents across India and the Middle East, while 2,000 V-capable prototypes entered field trials in 2025. As a result, the Solar PV Testing Equipment Market expects a mid-cycle replacement bump in 2028 when early 1,500 V fleets require recalibration. Thermal imagers still underpin maintenance programs for projects commissioned before 2015, whose encapsulant layers are entering accelerated degradation phases invisible to electrical tests. Meanwhile, solar simulators remain confined to factory quality-control and research labs.
Manual devices retained 46.1% share of the Solar PV Testing Equipment Market in 2025, a legacy of multimeters purchased before stringent modern standards. Automated platforms, though, will expand at 10.2% CAGR as labor scarcities push contractors toward capital solutions. Cloud-enabled analyzers streamline report generation for asset managers overseeing portfolios beyond 500 MW, where data-entry savings outweigh hardware premiums. Portable designs powered by lithium-ion packs achieve eight-hour runtimes, eliminating generator needs at remote desert sites and cutting logistics costs.
Yet full autonomy faces regulatory friction: underwriters still mandate expert review of raw IV curves, capping labor displacement. Hybrid systems, such as programmable DC supplies that auto-sequence grid-fault tests but require technician countersignature, typify interim adoption patterns. Retrofit Bluetooth modules that add automated logging to legacy testers cost under USD 1,200, appealing to small-scale installers and extending product life cycles. Consequently, the Solar PV Testing Equipment industry balances innovation with backward compatibility to sustain installed-base relevance.
Geography Analysis
Europe captured 32.5% of the Solar PV Testing Equipment market revenue in 2025, underpinned by rigid compliance frameworks and a leap in bifacial-module penetration from 17% to 74% of German installs during 2024. New European Union funding, via the CINEA-backed ECODESIGN PV TESTING project, signals imminent tightening of standards for rear-side irradiance verification, likely triggering another mid-decade purchasing surge. However, permitting timelines stretching beyond four years in some member states delays tester procurements until grid-connection certificates are certain, injecting episodic demand lumps.
Asia-Pacific is the fastest-growing region, set to rise at 10.4% CAGR through 2031. China's distributed PV stock exceeded 508 GW by September 2025 and is governed by the "four-abilities" rule requiring analyzers to validate self-healing and interaction functions. India's 31.9 GW of 2024 additions, alongside its production-linked incentive for module manufacturing, feed parallel demand for factory-floor testers. Technician shortages across Southeast Asia temper uptake of fully automated systems, leading contractors to favor rugged manual tools backed by regional calibration labs.
North America installed 47 GW in 2024, yet interconnection queues surpassing 2 TW postpone notice-to-proceed milestones, deferring tester purchases. Nevertheless, the Inflation Reduction Act's long-dated tax credits underpin a robust pipeline that will convert to equipment orders as grid upgrades unlock capacity. The Middle East accelerates with gigawatt-scale tenders in Saudi Arabia and the UAE, adopting 1,500-V strings, demanding high-voltage certification equipment. Africa and South America grapple with financing headwinds, but rental models for portable testers lower adoption barriers for small-scale installers.
- Fluke Corporation (incl. Solmetric)
- Seaward Electronic Ltd.
- HT Instruments (HT-Italia)
- Chauvin Arnoux Group
- Megger Group
- Kyoritsu Electrical Instruments Works Ltd.
- Gossen Metrawatt GmbH
- MECO Instruments
- Metrel d.d.
- Keysight Technologies
- Yokogawa Electric Corporation
- Chroma ATE Inc.
- Newport Corporation (MKS Instruments)
- PV Measurements Inc.
- EKO Instruments
- OTT HydroMet(Kipp & Zonen)
- Sevensense
- Apogee Instruments
- Delta OHM
- AMETEK / Abet Technologies
- AEMC Instruments
- PV-One (IVy)
- CMW Solar
- Eltest Engineering
Additional Benefits:
- The market estimate (ME) sheet in Excel format
- 3 months of analyst support
TABLE OF CONTENTS
1 Introduction
- 1.1 Study Assumptions & Market Definition
- 1.2 Scope of the Study
2 Research Methodology
3 Executive Summary
4 Market Landscape
- 4.1 Market Overview
- 4.2 Market Drivers
- 4.2.1 Escalating global PV installation volumes
- 4.2.2 Rapid cost decline of PV hardware & O&M digitalization
- 4.2.3 Evolving safety-compliance standards (IEC 62446-1, NEC 2023)
- 4.2.4 Shift to 1,500 V string architectures needing high-voltage testers
- 4.2.5 ESG-driven zero-defect procurement policies by asset owners
- 4.2.6 Insurance underwriters mandating baseline performance data
- 4.3 Market Restraints
- 4.3.1 High CAPEX for advanced testing equipment
- 4.3.2 Shortage of certified PV test technicians in emerging markets
- 4.3.3 Smart inverters' built-in self-diagnostics curbing external tester demand
- 4.3.4 Cyber-security concerns over cloud-connected test gear
- 4.4 Supply-Chain Analysis
- 4.5 Regulatory Landscape
- 4.6 Technological Outlook
- 4.7 Porter's Five Forces Analysis
- 4.7.1 Threat of New Entrants
- 4.7.2 Bargaining Power of Buyers
- 4.7.3 Bargaining Power of Suppliers
- 4.7.4 Threat of Substitutes
- 4.7.5 Competitive Rivalry
5 Market Size & Growth Forecasts
- 5.1 By Equipment Type
- 5.1.1 Power Analyzers
- 5.1.2 IV Curve Tracers
- 5.1.3 Thermal Imagers
- 5.1.4 Solar Simulators
- 5.1.5 Multimeters
- 5.1.6 Shunt Resistors
- 5.2 By Technology
- 5.2.1 Automated Testing Equipment
- 5.2.2 Manual Testing Equipment
- 5.2.3 Portable Testing Equipment
- 5.2.4 Integrated Testing Systems
- 5.3 By Testing Phase
- 5.3.1 Pre-Installation Testing
- 5.3.2 On-Site Testing
- 5.3.3 Maintenance Testing
- 5.4 By Application
- 5.4.1 Solar Panel Manufacturers
- 5.4.2 Solar System Installers
- 5.4.3 Solar Farms and Utility-Scale Installations
- 5.4.4 Research and Development
- 5.4.5 Maintenance and Repair Services
- 5.5 By End-User Industry
- 5.5.1 Energy and Power
- 5.5.2 Manufacturing
- 5.5.3 Construction and Infrastructure
- 5.5.4 Government and Public Sector
- 5.5.5 Research Institutions
- 5.6 By Geography
- 5.6.1 North America
- 5.6.1.1 United States
- 5.6.1.2 Canada
- 5.6.1.3 Mexico
- 5.6.2 Europe
- 5.6.2.1 Germany
- 5.6.2.2 United Kingdom
- 5.6.2.3 France
- 5.6.2.4 Italy
- 5.6.2.5 NORDIC Countries
- 5.6.2.6 Russia
- 5.6.2.7 Rest of Europe
- 5.6.3 Asia-Pacific
- 5.6.3.1 China
- 5.6.3.2 India
- 5.6.3.3 Japan
- 5.6.3.4 South Korea
- 5.6.3.5 ASEAN Countries
- 5.6.3.6 Rest of Asia-Pacific
- 5.6.4 South America
- 5.6.4.1 Brazil
- 5.6.4.2 Argentina
- 5.6.4.3 Rest of South America
- 5.6.5 Middle East and Africa
- 5.6.5.1 Saudi Arabia
- 5.6.5.2 United Arab Emirates
- 5.6.5.3 South Africa
- 5.6.5.4 Egypt
- 5.6.5.5 Rest of Middle East and Africa
- 5.6.1 North America
6 Competitive Landscape
- 6.1 Market Concentration
- 6.2 Strategic Moves (M&A, Partnerships, PPAs)
- 6.3 Market Share Analysis (Market Rank/Share for key companies)
- 6.4 Company Profiles (includes Global level Overview, Market level overview, Core Segments, Financials as available, Strategic Information, Products & Services, and Recent Developments)
- 6.4.1 Fluke Corporation (incl. Solmetric)
- 6.4.2 Seaward Electronic Ltd.
- 6.4.3 HT Instruments (HT-Italia)
- 6.4.4 Chauvin Arnoux Group
- 6.4.5 Megger Group
- 6.4.6 Kyoritsu Electrical Instruments Works Ltd.
- 6.4.7 Gossen Metrawatt GmbH
- 6.4.8 MECO Instruments
- 6.4.9 Metrel d.d.
- 6.4.10 Keysight Technologies
- 6.4.11 Yokogawa Electric Corporation
- 6.4.12 Chroma ATE Inc.
- 6.4.13 Newport Corporation (MKS Instruments)
- 6.4.14 PV Measurements Inc.
- 6.4.15 EKO Instruments
- 6.4.16 OTT HydroMet(Kipp & Zonen)
- 6.4.17 Sevensense
- 6.4.18 Apogee Instruments
- 6.4.19 Delta OHM
- 6.4.20 AMETEK / Abet Technologies
- 6.4.21 AEMC Instruments
- 6.4.22 PV-One (IVy)
- 6.4.23 CMW Solar
- 6.4.24 Eltest Engineering
7 Market Opportunities & Future Outlook
- 7.1 White-space & Unmet-need Assessment
 電池測試設備市場規模及預測(2021-2034年),全球及區域佔有率、趨勢和成長機會分析報告:按類型、測試功能、配置、最終用戶和地區分類
 電池測試設備市場:按設備類型、電池類型、測試模式、技術、應用、最終用戶和銷售管道分類-2026-2032年全球預測汽車電池測試器市場:按測試方法、產品類型、技術、應用和最終用戶分類-2026-2032年全球預測高功率電池測試設備市場:依產品類型、技術、應用、最終用戶和分銷管道分類,全球預測,2026-2032年
 電池測試設備市場分析及預測(至2035年):類型、產品類型、服務、技術、組件、應用、形式、最終用戶、功能
 全球電池測試設備市場:市場規模、佔有率、成長、依類型和應用劃分的產業分析、區域洞察及預測(2026-2034)鋰測試服務市場(按服務類型、測試方法、應用、最終用戶產業和分銷管道分類),全球預測(2026-2032年)鋰離子電池檢測市場:按技術、檢測方法、設備類型、缺陷類型、檢測階段、外形規格和最終用戶分類,全球預測,2026-2032年
 電池測試設備市場規模、佔有率和成長分析(按產品類型、測試類型、應用、電池類型和地區分類)-2026-2033年產業預測
 全球電池測試設備市場