

 |
市場調查報告書
商品編碼
2062479
排碳權交易平台:市場佔有率分析、產業趨勢與統計、成長預測(2026-2031)Carbon Credit Trading Platform - Market Share Analysis, Industry Trends & Statistics, Growth Forecasts (2026 - 2031) |
||||||
※ 本網頁內容可能與最新版本有所差異。詳細情況請與我們聯繫。
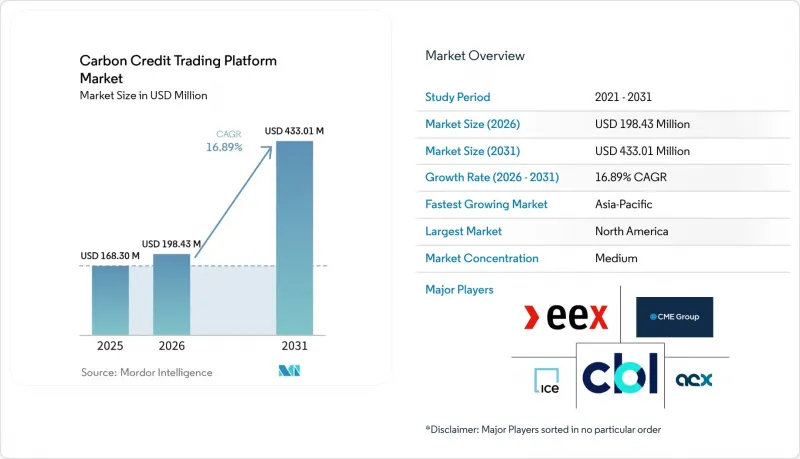
根據 Mordor Intelligence 預測,排碳權交易平台市場規模將從 2025 年的 1.683 億美元成長到 2026 年的 1.9843 億美元,然後在 2031 年達到 4.3301 億美元,2026 年至 2031 年的複合年成長率為 16.89%。
本報告按類型(自願性、監管合規性)、應用(可再生能源、植樹造林、捕碳封存、其他應用)、最終用戶(企業、政府、個人)和地區(北美、歐洲、亞太、南美、中東和非洲)進行細分。市場預測以美元計價。
全球排碳權交易平台市場趨勢及洞察
企業對淨零排放的承諾日益增強
微軟已與21家供應商簽訂契約,計劃在2025年採購總合4500萬噸二氧化碳當量碳,使其2024年的採購量加倍。其中包括與Indigo Ag公司簽訂的為期12年、每噸60至80美元的土壤碳排放交易,銷售團隊285萬噸土壤碳。 Salesforce和其他財富500強企業採用的類似多年期合約結構,能夠創建可預測的訂單流,平台可以將其納入標準化的期貨交易中。這使得區分高度可靠的碳移除信用額度和碳規避信用額度成為可能。科學碳舉措(SBTi)指南目前僅將碳移除作為碳中和目標,要求平台整合詳細的信用標記和自動攤銷功能。長期合約也有助於提高專案的資金籌措潛力,使資金集中用於直接空氣捕獲(DAC)等技術解決方案。這種穩定的採購管道提高了碳權交易平台市場的透明度。
擴大基於合規性的碳定價機制
到2027年,中國將把鋼鐵、水泥和鋁納入排放交易體系(ETS),屆時將有1500營業單位和30億噸二氧化碳當量(tCO2e)受到絕對限值約束。日本的GX-ETS將於2026年開始運作,韓國已啟動其K-ETS的第四階段,印度的試點計畫也在進行中,這些舉措共同建構了一個泛亞洲價格區間,各平台必須將其納入其中。東協成員國已簽署“通用碳框架”,以協調計算標準,而印尼正在考慮與中國的碳排放交易體系進行雙邊合作。這些措施將提高合規性和流動性,減少區域套利機會,並促進交叉上市產品的發展。諸如自願碳市場完整性委員會(ICVCM)等標準制定機構正逐漸成為上市的強制性要求,從而提高了對品質和整合性的要求。
碳權價格劇烈波動
根據REDD+一致性研究,現貨碳排放抵銷價格在2024年跌破每噸5美元,但隨著差異化定價機制的建立,價格在2025年反彈。合格CORSIA標準的碳供應仍緊張,價格高於每噸15美元。同時,歐盟排放交易體系(EU ETS)的排放權在2025年的價格在70歐元至115歐元之間波動。標準化合約仍處於起步階段,市場創造者的獎勵不高,因此平台難以培養期貨市場。由此,擁有多年碳中和目標的買家面臨對沖缺口,減緩了短期應用,並抑制了碳權交易平台市場的成長。
細分市場分析
2025年,在歐盟排放交易體系(EU ETS)、中國國家排放交易體系(NCETS)和北美碳總量管制與交易體系的支持下,合規市場將佔據碳權交易平台市場佔有率的77.8%。歐盟市場穩定儲備(MSR)將於2024年回收2.75億單位的排放權,而從2026年起將航運業納入其中,將新增9,000萬噸二氧化碳當量(tCO2e)的減排義務。加州、區域溫室氣體計劃(RGGI)和韓國已設定了總計超過20億噸的排放上限,為常規競標結算交易提供了支持。在企業買家對高可靠性碳清除解決方案日益成長的需求推動下,自願性碳市場平台預計將在2031年前顯著成長。第六條的雙邊合作以及《國際減排公約》(CORSIA)的選擇性應用正在模糊不同機制之間的界限,因此需要統一的結算基礎設施。代幣化的自願性碳權提供了新的流動性,但Oracle和監管障礙阻礙了它們參與資本市場。
區域分析
到2025年,北美將佔全球收入的36.2%,這主要得益於加州的總量管制與交易體係以及華盛頓州和魁北克省聯合提出的旨在縮小排放權價格差距的提案。加拿大的聯邦碳排放價格上限將於2030年達到170加幣(125美元),以促進透過林業進行碳抵銷;同時,墨西哥正在審查其3美元的碳稅,以使其與《美墨加協定》(USMCA)保持一致。
亞太地區是成長最快的地區,預計到2031年複合年成長率將達到22.3%。中國的排放交易體系(ETS)預計2027年涵蓋重工業,2030年交易量可望達到110億噸二氧化碳當量。在東南亞,截至2025年4月,284個項目將產生1.715億噸二氧化碳當量,其中73%將來自基於自然的解決方案(NBS)。儘管日本、韓國和印度正在加速發展,但歐盟的碳邊境調節措施(CBAM)正迫使出口國採用國內定價機制,並將碳權額度導向區域平台。
歐洲依然是監管領域的領導者。歐盟碳排放交易體系(EU ETS)的競標預計將在2024年產生388億歐元(451.5億美元)的收入,而航運業的排放將從2026年起成為新的需求來源。英國正在就重新參與歐盟碳排放交易體系進行談判,巴西的自願性REDD+計畫正在支持全球碳供應,海灣國家也在探索針對特定產業的方案,所有這些都顯示排碳權交易平台市場的地域分佈日益多元化。
其他好處:
- Excel格式的市場預測(ME)表
- 3個月的分析師支持
目錄
第1章:引言
- 研究假設和市場定義
- 調查範圍
第2章:調查方法
第3章執行摘要
第4章 市場狀況
- 市場概覽
- 市場促進因素
- 擴大企業淨零排放承諾
- 擴大基於合規性的碳定價機制
- 投資人對ESG產品的需求日益成長
- 數位MRV和區塊鏈的技術進步
- 將排碳權整合到消費者忠誠度平台中
- 透過自然資源代幣化實現微交易
- 市場限制因素
- 碳權價格波動性大
- 缺乏全球標準化和監管碎片化
- 評級機構加強對「額外性」和「持續性」的監測。
- 大規模交易中鏈上流動性的限制
- 供應鏈分析
- 監理情勢
- 技術展望
- 波特五力模型
第5章 市場規模與成長預測
- 按類型
- 獨立民主市場平台
- 合規碳市場平台
- 透過使用
- 可再生能源
- 重新造林/植樹造林
- 二氧化碳捕集與儲存
- 其他用途
- 最終用戶
- 公司
- 政府
- 個人
- 按地區
- 北美洲
- 美國
- 加拿大
- 墨西哥
- 歐洲
- 德國
- 英國
- 法國
- 義大利
- 北歐國家
- 俄羅斯
- 其他歐洲國家
- 亞太地區
- 中國
- 印度
- 日本
- 韓國
- 東南亞國協
- 其他亞太國家
- 南美洲
- 巴西
- 阿根廷
- 其他南美國家
- 中東和非洲
- 沙烏地阿拉伯
- 阿拉伯聯合大公國
- 南非
- 埃及
- 其他中東和非洲國家
- 北美洲
第6章 競爭情勢
- 市場集中度
- 策略趨勢(併購、聯盟、購電協議)
- 市場佔有率分析(主要公司的市場排名和佔有率)
- 公司簡介
- Xpansiv
- AirCarbon Exchange(ACX)
- Climate Impact X
- CME Group Inc.
- Intercontinental Exchange(ICE)
- European Energy Exchange(EEX)
- Carbon Trade Exchange(CTX)
- Nasdaq
- Toucan
- Verra Registry
- Gold Standard
- ClearBlue Markets
- South Pole
- Flowcarbon
- Patch
- Regreener
- Carbonplace
- Thallo
- Cloverly
- IncubEx
第7章 市場機會與未來展望
According to Mordor Intelligence, the carbon credit trading platform market size is expected to grow from USD 168.30 million in 2025 to USD 198.43 million in 2026 and is forecast to reach USD 433.01 million by 2031 at 16.89% CAGR over 2026-2031.
This report is Segmented by Type (Voluntary, Compliance), Application (Renewable Energy, Reforestation/Afforestation, Carbon Capture and Storage, Other Applications), End-User (Corporates, Governments, Individuals), and Geography (North America, Europe, Asia-Pacific, South America, Middle East and Africa). Market Forecasts are Provided in Terms of Value (USD).
Global Carbon Credit Trading Platform Market Trends and Insights
Escalating Corporate Net-Zero Commitments
Microsoft doubled its 2024 offtake by contracting 45 million tCO2e in 2025 across 21 suppliers, including a 2.85 million-ton soil-carbon deal with Indigo Ag priced at USD 60-80 per ton over 12 years . Similar multi-year structures adopted by Salesforce and other Fortune 500 firms create a predictable order flow that platforms can bundle into standardized futures, differentiating high-integrity removals from avoidance credits. Science-Based Targets Initiative guidance now accepts only removals for neutralization, forcing platforms to embed granular credit tagging and automated retirement. Long-dated contracts also improve project bankability, crowding capital into engineered solutions such as direct air capture. This steady procurement pipeline lifts visibility for the carbon credit trading platform market.
Expanding Compliance Carbon Pricing Schemes
China will add steel, cement, and aluminum to its ETS by 2027, bringing 1,500 entities and 3 billion tCO2e under absolute caps. Japan's GX-ETS went live in 2026, South Korea began K-ETS Phase 4, and India's pilot scheme is underway, forming a pan-Asian pricing corridor that platforms must stitch together. ASEAN members signed a Common Carbon Framework to harmonize accounting, while Indonesia considers a bilateral linkage with China's ETS. These developments lift compliance liquidity, narrow regional arbitrage, and stimulate cross-listed products. Standard-setting bodies such as the Integrity Council for the Voluntary Carbon Market are quickly becoming prerequisites for listing, raising quality and integration requirements.
High Price Volatility of Carbon Credits
Spot avoidance offsets crashed below USD 5 per ton in 2024 after REDD+ integrity probes, then rebounded in 2025 as differentiated pricing emerged . CORSIA-eligible supply remains tight, keeping prices above USD 15, while EU ETS allowances swung between EUR 70 and EUR 115 in 2025. Platforms struggle to seed deep futures markets because standardized contracts are still nascent and market-maker incentives are low. Buyers with multi-year neutrality goals therefore face hedging gaps, dampening near-term adoption and tempering growth in the carbon credit trading platform market.
Other drivers and restraints analyzed in the detailed report include:
- Increased Investor Demand for ESG Products
- Technological Advancements in Digital MRV & Blockchain
- Rising Scrutiny of Additionality & Permanence
For complete list of drivers and restraints, kindly check the Table Of Contents.
Segment Analysis
Compliance venues generated 77.8% of the carbon credit trading platform market share in 2025, buoyed by the EU ETS, China's national ETS, and North American cap-and-trade programs. The EU's Market Stability Reserve withdrew 275 million allowances in 2024, while maritime inclusion from 2026 adds another 90 million tCO2e obligation. California, RGGI, and South Korea collectively cap over 2 billion tons, underpinning recurring auction settlement traffic. Voluntary carbon market platforms are projected to experience significant growth through 2031, driven by corporate buyers' increasing focus on high-integrity carbon removal solutions. Article 6 bilateral linkages and selective CORSIA eligibility blur lines between regimes, demanding unified settlement rails. Tokenized voluntary credits provide new liquidity, though oracle and regulatory hurdles dampen capital markets participation.
Geography Analysis
North America controlled 36.2% of 2025 revenue, led by California's Cap-and-Trade and a Washington-Quebec draft linkage designed to narrow allowance price gaps. Canada's federal backstop hits CAD 170 (USD 125) in 2030, catalyzing forestry offsets, while Mexico reviews its USD 3 tax to align with USMCA.
Asia-Pacific is the fastest-growing region, forecast at 22.3% CAGR to 2031. China's ETS will cover heavy industry by 2027 and could trade up to 11 billion tCO2e by 2030. Southeast Asia recorded 284 projects issuing 171.5 million tCO2e by April 2025, 73% from nature-based solutions. Japan, South Korea, and India add momentum, while EU CBAM pressures exporters to adopt internal pricing, funneling credits onto regional platforms.
Europe remains the regulatory bellwether. EU ETS auctions generated EUR 38.8 billion (USD 45.15 billion) in 2024, and maritime emissions add fresh demand from 2026. The U.K. negotiates potential relinking, Brazil's voluntary REDD+ projects feed global supply, and Gulf states explore sector-specific schemes, signaling expanding geographic diversity for the carbon credit trading platform market.
- Xpansiv
- AirCarbon Exchange (ACX)
- Climate Impact X
- CME Group Inc.
- Intercontinental Exchange (ICE)
- European Energy Exchange (EEX)
- Carbon Trade Exchange (CTX)
- Nasdaq
- Toucan
- Verra Registry
- Gold Standard
- ClearBlue Markets
- South Pole
- Flowcarbon
- Patch
- Regreener
- Carbonplace
- Thallo
- Cloverly
- IncubEx
Additional Benefits:
- The market estimate (ME) sheet in Excel format
- 3 months of analyst support
TABLE OF CONTENTS
1 Introduction
- 1.1 Study Assumptions & Market Definition
- 1.2 Scope of the Study
2 Research Methodology
3 Executive Summary
4 Market Landscape
- 4.1 Market Overview
- 4.2 Market Drivers
- 4.2.1 Escalating Corporate Net-Zero Commitments
- 4.2.2 Expanding Compliance Carbon Pricing Schemes
- 4.2.3 Increased Investor Demand for ESG Products
- 4.2.4 Technological Advancements in Digital MRV & Blockchain
- 4.2.5 Integration of Carbon Credits into Consumer Loyalty Platforms
- 4.2.6 Tokenization of Nature-Based Assets Enabling Micro-Transactions
- 4.3 Market Restraints
- 4.3.1 High Price Volatility of Carbon Credits
- 4.3.2 Lack of Global Standardization & Fragmented Regulations
- 4.3.3 Rising Scrutiny of Additionality & Permanence by Rating Agencies
- 4.3.4 Limited On-Chain Liquidity for Large Block Trades
- 4.4 Supply-Chain Analysis
- 4.5 Regulatory Landscape
- 4.6 Technological Outlook
- 4.7 Porter's Five Forces
- 4.7.1 Threat of New Entrants
- 4.7.2 Bargaining Power of Buyers
- 4.7.3 Bargaining Power of Suppliers
- 4.7.4 Threat of Substitutes
- 4.7.5 Competitive Rivalry
5 Market Size & Growth Forecasts
- 5.1 By Type
- 5.1.1 Voluntary Carbon Market Platforms
- 5.1.2 Compliance Carbon Market Platforms
- 5.2 By Application
- 5.2.1 Renewable Energy
- 5.2.2 Reforestation/Afforestation
- 5.2.3 Carbon Capture and Storage
- 5.2.4 Other Applications
- 5.3 By End-User
- 5.3.1 Corporates
- 5.3.2 Governments
- 5.3.3 Individuals
- 5.4 By Geography
- 5.4.1 North America
- 5.4.1.1 United States
- 5.4.1.2 Canada
- 5.4.1.3 Mexico
- 5.4.2 Europe
- 5.4.2.1 Germany
- 5.4.2.2 United Kingdom
- 5.4.2.3 France
- 5.4.2.4 Italy
- 5.4.2.5 NORDIC Countries
- 5.4.2.6 Russia
- 5.4.2.7 Rest of Europe
- 5.4.3 Asia-Pacific
- 5.4.3.1 China
- 5.4.3.2 India
- 5.4.3.3 Japan
- 5.4.3.4 South Korea
- 5.4.3.5 ASEAN Countries
- 5.4.3.6 Rest of Asia-Pacific
- 5.4.4 South America
- 5.4.4.1 Brazil
- 5.4.4.2 Argentina
- 5.4.4.3 Rest of South America
- 5.4.5 Middle East and Africa
- 5.4.5.1 Saudi Arabia
- 5.4.5.2 United Arab Emirates
- 5.4.5.3 South Africa
- 5.4.5.4 Egypt
- 5.4.5.5 Rest of Middle East and Africa
- 5.4.1 North America
6 Competitive Landscape
- 6.1 Market Concentration
- 6.2 Strategic Moves (M&A, Partnerships, PPAs)
- 6.3 Market Share Analysis (Market Rank/Share for key companies)
- 6.4 Company Profiles (includes Global level Overview, Market level overview, Core Segments, Financials as available, Strategic Information, Products & Services, and Recent Developments)
- 6.4.1 Xpansiv
- 6.4.2 AirCarbon Exchange (ACX)
- 6.4.3 Climate Impact X
- 6.4.4 CME Group Inc.
- 6.4.5 Intercontinental Exchange (ICE)
- 6.4.6 European Energy Exchange (EEX)
- 6.4.7 Carbon Trade Exchange (CTX)
- 6.4.8 Nasdaq
- 6.4.9 Toucan
- 6.4.10 Verra Registry
- 6.4.11 Gold Standard
- 6.4.12 ClearBlue Markets
- 6.4.13 South Pole
- 6.4.14 Flowcarbon
- 6.4.15 Patch
- 6.4.16 Regreener
- 6.4.17 Carbonplace
- 6.4.18 Thallo
- 6.4.19 Cloverly
- 6.4.20 IncubEx
7 Market Opportunities & Future Outlook
- 7.1 White-space & Unmet-Need Assessment
 碳權交易平台市場:市場特徵、計劃類型、交易類型、買方類型、平台類型、終端用戶產業-2026-2032年全球市場預測
 排碳權交易平台市場規模、佔有率及成長分析:依市場類型、系統類型、最終用戶產業、地區及產業預測,2026-2033年
 排碳權交易平台市場分析及預測(至2035年):按類型、產品類型、服務、技術、組件、應用、部署類型、最終用戶和解決方案分類
 排碳權交易平台市場-全球產業規模、佔有率、趨勢、機會、預測:按類型、系統類型、最終用途、地區和競爭格局分類,2021-2031年
 碳權交易平台市場預測至2032年:按類型、系統類型、技術、應用、最終用戶和地區分類的全球分析
 2025年全球碳權交易平台市場報告
 全球市場排碳權交易平台
 2024-2028年排碳權交易平台全球市場
 排碳權交易平台市場報告:2030 年趨勢、預測與競爭分析
 碳權交易平台市場規模、佔有率、趨勢分析報告:按產品類型、最終用途、地區和細分市場預測,2024-2030 年