


 |
市場調查報告書
商品編碼
2062477
緻密氣:市場佔有率分析、產業趨勢與統計、成長預測(2026-2031)Tight Gas - Market Share Analysis, Industry Trends & Statistics, Growth Forecasts (2026 - 2031) |
||||||
※ 本網頁內容可能與最新版本有所差異。詳細情況請與我們聯繫。
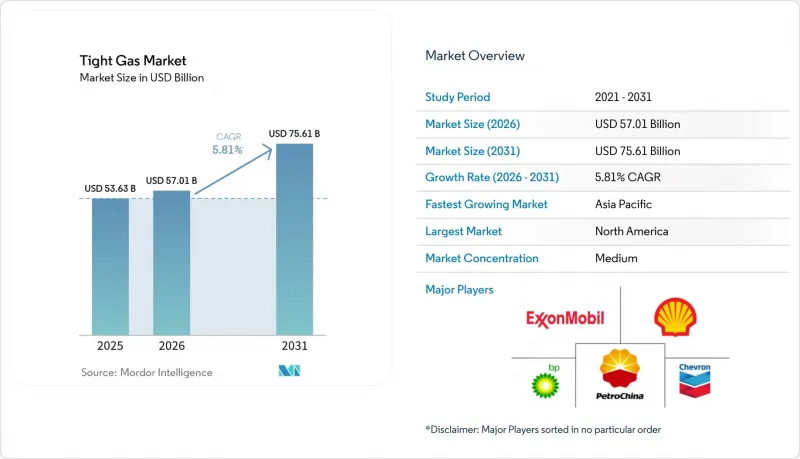
根據 Mordor Intelligence 預測,緻密氣市場規模預計將在 2025 年達到 536.3 億美元,2026 年達到 570.1 億美元,到 2031 年達到 756.1 億美元,2026 年至 2031 年的複合年成長率為 5.81%。
本報告按資源類型(砂岩、石灰岩及其他)、油井類型(常規井、非常規井)、位置(海上、陸上)、最終用戶(大型油氣燃氣公司、公共產業、獨立生產商、政府/國有石油公司及其他)和地區(北美、歐洲、亞太、南美、中東和非洲)進行細分。市場預測以美元計價。
全球緻密氣市場趨勢及洞察
常規天然氣蘊藏量下降
目前,全球現有陸上和海上傳統天然氣田的產量正以每年6.8%的速度下降,迫使生產商每年將約5,000億美元的上游投資轉移到傳統型礦床。北海氣田自1970年代開始運作以來,目前的產量已不足其初始峰值產量的30%,而美國墨西哥灣淺水區的產量自2015年以來已減半。海恩斯維爾水平井的建造成本約為800萬美元,而新建海上平台的成本則高達5,000萬至1億美元,即使在價格週期中期,緻密氣的投資回報也十分迅速。中國石油天然氣集團公司(中石油)報告稱,到2025年,四川盆地緻密氣產量將超過400億立方米,這將有助於抵消大慶和勝利氣田的產量下降。歐洲公司也在進行類似的業務組合調整。道達爾能源公司將於 2024 年退出其成熟的北海資產,並籌集資金投資阿根廷瓦卡穆埃爾塔的緻密氣開發項目。
全球對天然氣發電的需求正在成長。
到2025年,全球燃氣發電裝置容量將增加85吉瓦,這主要得益於亞太地區煤炭向天然氣的轉型以及北美資料中心電力需求的快速成長。美國乾氣日產量預計將從2026年的120.8億立方英尺增加到2027年的122.3億立方英尺,其中60%的成長來自緻密層。長期液化天然氣銷售合約支撐了上游企業的盈利,而美國在2025年獲批的項目將新增超過800億立方公尺/年的液化產能。卡達北方氣田二期計畫預計到2028年將供應12億立方英尺/日的緻密碳酸鹽岩原料。印度已批准在2025年建造12吉瓦的燃氣調峰電廠,這些電廠將使用克里希納-戈達瓦里河的緻密氣。
關於環境和用水的反對意見
科羅拉多緻密氣井的平均用水量在2024年翻了兩番,達到1,717萬加侖,導致在低水位時不得不暫時中止許可證發放。新墨西哥州的佩科斯河協議限制了工業用水的取用,將大規模完井的數量限制在每年15口以內。目前,在二疊紀盆地,循環利用的生產水佔壓裂液的65%,使每桶成本增加0.50至0.80美元。法國和德國仍禁止水力壓裂,導致歐洲約15兆立方英尺技術上可採的緻密氣無法開發。英國在2024年解除了禁令,但仍維持0.5級震級的閾值,阻礙了新井的鑽探。
細分市場分析
截至2025年,砂岩將佔緻密氣市場佔有率的64.2%,其中梅薩巴德(Mesa Barde)和海恩斯維爾(Haynesville)油田的產量受益於天然裂縫網路。預計石灰岩市場將超越砂岩市場,在酸凝膠處理技術的進步推動下,到2031年將以每年6.4%的速度成長,該技術將使單井產量提高約30%。儘管胡夫組(Khufu Formation)深層碳酸鹽岩的埋藏深度達4500米,但SARB深層天然氣開發項目已於2026年1月獲得阿布達比國家石油公司(ADNOC)的批准,這凸顯了業界對該地區深層碳酸鹽岩的熱情。其他資源類型,例如緻密煤海氣和頁岩-緻密混合地層,也將在2025年為市場收入做出重大貢獻。
成本曲線因岩石類型而異。美國中部砂岩井的鑽井成本在600萬至800萬美元之間,而中東碳酸鹽岩井由於需要高溫封井,成本通常超過1500萬美元。然而,石灰岩由於其學習曲線較短,利潤成長更為顯著。卡達能源公司改用酸性凝膠系統後,預計到2025年單井產量將提高22%。在澳大利亞,煤層氣和緻密氣的進口量保持平衡,以滿足昆士蘭液化天然氣的需求,而隨著油氣比的擴大,混合型沃爾夫坎普組井為營運商提供了更多產品選擇。整體而言,北美以外地區的緻密氣市場正逐漸向碳酸鹽岩轉變,但砂岩在美國盆地仍佔據主導地位。
預計到2025年,採用多級水力壓裂技術的水平井將佔總收入的78.7%,並將以每年6.1%的速度成長至2031年。海恩斯維爾油田水平井的平均初始日產量為2500萬立方英尺,而垂直井的日產量僅為1000萬至2000萬立方英尺,這證明了水平井三到四倍的資本投資成本是合理的。在現有油田中,由於地面限制導致水平鑽井困難,傳統垂直井仍然佔據主導地位。
亞太地區的部署正在加速。中石化計畫於2025年在澗陵完成85口水平井,印度石油天然氣公司(ONGC)計畫在2026年底前鑽探10口試驗井。在南美,YPF公司計劃在2025年將其垂直鑽機鑽機減少到15台,同時憑藉在地採購供應鏈將其水平鑽井數量增加到180台。亞伯達的井距規定仍然優先考慮在人口稠密的城鎮進行垂直鑽井,這表明法規、地質條件和地表權共同決定了緻密氣市場井類型的構成。
區域分析
預計到2025年,北美將以45.3%的市佔率引領緻密氣市場,其中二疊紀盆地日產量為150億立方英尺,海恩斯維爾油田日產量為120億立方英尺。隨著鑽探作業轉向乾氣以滿足液化天然氣需求,預計成長速度將放緩至5.2%。加拿大Montney和杜韋爾奈油田的產量將受益於2024年海岸天然氣管道的運作,該管道開闢了一條向西輸送液化天然氣的通道。墨西哥布爾戈斯油田的產量將停滯不前,因為墨西哥國家石油公司(Pemex)優先發展常規海上項目,導致美國管道天然氣進口量達到每日68億立方英尺。
預計亞太地區將維持最高成長率,到2031年複合年成長率將達到6.5%。中國石油天然氣集團公司(中石油)計畫在2025年將鄂爾多斯盆地的天然氣產量增加50億立方米,屆時四川省的天然氣年產量將超過400億立方米,足以取代北京的煤炭消費。印度已批准在克里希納-戈達瓦里河建造一座12吉瓦的燃氣調峰電廠,該電廠將使用緻密氣。澳洲庫柏盆地天然氣產量保持平穩,營運商將重點放在進口緻密氣以滿足液化天然氣供應合約上,同時優先開發煤層氣。
在歐洲,由於德國和法國禁止水力壓裂,挑戰依然存在。儘管英國已解除禁令,但地震風險基準值阻礙了商業化生產。 Equinor公司正在推進其北海海底回接項目,俄羅斯天然氣工業股份公司(Gazprom)的阿奇莫夫緻密氣蘊藏量也繼續向歐洲管道供應天然氣,但制裁限制了技術的引進。
南美洲的成長主要由阿根廷的瓦卡穆埃爾塔氣田推動,YPF公司計劃在2025年將其日產量提高到6000萬立方米,並已獲得30億美元用於管道建設。殼牌和Equinor公司已決定投資25億美元用於當地的緻密氣項目,目標是2029年實現液化天然氣出口。巴西正在評估桑托斯盆地的獲利能力,而玻利維亞已啟動了投資5億美元的查科計畫。
在中東和非洲,阿布達比國家石油公司(ADNOC)已批准了SARB深層天然氣項目,目標是在2029年實現日產量峰值2億標準立方英尺(MMscf/d)。卡達能源公司已將其2026-2030年1500億美元預算的40%用於傳統天然氣開發。沙烏地阿美公司的傑夫拉先導計畫旨在到2030年實現日產量20億立方英尺(Bcf/d)。同時,由於環境評估和水資源短缺問題,南非卡魯盆地的開發工作被推遲。
其他好處:
- Excel格式的市場預測(ME)表
- 3個月的分析師支持
目錄
第1章:引言
- 研究假設和市場定義
- 調查範圍
第2章:調查方法
第3章執行摘要
第4章 市場狀況
- 市場概覽
- 市場促進因素
- 傳統型天然氣蘊藏量下降
- 全球對天然氣發電的需求不斷成長
- 降低技術成本(HZ鑽井和壓裂)
- 政府獎勵將未使用的天然氣貨幣化。
- 緻密氣與碳捕獲和封存技術的融合,為綠色金融打開了大門。
- 國內能源安全政策正在促進國內生產。
- 市場限制因素
- 關於環境和用水的反對意見
- 天然氣價格波動與液化天然氣和頁岩氣對比
- 暫停在新興生產區進行誘發地震
- 偏遠盆地丙烷供應瓶頸
- 供應鏈分析
- 監理情勢
- 技術展望
- 波特五力模型
第5章 市場規模與成長預測
- 按資源類型
- 砂岩
- 石灰岩
- 其他
- 按井類型
- 傳統的
- 傳統型
- 按位置
- 離岸
- 陸上
- 最終用戶
- 大型石油和天然氣公司
- 公用事業
- 獨立製片人
- 政府和國有石油公司
- 其他
- 按地區
- 北美洲
- 美國
- 加拿大
- 墨西哥
- 歐洲
- 德國
- 英國
- 法國
- 義大利
- 北歐國家
- 俄羅斯
- 其他歐洲國家
- 亞太地區
- 中國
- 印度
- 日本
- 韓國
- 東南亞國協
- 其他亞太國家
- 南美洲
- 巴西
- 阿根廷
- 其他南美國家
- 中東和非洲
- 沙烏地阿拉伯
- 阿拉伯聯合大公國
- 南非
- 埃及
- 其他中東和非洲國家
- 北美洲
第6章 競爭情勢
- 市場集中度
- 策略趨勢(併購、聯盟、購電協議)
- 市場佔有率分析(主要公司的市場排名和佔有率)
- 公司簡介
- ExxonMobil Corporation
- Chevron Corporation
- Shell PLC
- bp plc
- TotalEnergies SE
- China National Petroleum Corp.(CNPC)
- ConocoPhillips
- Eni SpA
- China Petroleum and Chemical Corporation
- Chesapeake Energy Corporation
- PetroChina Company Limited
- Equinor ASA
- Occidental Petroleum Corporation
- CNOOC Ltd
- Gazprom PJSC
- Woodside Energy Group Ltd
- QatarEnergy
- Repsol SA
- Ecopetrol SA
- Santos Limited
第7章 市場機會與未來展望
According to Mordor Intelligence, the tight gas market size is projected to be USD 53.63 billion in 2025, USD 57.01 billion in 2026, and reach USD 75.61 billion by 2031, growing at a CAGR of 5.81% from 2026 to 2031.
This report is Segmented by Resource Type (Sandstone, Limestone, Others), Well Type (Conventional, Unconventional), Location (Offshore, Onshore), End-User (Oil & Gas Majors, Utilities, Independent Producers, Government & NOCs, Others), and Geography (North America, Europe, Asia-Pacific, South America, Middle East and Africa). The Market Forecasts are Provided in Terms of Value (USD).
Global Tight Gas Market Trends and Insights
Declining Conventional Gas Reserves
Legacy offshore and onshore conventional gas fields now decline 6.8% per year globally, forcing producers to redirect roughly USD 500 billion of annual upstream spending toward unconventional deposits . North Sea facilities commissioned in the 1970s operate below 30% of their original plateau rates, while U.S. shallow-water Gulf of Mexico output has halved since 2015. A Haynesville horizontal well costs near USD 8 million versus USD 50-100 million for a new offshore platform, giving tight gas a rapid payback even at mid-cycle prices. CNPC reported Sichuan Basin tight-gas output topping 40 billion m3 in 2025, helping offset declines at Daqing and Shengli. European players are rebalancing similarly; TotalEnergies exited mature North Sea assets in 2024 to fund Argentina's Vaca Muerta tight-gas push.
Rising Global Gas-Fired Power Demand
Global additions of 85 GW of gas-fired capacity in 2025 stemmed from coal-to-gas switching in Asia-Pacific and fast-growing data-center loads in North America . U.S. dry-gas production is set to rise from 120.8 Bcf/d in 2026 to 122.3 Bcf/d in 2027, with tight formations supplying 60% of the increase. Long-dated LNG offtake contracts underwrite upstream economics; U.S. projects sanctioned in 2025 added more than 80 bcm/yr of liquefaction. Qatar's North Field Phase 2 will contribute 1.2 Bcf/d of tight-carbonate feedstock by 2028. India cleared 12 GW of gas-peaking plants in 2025 that will lean on Krishna-Godavari tight gas.
Environmental and Water-Use Opposition
Average water use per Colorado tight-gas well quadrupled to 17.17 million gal in 2024, prompting permit pauses during low-reservoir months . New Mexico's Pecos River Compact restricts industrial withdrawal, capping large-scale completions below 15 wells per year. Recycled produced water now covers 65% of Permian fracture fluid but adds USD 0.50-0.80/bbl to cost. France and Germany still ban hydraulic fracturing, blocking roughly 15 Tcf of technically recoverable European tight gas . The U.K. lifted its moratorium in 2024, yet keeps a magnitude-0.5 threshold that has stalled new wells.
Other drivers and restraints analyzed in the detailed report include:
- Technology Cost Deflation
- Tight-Gas / CCS Integration Unlocking Green Finance
- Gas-price volatility vs LNG & shale
For complete list of drivers and restraints, kindly check the Table Of Contents.
Segment Analysis
Sandstone held 64.2% of the tight gas market share in 2025, anchored by Mesaverde and Haynesville outputs that benefit from natural fracture networks. The limestone market is projected to grow at an annual rate of 6.4% through 2031, surpassing sandstone, as advancements in acid-gel treatments enhance per-well productivity by approximately 30%. ADNOC's January 2026 SARB Deep Gas sanction underscores industry appetite for deep Khuff carbonates despite 4,500 m depths. Other resource types, such as tight coal-seam gas and hybrid shale-tight plays, significantly contributed to market revenue in 2025.
Cost curves vary sharply across rock types. Sandstone wells in the U.S. Mid-Continent drill for USD 6-8 million, while Middle East carbonate wells often exceed USD 15 million due to high-temp completions. Yet limestone offers steeper learning-curve gains; QatarEnergy lifted well productivity 22% in 2025 after switching to acid-gel systems. Australia balances coal-seam gas with tight imports to satisfy Queensland LNG, and hybrid Wolfcamp wells grant operators commodity optionality when oil-to-gas ratios widen. Overall, the tight gas market registers a gradual pivot toward carbonates outside North America, while sandstones remain dominant in U.S. basins.
Horizontal wells with multi-stage hydraulic fracturing accounted for 78.7% of 2025 revenue and are projected to expand at 6.1% through 2031. A Haynesville horizontal averages 25 MMcf/d initial output versus 1-2 MMcf/d for a vertical well, justifying the 3-4X capex premium. Conventional vertical wells persist in legacy fields where surface constraints discourage horizontals.
Asia-Pacific is accelerating adoption; Sinopec completed 85 horizontals at Fuling in 2025, and India's ONGC will drill 10 pilot wells by end-2026. In South America, YPF dropped vertical rigs to 15 in 2025 while boosting horizontals to 180, thanks to localized supply chains. Alberta's spacing rules still favor verticals in dense townships, demonstrating that regulation, geology, and surface rights collectively determine well-type mix within the tight gas market.
Geography Analysis
North America led the tight gas market with 45.3% share in 2025, producing 15 Bcf/d from the Permian and 12 Bcf/d from the Haynesville. Growth moderates to 5.2% as drilling migrates toward drier gas for LNG outlets. Canada's Montney and Duvernay flows benefited from the 2024 Coastal GasLink start-up, unlocking westward LNG pathways. Mexico's Burgos output stagnated as Pemex favored offshore conventional projects, leading U.S. pipeline imports to reach 6.8 Bcf/d.
Asia-Pacific posts the fastest 6.5% CAGR to 2031. CNPC expanded Ordos output by 5 bcm in 2025, and Sichuan exceeded 40 bcm/yr, displacing Beijing coal burn. India approved 12 GW of gas-peaking plants that will rely on Krishna-Godavari tight gas. Australia's Cooper Basin stayed flat as operators prioritized coal-seam gas while eyeing tight imports for LNG commitments.
Europe faces challenges due to the fracturing bans in Germany and France. While the United Kingdom has lifted its moratorium, seismic thresholds have hindered commercial operations. Equinor is advancing North Sea subsea tieback projects, and Gazprom's Achimov tight reserves continue to supply European pipelines, although sanctions have restricted technology inflow.
Growth in South America is primarily driven by Argentina's Vaca Muerta, where YPF plans to increase output to 60 MM m3/d by 2025 and has secured USD 3 billion in pipeline funding. Shell and Equinor have committed USD 2.5 billion to local tight gas projects, targeting LNG exports by 2029. Brazil is assessing the margins of the Santos Basin, while Bolivia has launched a USD 500 million Chaco program.
In the Middle East and Africa, ADNOC has approved the SARB Deep Gas project, targeting a plateau of 200 MMscf/d by 2029. QatarEnergy has allocated 40% of its USD 150 billion budget for 2026-2030 to unconventional gas development. Saudi Aramco's Jafurah pilot aims to achieve 2 Bcf/d by 2030. Meanwhile, South Africa's Karoo Basin faces delays due to environmental reviews and water scarcity issues.
- ExxonMobil Corporation
- Chevron Corporation
- Shell PLC
- bp p.l.c.
- TotalEnergies SE
- China National Petroleum Corp. (CNPC)
- ConocoPhillips
- Eni S.p.A.
- China Petroleum and Chemical Corporation
- Chesapeake Energy Corporation
- PetroChina Company Limited
- Equinor ASA
- Occidental Petroleum Corporation
- CNOOC Ltd
- Gazprom PJSC
- Woodside Energy Group Ltd
- QatarEnergy
- Repsol S.A.
- Ecopetrol S.A.
- Santos Limited
Additional Benefits:
- The market estimate (ME) sheet in Excel format
- 3 months of analyst support
TABLE OF CONTENTS
1 Introduction
- 1.1 Study Assumptions & Market Definition
- 1.2 Scope of the Study
2 Research Methodology
3 Executive Summary
4 Market Landscape
- 4.1 Market Overview
- 4.2 Market Drivers
- 4.2.1 Declining conventional gas reserves
- 4.2.2 Rising global gas-fired power demand
- 4.2.3 Technology cost deflation (HZ drilling & frac)
- 4.2.4 Government incentives to monetise stranded gas
- 4.2.5 Tight-gas/CCS integration unlocking green finance
- 4.2.6 National energy-security mandates boosting domestic output
- 4.3 Market Restraints
- 4.3.1 Environmental & water-use opposition
- 4.3.2 Gas-price volatility vs LNG & shale
- 4.3.3 Induced-seismicity moratoria in emerging plays
- 4.3.4 Proppant-supply bottlenecks in remote basins
- 4.4 Supply-Chain Analysis
- 4.5 Regulatory Landscape
- 4.6 Technological Outlook
- 4.7 Porter's Five Forces
- 4.7.1 Threat of New Entrants
- 4.7.2 Bargaining Power of Buyers
- 4.7.3 Bargaining Power of Suppliers
- 4.7.4 Threat of Substitutes
- 4.7.5 Competitive Rivalry
5 Market Size & Growth Forecasts
- 5.1 By Resource Type
- 5.1.1 Sandstone
- 5.1.2 Limestone
- 5.1.3 Others
- 5.2 By Well Type
- 5.2.1 Conventional
- 5.2.2 Unconventional
- 5.3 By Location
- 5.3.1 Offshore
- 5.3.2 Onshore
- 5.4 By End-user
- 5.4.1 Oil & Gas Majors
- 5.4.2 Utilities
- 5.4.3 Independent Producers
- 5.4.4 Government and NOCs
- 5.4.5 Others
- 5.5 By Geography
- 5.5.1 North America
- 5.5.1.1 United States
- 5.5.1.2 Canada
- 5.5.1.3 Mexico
- 5.5.2 Europe
- 5.5.2.1 Germany
- 5.5.2.2 United Kingdom
- 5.5.2.3 France
- 5.5.2.4 Italy
- 5.5.2.5 NORDIC Countries
- 5.5.2.6 Russia
- 5.5.2.7 Rest of Europe
- 5.5.3 Asia-Pacific
- 5.5.3.1 China
- 5.5.3.2 India
- 5.5.3.3 Japan
- 5.5.3.4 South Korea
- 5.5.3.5 ASEAN Countries
- 5.5.3.6 Rest of Asia-Pacific
- 5.5.4 South America
- 5.5.4.1 Brazil
- 5.5.4.2 Argentina
- 5.5.4.3 Rest of South America
- 5.5.5 Middle East and Africa
- 5.5.5.1 Saudi Arabia
- 5.5.5.2 United Arab Emirates
- 5.5.5.3 South Africa
- 5.5.5.4 Egypt
- 5.5.5.5 Rest of Middle East and Africa
- 5.5.1 North America
6 Competitive Landscape
- 6.1 Market Concentration
- 6.2 Strategic Moves (M&A, Partnerships, PPAs)
- 6.3 Market Share Analysis (Market Rank/Share for key companies)
- 6.4 Company Profiles (includes Global level Overview, Market level overview, Core Segments, Financials as available, Strategic Information, Products & Services, and Recent Developments)
- 6.4.1 ExxonMobil Corporation
- 6.4.2 Chevron Corporation
- 6.4.3 Shell PLC
- 6.4.4 bp p.l.c.
- 6.4.5 TotalEnergies SE
- 6.4.6 China National Petroleum Corp. (CNPC)
- 6.4.7 ConocoPhillips
- 6.4.8 Eni S.p.A.
- 6.4.9 China Petroleum and Chemical Corporation
- 6.4.10 Chesapeake Energy Corporation
- 6.4.11 PetroChina Company Limited
- 6.4.12 Equinor ASA
- 6.4.13 Occidental Petroleum Corporation
- 6.4.14 CNOOC Ltd
- 6.4.15 Gazprom PJSC
- 6.4.16 Woodside Energy Group Ltd
- 6.4.17 QatarEnergy
- 6.4.18 Repsol S.A.
- 6.4.19 Ecopetrol S.A.
- 6.4.20 Santos Limited
7 Market Opportunities & Future Outlook
- 7.1 White-space & Unmet-need Assessment


