

 |
市場調查報告書
商品編碼
2062474
第五方物流(5PL):市場佔有率分析、產業趨勢與統計、成長預測(2026-2031)Fifth-party Logistics (5PL) - Market Share Analysis, Industry Trends & Statistics, Growth Forecasts (2026 - 2031) |
||||||
※ 本網頁內容可能與最新版本有所差異。詳細情況請與我們聯繫。
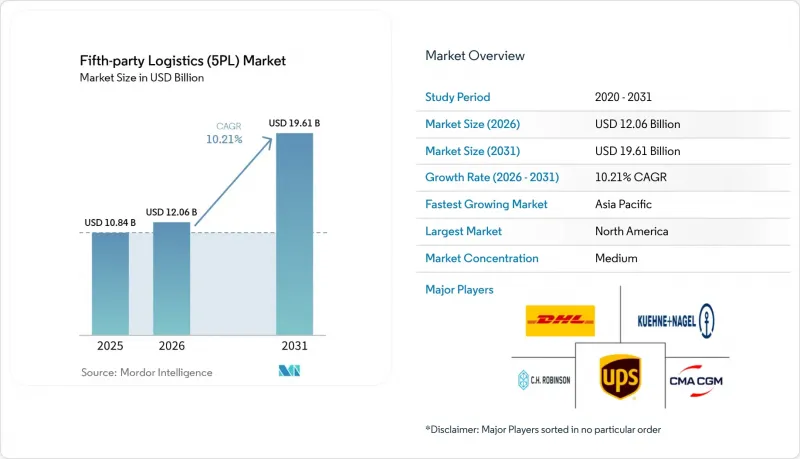
根據 Mordor Intelligence 預測,第五方物流市場規模將從 2025 年的 108.4 億美元成長到 2026 年的 120.6 億美元,到 2031 年將達到 196.1 億美元,2026 年至 2031 年的複合年成長率為 10.21%。
本報告按服務模式(例如,運輸服務)、終端用戶產業(例如,電子商務、零售)、經營模式(例如,直接電子商務、第三方/第四方物流聚合商/整合商)、公司規模(例如,大型企業)和地區(例如,北美、南美)進行分類。市場預測以美元計價。
全球第五方物流 (5PL) 市場趨勢與洞察
D2C品牌的擴張正在推動對承包履約的需求。
數位化優先的品牌正在重塑籌資策略,要求一站式物流服務涵蓋倉儲、運輸和退貨,所有環節均包含在一份合約中。學術研究表明,全通路零售商需要能夠同時處理實體店、線上訂單和自提點的庫存管理演算法,而這種複雜性正推動第五方物流 (5PL) 市場供應商的發展。由於這些品牌通常缺乏建構自有網路的規模,承包5PL 解決方案可以將基礎設施建設週期從數年縮短至數週。亞太地區社交電商的蓬勃發展進一步提升了對整合支付、庫存視覺化和當日送達功能的平台的需求。整合的 5PL夥伴關係關係正成為一種策略行銷工具,因為卓越的履約如今直接影響著客戶獲取成本。
疫情後全通路庫存管理的複雜性日益增加
疫情迫使零售商同時經營實體店和線上通路,導致庫存佈局決策的數量增加了一倍。研究表明,企業需要協調多個履約中心,才能在不增加營運資金的情況下達到服務目標。現成的工具不足以平衡季節性、促銷活動和即時需求。領導企業正透過將機器學習引擎整合到持續重新分配貨物的控制塔中來應對這項挑戰。零售商因此受惠於服務水準的提升和安全庫存的減少,物流最佳化也因此成為提高利潤率的關鍵驅動力。
建置全球微型倉配網路需要大量資金
當日達服務需要在人口密集的都市區建立微型倉庫,但飆升的地價和自動化設備成本已將資本需求推至小規模新參與企業難以企及的水平。損益平衡分析表明,盈利取決於高訂單密度,而訂單密度在許多地區都是一個不確定因素。為多個客戶分離庫存也會增加管理成本並降低運轉率。這些經濟因素正在推動產業整合,資金雄厚的供應商透過收購競爭對手來佔據黃金位置。高額的初始投資正在減緩擴張速度,並拉低整個產業的複合年成長率。
細分市場分析
截至2025年,運輸服務佔第五方物流市場的49.83%,但由於商品化壓力,支出正轉向附加價值服務,預計到2031年,增值服務將以15.59%的複合年成長率成長。客戶越來越將貨運視為基本需求,並根據能否提供諮詢、分析和區塊鏈整合等一站式服務來選擇合約。這種結構轉變正在擴大第五方物流市場的規模,其中包括曾經不在核心物流預算範圍內的諮詢功能。由於小包裹密度高,道路運輸仍是最後一公里配送的主要方式,可維持頻繁的運輸路線,但多模態最佳化工具正在將一些非緊急貨物轉移到海運,從而減少碳排放。
機器人即服務 (RaaS) 的普及清楚地體現了這一轉變。像 DHL 這樣的供應商正在以可變成本合約的形式整合 Locus 的自主移動機器人車隊,在無需托運人進行資本支出的情況下提高了取件效率。庫存管理模組擴大採用區塊鏈技術,以滿足歐洲「數位產品護照」的要求。這些功能提高了每位客戶的交叉銷售收入,並導致比傳統收費模式更高的轉換成本。由於諮詢和技術收入的成長速度超過了貨運收入,市場估值現在越來越依賴智慧財產權和數據分析的深度。
預計2025年,受D2C(直接面對消費者)銷售動能的推動,電子商務和零售業將維持37.97%的第五方物流(5PL)市場佔有率。然而,醫療保健和製藥業預計將以13.35%的複合年成長率成長,成為成長最快的終端用戶領域。疫苗的溫控要求和防偽法規要求完全可追溯性,而整合區塊鏈和物聯網感測器的5PL平台在這方面表現出色。雖然零售業在銷售方面仍然佔據主導地位,但由於需要特殊的包裝和合規性要求,製藥業的單位收入更高。亞太地區社交電商和直播購物的整合正在增加跨境小包裹的數量,從而推動對統一海關單證和自動化海關支付流程的需求。
食品飲料公司也紛紛湧向第五方物流 (5PL) 市場供應商,尋求透過調整庫存來最佳化低溫運輸,以滿足餐廳和雜貨店不斷變化的需求。工業製造商則利用 5PL 控制塔來協調進貨零件和出貨成品,從而縮短貨物停留時間。在所有產業中,採用 5PL 的企業都面臨著一個通用的挑戰:供應鏈日益複雜,僅靠小規模內部團隊難以有效管理。
區域分析
預計到2025年,北美將佔第五方物流(5PL)市場收入的36.72%,這得益於其成熟的電子商務生態系統以及機器人即服務(RaaS)的早期應用,後者降低了倉庫營運商的自動化成本。美國和加拿大對承運商分配中演算法偏差的監管最為嚴格,促使主要供應商在其路線規劃引擎中加入公平性審計和可解釋的人工智慧元素。 D2C(直接面對消費者)品牌的激增提高了小包裹密度,使得在農村城市部署微型倉配中心成為可能;同時,物流平台嵌入式的金融服務也越來越受到尋求替代融資方案的小規模賣家的青睞。
亞太地區是成長最快的地區,預計到2031年複合年成長率將達到11.97%。連接中國、東南亞和澳洲的跨境電商走廊正在產生高頻小包裹流量,並受益於統一的海關程序和預繳關稅功能。印度和印尼政府對供應鏈數位化提供的津貼,鼓勵中型製造商將營運協調外包給「第五方物流(5PL)」市場平台。中國主要城市引入壅塞費,迫使倉庫業者部署可在較小空間內運作的自主機器人,加速了機器人即服務(RaaS)的普及。隨著品牌不再依賴單一國家採購並實現營運多元化,近岸外包趨勢也推動了對越南和泰國履約中心的投資。
在歐洲,在全面的永續發展法規的推動下,經濟持續穩定成長。碳邊境調節機制(CBAM)強制要求詳細的排放報告,迫使進口商使用擁有認證計算引擎的第五物流(5PL)供應商。數位產品護照計畫正在加速時尚和電子產品整個供應鏈中區塊鏈技術的應用。提供包裝合規和履約服務的供應商正逐漸超越那些專注於運輸、資產密集的競爭對手。儘管南美洲、中東和非洲的基礎設施相對落後,但一些都市區正在開展共用微型倉配先導計畫,這表明如果資金到位,這些地區未來有可能迎頭趕上。
其他好處:
- Excel格式的市場預測(ME)表
- 3個月的分析師支持
目錄
第1章:引言
- 研究假設和市場定義
- 調查範圍
第2章:調查方法
第3章執行摘要
第4章 市場狀況
- 市場概覽
- 市場促進因素
- D2C品牌的擴張正在推動對承包履約的需求。
- 疫情後全通路庫存管理的複雜性日益增加
- 強制使用區塊鏈進行溯源,提高了外包的吸引力。
- 在地緣政治動盪背景下,供應鏈韌性至關重要。
- 將即插即用的機器人即服務整合到第五方物流合約中
- 嵌入式金融服務於 5PL 控制塔平台
- 市場限制因素
- 建置全球微型倉配網路需要大量資金
- 海上運輸能力的波動性降低了最佳化的準確性。
- 對通訊業者選擇中演算法偏見的監管
- 第五物流供應商遵守碳邊境調節措施的負擔
- 波特五力模型
- 價值供應鏈分析
- 產業的技術創新
- 政府法規和政策
- 地緣政治事件對市場的影響
第5章 市場規模與成長預測
- 按服務模式
- 交通運輸服務
- 路
- 航空
- 海
- 多模態
- 倉儲和履約
- 庫存管理
- 附加價值服務(技術、分析、諮詢等)
- 交通運輸服務
- 按最終用戶行業分類
- 電子商務與零售
- 面向消費者的包裝商品
- 食品和飲料(包括低溫運輸)
- 醫療保健和製藥
- 工業和製造業
- 其他
- 按經營模式/按客戶類型
- 透過電子商務進行直接銷售
- 第三方/第四方物流聚合商/整合商
- 企業客製化供應鏈編配
- 基於平台、技術主導的外包
- 其他(政府/公共部門、聯盟型物流協調、企劃為基礎活動/展覽)
- 按公司規模
- 大公司
- 中小企業
- 按地區
- 北美洲
- 美國
- 加拿大
- 墨西哥
- 南美洲
- 巴西
- 秘魯
- 智利
- 阿根廷
- 其他南美國家
- 亞太地區
- 印度
- 中國
- 日本
- 澳洲
- 韓國
- 東南亞(新加坡、馬來西亞、泰國、印尼、越南、菲律賓)
- 其他亞太國家
- 歐洲
- 英國
- 德國
- 法國
- 西班牙
- 義大利
- 比荷盧經濟聯盟(比利時、荷蘭、盧森堡)
- 北歐國家(丹麥、芬蘭、冰島、挪威、瑞典)
- 其他歐洲國家
- 中東和非洲
- 阿拉伯聯合大公國
- 沙烏地阿拉伯
- 南非
- 奈及利亞
- 其他中東和非洲國家
- 北美洲
第6章 競爭情勢
- 市場集中度
- 策略趨勢
- 市佔率分析
- 公司簡介
- DHL Supply Chain(DHL Group)
- CEVA Logistics(CMA CGM Group)
- Kuehne+Nagel International AG
- UPS Supply Chain Solutions
- CH Robinson Worldwide
- DSV A/S
- DB Schenker
- Maersk Logistics and Services
- GXO Logistics
- GEODIS
- Ryder System, Inc.
- Nippon Express Holdings(NX Group)
- Toll Group
- Amazon Global Logistics
- Cainiao Smart Logistics Network(Alibaba Group)
- JD Logistics
- Uber Freight
- Flexport Inc.
- Sennder Technologies
- ShipBob
- Expeditors International of Washington, Inc.
第7章 市場機會與未來展望
According to Mordor Intelligence, the fifth-Party logistics market size is expected to increase from USD 10.84 billion in 2025 to USD 12.06 billion in 2026 and reach USD 19.61 billion by 2031, growing at a CAGR of 10.21% over 2026-2031.
This report is Segmented by Service Model (Transportation Services, and More), by End-User Industry (E-Commerce & Retail, and More), by Business Model (Direct To E-Commerce, Aggregator/Integrator for 3PL/4PL, and More), by Enterprise Size (Large Enterprises, and More), and by Geography (North America, South America, and More). The Market Forecasts are Provided in Terms of Value (USD).
Global Fifth-party Logistics (5PL) Market Trends and Insights
Direct-to-Consumer Brand Expansion Fueling Turnkey Fulfillment Demand
Digital-first brands are reshaping procurement strategies by insisting on single-source logistics that cover warehousing, shipping, and returns under a single contract. Academic studies show that omnichannel retailers need inventory algorithms that can serve storefronts, online orders, and pickup points simultaneously, a complexity that favors Fifth-Party Logistics market providers. These brands rarely have the scale to build networks on their own, so turnkey 5PL solutions collapse multi-year infrastructure timelines into weeks. Social commerce adoption in the Asia-Pacific further amplifies demand for platforms that blend payments, inventory visibility, and same-day delivery. Superior fulfillment now directly influences customer acquisition costs, making integrated 5PL partnerships a strategic marketing lever.
Heightened Omnichannel Inventory Complexity Post-Pandemic
The pandemic pushed retailers to run physical stores and digital channels in parallel, multiplying the number of stock-placement decisions. Research confirms companies must synchronize many fulfillment nodes to hit service targets without inflating working capital. Off-the-shelf tools are inadequate for balancing seasonality, promotions, and real-time demand sensing. Fifth-Party Logistics market leaders solve this by embedding machine-learning engines inside control towers that continuously reposition goods. Retailers benefit from higher service levels and reduced safety stocks, turning logistics optimization into a margin driver.
Capital-Heavy Build-Out of Global Micro-Fulfillment Networks
Same-day delivery requires micro-warehouses in dense urban areas, but high land prices and the cost of automation equipment push capital requirements beyond the reach of smaller entrants. Break-even analysis shows profitability hinges on high order density, an uncertain variable in many locales. Inventory segregation for multiple clients also drives overhead, eroding utilization rates. These economics encourage consolidation as well-funded providers purchase rivals to secure prime sites. Up-front spending slows expansion pace, trimming overall industry CAGR.
Other drivers and restraints analyzed in the detailed report include:
- Supply-Chain Resilience Needs Amid Geopolitical Disruptions
- Plug-and-Play Robotics-as-a-Service Bundled into 5PL Contracts
- Ocean-Freight Capacity Volatility Weakening Optimization Accuracy
For complete list of drivers and restraints, kindly check the Table Of Contents.
Segment Analysis
Transportation Services controlled 49.83% of the Fifth-Party Logistics market share in 2025, yet commoditization pressures are redirecting spending toward Value-Added Services that are accelerating at a 15.59% CAGR through 2031. Clients increasingly view freight movement as a baseline requirement and award contracts based on the provider's ability to deliver consulting, analytics, and blockchain integration in one bundle. This mix change is expanding the Fifth-Party Logistics market size for advisory functions that once sat outside core logistics budgets. Road transport still dominates last-mile delivery because parcel density supports frequent routes, while multimodal optimization tools shift non-urgent volumes to sea lanes to shrink carbon footprints.
Robotics-as-a-service deployments underscore the pivot. Providers such as DHL integrate fleets of Locus autonomous mobile robots under variable-cost arrangements, improving pick rates for shippers without capital expense. Inventory management modules increasingly embed blockchain to meet Digital Product Passport mandates in Europe. These capabilities boost cross-sell revenue per customer and raise switching costs well above those in traditional rate-based relationships. As advisory and tech income grow faster than trucking revenue, market valuations now hinge on intellectual property and depth of data analytics.
E-commerce & Retail retained 37.97% share of the Fifth-Party Logistics market in 2025 thanks to direct-to-consumer momentum, yet Healthcare & Pharma is projected to climb at a 13.35% CAGR, making it the fastest-growing end-user bloc. Vaccine temperature-control mandates and anti-counterfeit regulations compel full traceability, an area where 5PL platforms that marry blockchain and Internet-of-Things sensors excel. Retailers still dominate by volume, but pharmaceuticals deliver higher revenue per unit because of specialized packaging and compliance tasks. The convergence of social commerce and livestream shopping in the Asia-Pacific increases cross-border parcel counts, reinforcing demand for unified customs documentation and duty-payment automation.
Food & Beverage companies also gravitate to Fifth-Party Logistics market providers for cold-chain orchestration that aligns inventory with fluctuating restaurant and grocery demand. Industrial manufacturers leverage 5PL control towers to coordinate inbound parts with outbound finished goods, reducing dwell times. Across sectors, the thread that unites adopters is rising supply-chain complexity that small internal teams cannot easily master.
Geography Analysis
North America held 36.72% of the Fifth-Party Logistics market revenue in 2025, underpinned by mature e-commerce ecosystems and early adoption of robotics-as-a-service, which lowers automation entry costs for warehouse operators. Regulatory scrutiny over algorithmic bias in carrier allocation is strongest in the United States and Canada, prompting leading providers to embed fairness audits and explainable-AI components in their routing engines. Direct-to-consumer brand proliferation is adding parcel density that justifies micro-fulfillment rollout in secondary cities, while embedded finance on logistics platforms is gaining traction among small sellers seeking alternative credit.
Asia Pacific is the fastest-growing region with an 11.97% CAGR through 2031. Cross-border e-commerce corridors linking China, Southeast Asia, and Australia generate high-frequency parcel flows that benefit from unified customs clearance and duty pre-payment features. Government grants for supply-chain digitalization in India and Indonesia encourage mid-tier manufacturers to outsource orchestration to the Fifth-Party Logistics market platforms. Urban congestion fees in major Chinese cities are pushing warehouse operators to adopt autonomous mobile robots that can work in tighter footprints, accelerating RaaS uptake. Nearshoring trends also spur investment in Vietnamese and Thai fulfillment hubs as brands diversify away from single-country sourcing.
Europe maintains steady growth driven by far-reaching sustainability regulations. The Carbon Border Adjustment Mechanism demands granular emissions reporting, prompting importers to enlist 5PL providers with certified calculation engines. The Digital Product Passport program accelerates blockchain deployment across fashion and electronics supply chains. Providers offering packaged compliance plus fulfillment gain an advantage over asset-heavy rivals focused solely on transport. Although South America and the Middle East & Africa lag in infrastructure, select urban centers see pilot projects for shared micro-fulfillment, signaling future catch-up potential as capital becomes available.
- DHL Supply Chain (DHL Group)
- CEVA Logistics (CMA CGM Group)
- Kuehne + Nagel International AG
- UPS Supply Chain Solutions
- C.H. Robinson Worldwide
- DSV A/S
- DB Schenker
- Maersk Logistics and Services
- GXO Logistics
- GEODIS
- Ryder System, Inc.
- Nippon Express Holdings (NX Group)
- Toll Group
- Amazon Global Logistics
- Cainiao Smart Logistics Network (Alibaba Group)
- JD Logistics
- Uber Freight
- Flexport Inc.
- Sennder Technologies
- ShipBob
- Expeditors International of Washington, Inc.
Additional Benefits:
- The market estimate (ME) sheet in Excel format
- 3 months of analyst support
TABLE OF CONTENTS
1 Introduction
- 1.1 Study Assumptions & Market Definition
- 1.2 Scope of the Study
2 Research Methodology
3 Executive Summary
4 Market Landscape
- 4.1 Market Overview
- 4.2 Market Drivers
- 4.2.1 Direct-to-consumer brand expansion fuelling turnkey fulfilment demand
- 4.2.2 Heightened Omni-Channel Inventory Complexity Post-Pandemic
- 4.2.3 Blockchain Provenance Mandates Enhancing Outsourcing Appeal
- 4.2.4 Supply-Chain Resilience Needs Amid Geopolitical Disruptions
- 4.2.5 Plug-and-Play Robotics-as-a-Service Bundled into 5Pl Contracts
- 4.2.6 Embedded Finance Services Within 5Pl Control-Tower Platforms
- 4.3 Market Restraints
- 4.3.1 Capital-Heavy Build-Out of Global Micro-Fulfilment Networks
- 4.3.2 Ocean-Freight Capacity Volatility Weakening Optimisation Accuracy
- 4.3.3 Regulatory Scrutiny of Algorithmic Bias In Carrier Allocation
- 4.3.4 Carbon Border Adjustment Compliance Burden on 5Pl Providers
- 4.4 Porter's Five Forces
- 4.4.1 Threat of New Entrants
- 4.4.2 Bargaining Power of Buyers
- 4.4.3 Bargaining Power of Suppliers
- 4.4.4 Threat of Substitutes
- 4.4.5 Competitive Rivalry
- 4.5 Value / Supply-Chain Analysis
- 4.6 Technological Innovations in the Industry
- 4.7 Government Regulations and Policies
- 4.8 Impact of Geopolitical Events on the Market
5 Market Size & Growth Forecasts
- 5.1 By Service Model
- 5.1.1 Transportation Services
- 5.1.1.1 Road
- 5.1.1.2 Air
- 5.1.1.3 Sea
- 5.1.1.4 Multimodal
- 5.1.2 Warehousing & Fulfillments
- 5.1.3 Inventory Mangement
- 5.1.4 Value Added Services (tech, analytics, consulting, etc.)
- 5.1.1 Transportation Services
- 5.2 By End-user Industry
- 5.2.1 E-commerce & Retail
- 5.2.2 Consumer Packaged Goods
- 5.2.3 Food & Beverage (incl. Cold-chain)
- 5.2.4 Healthcare & Pharma
- 5.2.5 Industrial & Manufacturing
- 5.2.6 Others
- 5.3 By Business Model / Client Type
- 5.3.1 Direct to E-commerce
- 5.3.2 Aggregator/Integrator for 3PL/4PL
- 5.3.3 Custom Supply Chain Orchestration for Enterprises
- 5.3.4 Platform-based, Technology-driven Outsourcing
- 5.3.5 Others (Government/public sector, alliance-based logistics orchestration, project based events/exhibitions)
- 5.4 By Enterprise Size
- 5.4.1 Large Enterprises
- 5.4.2 Small & Medium Enterprises (SMEs)
- 5.5 By Geography
- 5.5.1 North America
- 5.5.1.1 United States
- 5.5.1.2 Canada
- 5.5.1.3 Mexico
- 5.5.2 South America
- 5.5.2.1 Brazil
- 5.5.2.2 Peru
- 5.5.2.3 Chile
- 5.5.2.4 Argentina
- 5.5.2.5 Rest of South America
- 5.5.3 Asia-Pacific
- 5.5.3.1 India
- 5.5.3.2 China
- 5.5.3.3 Japan
- 5.5.3.4 Australia
- 5.5.3.5 South Korea
- 5.5.3.6 Southeast Asia (Singapore, Malaysia, Thailand, Indonesia, Vietnam, and Philippines)
- 5.5.3.7 Rest of Asia-Pacific
- 5.5.4 Europe
- 5.5.4.1 United Kingdom
- 5.5.4.2 Germany
- 5.5.4.3 France
- 5.5.4.4 Spain
- 5.5.4.5 Italy
- 5.5.4.6 BENELUX (Belgium, Netherlands, and Luxembourg)
- 5.5.4.7 NORDICS (Denmark, Finland, Iceland, Norway, and Sweden)
- 5.5.4.8 Rest of Europe
- 5.5.5 Middle East and Africa
- 5.5.5.1 United Arab Emirates
- 5.5.5.2 Saudi Arabia
- 5.5.5.3 South Africa
- 5.5.5.4 Nigeria
- 5.5.5.5 Rest of Middle East and Africa
- 5.5.1 North America
6 Competitive Landscape
- 6.1 Market Concentration
- 6.2 Strategic Moves
- 6.3 Market Share Analysis
- 6.4 Company Profiles (includes Global level Overview, Market level overview, Core Segments, Financials as available, Strategic Information, Market Rank/Share for key companies, Products & Services, and Recent Developments)
- 6.4.1 DHL Supply Chain (DHL Group)
- 6.4.2 CEVA Logistics (CMA CGM Group)
- 6.4.3 Kuehne + Nagel International AG
- 6.4.4 UPS Supply Chain Solutions
- 6.4.5 C.H. Robinson Worldwide
- 6.4.6 DSV A/S
- 6.4.7 DB Schenker
- 6.4.8 Maersk Logistics and Services
- 6.4.9 GXO Logistics
- 6.4.10 GEODIS
- 6.4.11 Ryder System, Inc.
- 6.4.12 Nippon Express Holdings (NX Group)
- 6.4.13 Toll Group
- 6.4.14 Amazon Global Logistics
- 6.4.15 Cainiao Smart Logistics Network (Alibaba Group)
- 6.4.16 JD Logistics
- 6.4.17 Uber Freight
- 6.4.18 Flexport Inc.
- 6.4.19 Sennder Technologies
- 6.4.20 ShipBob
- 6.4.21 Expeditors International of Washington, Inc.
7 Market Opportunities & Future Outlook
 2026年全球五方物流(5PL)市場報告
 5PL解決方案市場:2026-2032年全球市場預測(按服務類型、部署模式、組織規模、技術、應用和最終用戶產業分類)
 全球第五物流解決方案市場規模、佔有率、趨勢和成長分析報告(2026-2034年)
 5P物流市場分析及2034年預測:類型、產品、服務、技術、組件、應用、流程、部署、最終用戶、解決方案
 第五方物流(5PL)的全球市場的評估:各服務提供,各客戶類型,各產業,各地區,機會,預測(2017年~2031年)
 第五方物流(5PL) 解決方案的全球市場
 到 2030 年全球 5PL(第五方物流)市場預測:按服務類型、應用和地區分類