


 |
市場調查報告書
商品編碼
2062460
汽車網路:市場佔有率分析、產業趨勢與統計、成長預測(2026-2031)In-Vehicle Networking - Market Share Analysis, Industry Trends & Statistics, Growth Forecasts (2026 - 2031) |
||||||
※ 本網頁內容可能與最新版本有所差異。詳細情況請與我們聯繫。
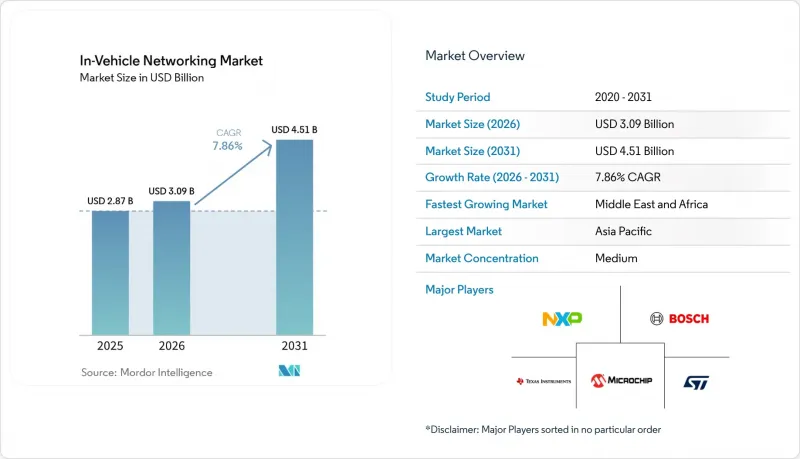
據 Mordor Intelligence 稱,2025 年汽車網路市場價值為 28.7 億美元,預計到 2031 年將從 2026 年的 30.9 億美元成長至 45.1 億美元,預測期(2026-2031 年)的複合年成長率為 7.86%。
本報告按協議/技術(本地互連網路、FlexRay 等)、車輛類型(乘用車、輕型商用車等)、應用(動力傳動系統和底盤控制、安全和高級駕駛輔助系統、資訊娛樂和遠端資訊處理等)、組件(收發器、控制器和閘道器等)以及地區進行細分。市場預測以美元計價。
全球汽車網路市場趨勢與洞察
車輛電氣化和ADAS日益成長的頻寬需求。
電池式電動車和插電式混合動力汽車平台整合的感測器數量比內燃機汽車多40%,每小時產生數Terabyte的原始資料。傳統的5Mbps CAN-FD連結無法有效處理如此龐大的資料量,因此100BASE-T1和1000BASE-T1乙太網路被廣泛採用作為感測器融合的回程傳輸。微控制器供應商目前正在邊緣節點整合10BASE-T1S低速乙太網,使低成本的溫度和壓力感測器能夠將資料傳輸到區域閘道器,然後由區域閘道器將聚合的資料上行到Gigabit幹線。這種集中式架構也顯著縮短了佈線長度,從而提高了高能量密度電池組的續航里程。感測器軟體的空中升級每個單元的資料量可能超過10GB,只有Gigabit乙太網路結合5G和衛星卸載技術才能處理如此大的負載。中國的GB/T 32960即時車載資訊服務標準進一步提升了上行鏈路的需求,並推動了乙太網路的普及。
OEM 從基於域的 E 和 E 架構遷移到基於區域的 E 和 E 架構。
傳統的網域配置需要綿延數公里的線束和多達 100 個控制器。基於區域的拓撲結構透過將計算處理轉移到更靠近物理負載的 3-5 個區域閘道器,消除域間跳轉,從而減少高達 30% 的電纜重量並降低延遲。大眾汽車的「中國電子架構」就是一個早期案例,它減少了 30% 的控制器數量,並將軟體發布週期縮短了一半。區域閘道器必須橋接 LIN、CAN-FD、FlexRay 和以太網,同時滿足 ISO 21434 網路安全要求和 AUTOSAR Adaptive 相容性。這導致了對整合 16 個或更多 CAN 通道並包含 TSN 交換器和硬體安全模組的半導體的需求增加。
與物料清單目標相比,線束重量和成本增加
在電池式電動車車型中,線束重量可達80公斤,這會導致續航里程縮短。到2026年初,銅的平均價格將上漲至每噸10,700美元,銀的平均價格將上漲至每盎司99美元,這將使電纜成本增加近五分之一。從400V架構過渡到800V架構會使導體的面積減半,但對更高額定值連接器的需求抵消了任何成本節省。區域整合可將電纜長度縮短約四分之一,但對額外閘道半導體的需求會使控制器成本增加超過三分之一。在生產連結獎勵計畫下進行本地生產的印度供應商面臨尤為嚴格的物料清單(BOM)限制。
細分市場分析
2025年,CAN和CAN-FD憑藉其低成本以及在動力傳動系統和車身控制迴路中的成熟應用,將維持36.89%的汽車網路市場佔有率。 FlexRay雖然屬於小眾產品,但由於其在線傳和線控刹車平台上的關鍵確定性雙通道冗餘,預計將以7.93%的複合年成長率成長。汽車乙太網路的傳輸速率現已從10兆位元/秒擴展到10Gigabit/秒,使得資訊娛樂系統、ADAS(高級駕駛輔助系統)和集中式運算能夠在單一骨幹網路上共存。這項轉變已由IEEE 802.1DG-2025正式定義。 LIN仍是座椅、後視鏡和照明等20千位元以下應用的旗艦標準。 MOST的150兆位元/秒的限制已無法滿足4K串流媒體的需求,因此其市佔率持續下降。
整合 CAN-FD、LIN 和 FlexRay多重通訊協定的微控制器能夠縮小基板尺寸並縮短檢驗週期,同時區域閘道還能吸收車身功能。新興的 CAN-XL 將每幀有效載荷擴展至 2048 字節,使其成為傳統控制迴路和乙太網路隧道之間的橋樑。與分立元件實作相比,具有內建 MACsec 和 1588 時間戳功能的安全性 1000BASE-T1 PHY 可將基板面積減少高達 15%。因此,隨著每個連接埠平均價格的上漲,與乙太網路 PHY 相關的汽車網路市場規模的成長速度將超過節點數量的成長速度。
預計到2025年,乘用車將佔總收入的55.34%,年產量將達到約7,000萬輛。雖然工程機械、農業機械和礦業機械的產量會較低,但預計其複合年成長率將達到8.23%。這一成長主要得益於越來越多的車隊所有者尋求預測性維護和遠距離診斷,而這些都需要乙太網路閘道器。此外,這些機械產業對先進遠端資訊處理系統和物聯網整合技術的日益普及也進一步推動了這一趨勢。
輕型商用車受益於與乘用車零件的通用,能夠以極低的額外成本連接到Gigabit骨幹網路。重型卡車必須滿足新的自動駕駛法規要求,而這些法規要求使用確定性乙太網路。非公路用車輛設計人員正在採用符合 IP69K 標準的 CAN 轉乙太網路橋接器,以確保設備能夠承受灰塵、振動和水噴濺。與整體市場相比,這些趨勢正推動專用車輛領域的車載網路市場實現更強勁的成長。
區域分析
預計到2025年,亞太地區將佔全球收入的43.78%,這主要得益於中國2700萬輛乘用車的年產量以及印度新近宣布的30萬輛新能源汽車工廠(該工廠的目標是實現新能源汽車75%的在地採購率)。 GB/T 32960平台規範迫使所有中國汽車製造商採用整合5G上行鏈路的乙太網路閘道器,從而加速了半導體出貨量的成長。印度與生產連結獎勵計畫吸引網路組件供應商落腳本地產業叢集,降低了關稅風險,並促進了區域車載網路市場的發展。日本和韓國則專注於高階ADAS功能,從而提前催生了對TSN硬體的需求。
預計到2025年,北美將佔全球支出的約四分之一,這主要得益於美國1,100萬輛輕型卡車和SUV的產量,以及墨西哥面向出口的組裝生產。汽車生產線維護和網路安全措施等空中升級相關法規的進步正在推動乙太網路的普及。矽谷新創公司提供的SDV中介軟體正在加速底特律地區汽車製造商的整合週期,並支援對閘道器和集中式運算的穩健投資。美國的通膨控制法案提供的補貼刺激了國內電池和電子元件的供應,間接促進了車載網路市場的發展。
歐洲憑藉主導的豪華和高性能汽車品牌在區域拓撲結構、集中式高級駕駛輔助系統 (ADAS) 以及 ISO 21434 認證方面的領先優勢,佔據了 20-22% 的市場佔有率。聯合國歐洲經濟委員會 (UN ECE) 制定的法規統一了成員國的安全和網路安全期限,有助於乙太網路和 FlexRay 升級的可預測部署計畫。東歐工廠正利用較低的人事費用組裝線束和光纖鏈路,確保區域成本競爭力。中東和非洲地區目前佔據個位數的市場佔有率,但預計到 2031 年將以 8.94% 的複合年成長率成長,因為智慧城市大型企劃要求車輛與基礎設施之間實現互聯互通。南美洲受益於南方共同市場 (Mercosur) 的法規,該法規降低了本地生產的 CAN-FD 和乙太網路組件的進口關稅,但宏觀經濟波動限制了市場規模的絕對成長。
其他好處:
- Excel格式的市場預測(ME)表
- 3個月的分析師支持
目錄
第1章:引言
- 研究假設和市場定義
- 調查範圍
第2章:調查方法
第3章執行摘要
第4章 市場狀況
- 市場概覽
- 市場促進因素
- 汽車電氣化和ADAS日益成長的頻寬需求
- 資訊娛樂/車載資訊服務功能的普及
- 先進安全網路的監理要求
- OEM從基於域的E/E架構遷移
- 中國面臨壓力,需規範新能源汽車平台
- 汽車乙太網路中時間敏感網路 (TSN) 的應用
- 市場限制因素
- 將增加的線束重量和成本與物料清單目標進行比較
- 多重通訊協定堆疊中網路安全認證的複雜性
- 散熱和電磁相容性限制為 1 Gbps 或更高
- 阻礙互通性的OEM專用專有網路協定棧
- 產業價值鏈分析
- 監理情勢
- 技術展望
- 波特五力分析
- 對與市場相關的宏觀經濟趨勢進行評估
第5章 市場規模與成長預測
- 按協議/按技術
- 本地互連網路(LIN)
- 控制器區域網路(CAN 和 CAN-FD)
- FlexRay
- 汽車乙太網路(10 Mbps 至 10 Gbps)
- 媒體導向系統傳輸(MOST)
- 按車輛類型
- 搭乘用車
- 輕型商用車
- 大型商用車輛
- 非公路用車及特殊車輛
- 透過使用
- 動力傳動系統和底盤控制
- 安全/ADAS
- 資訊娛樂和車載資訊系統
- 身體控制和舒適度
- 自動駕駛的計算領域
- 按組件
- 收發器
- 控制器和閘道器
- 交換器和路由器
- 電纜和連接器
- 網路積體電路與物理層
- 按地區
- 北美洲
- 美國
- 加拿大
- 墨西哥
- 南美洲
- 巴西
- 阿根廷
- 其他南美國家
- 歐洲
- 德國
- 英國
- 法國
- 義大利
- 西班牙
- 其他歐洲國家
- 亞太地區
- 中國
- 日本
- 印度
- 韓國
- ASEAN
- 其他亞太國家
- 中東和非洲
- 中東
- 沙烏地阿拉伯
- 阿拉伯聯合大公國
- 土耳其
- 其他中東國家
- 非洲
- 南非
- 奈及利亞
- 其他非洲國家
- 中東
- 北美洲
第6章 競爭情勢
- 市場集中度
- 策略趨勢
- 市佔率分析
- 公司簡介
- NXP Semiconductors NV
- Robert Bosch GmbH
- Texas Instruments Incorporated
- Microchip Technology Inc.
- STMicroelectronics NV
- Broadcom Inc.
- Marvell Technology, Inc.
- Infineon Technologies AG
- ON Semiconductor Corporation
- Renesas Electronics Corporation
- Analog Devices, Inc.
- Realtek Semiconductor Corp.
- Rohm Co., Ltd.
- Melexis NV
- ON Semiconductor Corporation
- Molex LLC
- TE Connectivity Ltd.
- Aptiv PLC
- Continental AG
- Marvell Technology, Inc.
第7章 市場機會與未來展望
According to Mordor Intelligence, the in-vehicle networking market size was valued at USD 2.87 billion in 2025 and estimated to grow from USD 3.09 billion in 2026 to reach USD 4.51 billion by 2031, at a CAGR of 7.86% during the forecast period (2026-2031).
This report is Segmented by Protocol/Technology (Local Interconnect Network, Flexray, and More), Vehicle Type (Passenger Cars, Light Commercial Vehicles, and More), Application (Powertrain and Chassis Control, Safety and ADAS, Infotainment and Telematics, and More), Component (Transceivers, Controllers and Gateways, and More), and Geography. The Market Forecasts are Provided in Terms of Value (USD).
Global In-Vehicle Networking Market Trends and Insights
Vehicle Electrification and Escalating ADAS Bandwidth Needs
Battery-electric and plug-in hybrid platforms embed up to 40% more sensors than internal-combustion counterparts, producing several terabytes of raw data every hour. Legacy five-megabit-per-second CAN-FD links cannot move this volume efficiently, prompting widespread deployment of 100BASE-T1 and 1000BASE-T1 Ethernet for sensor fusion backhaul. Microcontroller vendors now integrate 10BASE-T1S low-speed Ethernet into edge nodes so inexpensive temperature and pressure sensors can feed zonal gateways, which then uplink aggregated traffic to gigabit trunks. Centralized architectures also slash wiring length, driving range gains for energy-dense battery packs. Over-the-air updates for perception software can exceed ten gigabytes per vehicle, a load that only gigabit Ethernet paired with 5G or satellite offload can manage. China's GB/T 32960 real-time telematics rule further boosts uplink demand, reinforcing Ethernet adoption.
OEM Migration from Domain to Zonal E and E Architecture
Traditional domain layouts required kilometers of harnesses and up to 100 controllers. Zonal topologies reposition compute into three to five regional gateways located near the physical loads, trimming cable weight by as much as 30% and reducing latency by eliminating inter-domain hops. Early production proof came from Volkswagen's China Electronic Architecture, which cut its controller count by 30% and halved software release cycles. Zonal gateways must bridge LIN, CAN-FD, FlexRay, and Ethernet while satisfying ISO 21434 cybersecurity and AUTOSAR Adaptive compatibility. Silicon that unifies 16 or more CAN channels with integrated TSN switches and hardware security modules is therefore in high demand.
Harness Weight and Cost Inflation Versus BOM Targets
Wiring looms weigh up to 80 kilograms in battery-electric models, adding drag on driving range. Early-2026 copper averaged USD 10,700 per tonne, and silver rose to USD 99 per ounce, inflating cable bills by nearly one-fifth. Moving from 400-volt to 800-volt architectures halves the conductor cross-section but requires higher-rated connectors that claw back some savings. Zonal integration cuts cable length by roughly one-quarter, yet it demands additional gateway silicon that pushes controller costs up more than one-third. Indian suppliers localizing under production-linked incentives face especially tight bill-of-materials limits.
Other drivers and restraints analyzed in the detailed report include:
- Adoption of Time-Sensitive Networking in Automotive Ethernet
- Infotainment and Telematics Feature Proliferation
- Cyber-Security Certification Complexity for Multi-Protocol Stacks
For complete list of drivers and restraints, kindly check the Table Of Contents.
Segment Analysis
CAN and CAN-FD maintained 36.89% of the in-vehicle networking market share in 2025 thanks to their low cost and entrenched use in powertrain and body-control loops. FlexRay, though a niche, is positioned for a 7.93% CAGR because steer-by-wire and brake-by-wire platforms need its deterministic dual-channel redundancy. Automotive Ethernet now scales from 10 megabits to 10 gigabits per second, so infotainment, ADAS, and centralized compute can coexist on one backbone, a shift formalized by IEEE 802.1DG-2025. LIN remains the sub-20-kilobit workhorse for seat, mirror, and lighting functions. MOST continues to decline as its 150-megabit ceiling cannot keep pace with 4K streaming demands.
Multi-protocol microcontrollers that integrate CAN-FD, LIN, and FlexRay reduce board count and shorten validation time as zonal gateways absorb body functions. Emerging CAN-XL raises single-frame payloads to 2,048 bytes, positioning itself as the bridge between legacy control loops and Ethernet tunnels. Secure 1000BASE-T1 PHYs with built-in MACsec and 1588 timestamping now reduce board area by up to 15% compared with discrete implementations. The in-vehicle networking market size attached to Ethernet PHYs will therefore outgrow node counts as the average price per port climbs.
In 2025, passenger cars accounted for 55.34% of total revenue, translating to an annual output of approximately 70 million units. While construction, agriculture, and mining machinery saw lower volumes, they are projected to experience a CAGR of 8.23%. This growth is driven by fleet owners increasingly seeking predictive maintenance and remote diagnostics, both of which necessitate Ethernet gateways. The rising adoption of advanced telematics systems and IoT integration in these machinery segments further supports this trend.
Light commercial vehicles benefit from passenger-car component commonality, allowing them to inherit gigabit backbones at minimal incremental cost. Heavy trucks must meet new automated steering regulations that make deterministic Ethernet mandatory. Off-highway designers adopt IP69K-rated CAN-to-Ethernet bridges so equipment can survive dust, vibration, and water jets. These trends keep the in-vehicle networking market size in the specialty-vehicle segment on a steeper slope than the overall base.
Geography Analysis
Asia-Pacific retained 43.78% of 2025 revenue, anchored by China's 27 million-unit passenger-car output and India's newly announced 300,000-unit plant that targets 75% NEV content localization. Platform rules under GB/T 32960 push every Chinese OEM toward Ethernet gateways with integrated 5G uplink, accelerating silicon volume. India's production-linked incentives are drawing network-component suppliers into local clusters, lowering tariff exposure and bolstering the regional in-vehicle networking market. Japan and South Korea concentrate on premium ADAS features, creating early demand for TSN hardware.
North America held roughly one-quarter of 2025 spending, supported by 11 million light-truck and SUV builds in the United States and export-oriented assembly in Mexico. Regulatory momentum for automated lane keeping and over-the-air cyber-secure updates sustains Ethernet penetration. Silicon Valley start-ups provide SDV middleware that reduces integration time for Detroit-area OEMs, supporting healthy investment in gateways and centralized compute. The United States Inflation Reduction Act spurs domestic battery and electronics supply, giving subsidies that indirectly boost the in-vehicle networking market.
Europe achieved a 20-22% share on the back of luxury and performance brands that lead in zonal topologies, centralized ADAS, and ISO 21434 certification. UN ECE rulemaking synchronizes safety and cybersecurity deadlines across member states, stimulating predictable rollout schedules for Ethernet and FlexRay upgrades. Eastern European plants leverage lower wage costs to assemble wiring harnesses and optical-fiber links, ensuring regional cost competitiveness. Middle East and Africa, although only a mid-single-digit base today, is tracking toward an 8.94% CAGR through 2031 as smart-city megaprojects mandate vehicle-to-infrastructure connectivity. South America benefits from Mercosur rules that reduce import duties on localized CAN-FD and Ethernet components, but macro volatility tempers absolute market size growth.
- NXP Semiconductors N.V.
- Robert Bosch GmbH
- Texas Instruments Incorporated
- Microchip Technology Inc.
- STMicroelectronics N.V.
- Broadcom Inc.
- Marvell Technology, Inc.
- Infineon Technologies AG
- ON Semiconductor Corporation
- Renesas Electronics Corporation
- Analog Devices, Inc.
- Realtek Semiconductor Corp.
- Rohm Co., Ltd.
- Melexis N.V.
- ON Semiconductor Corporation
- Molex LLC
- TE Connectivity Ltd.
- Aptiv PLC
- Continental AG
- Marvell Technology, Inc.
Additional Benefits:
- The market estimate (ME) sheet in Excel format
- 3 months of analyst support
TABLE OF CONTENTS
1 INTRODUCTION
- 1.1 Study Assumptions and Market Definition
- 1.2 Scope of the Study
2 RESEARCH METHODOLOGY
3 EXECUTIVE SUMMARY
4 MARKET LANDSCAPE
- 4.1 Market Overview
- 4.2 Market Drivers
- 4.2.1 Vehicle Electrification and Escalating ADAS Bandwidth Needs
- 4.2.2 Infotainment/Telematics Feature Proliferation
- 4.2.3 Regulatory Mandates for Advanced Safety Networks
- 4.2.4 OEM Migration from Domain to Zonal E/E Architecture
- 4.2.5 China's NEV Platform Standardisation Pressure
- 4.2.6 Adoption of Time-Sensitive Networking (TSN) in Automotive Ethernet
- 4.3 Market Restraints
- 4.3.1 Harness Weight and Cost Inflation Versus BOM Targets
- 4.3.2 Cyber-Security Certification Complexity for Multi-Protocol Stacks
- 4.3.3 Thermal/EMC Integrity Limits at >=1 Gbps
- 4.3.4 OEM-Specific Proprietary Network Stacks Hindering Interoperability
- 4.4 Industry Value Chain Analysis
- 4.5 Regulatory Landscape
- 4.6 Technological Outlook
- 4.7 Porter's Five Forces Analysis
- 4.7.1 Bargaining Power of Suppliers
- 4.7.2 Bargaining Power of Buyers
- 4.7.3 Threat of New Entrants
- 4.7.4 Threat of Substitutes
- 4.7.5 Intensity of Competitive Rivalry
- 4.8 Assessment of Macroeconomic Trends on the Market
5 MARKET SIZE AND GROWTH FORECASTS (VALUE)
- 5.1 By Protocol / Technology
- 5.1.1 Local Interconnect Network (LIN)
- 5.1.2 Controller Area Network (CAN and CAN-FD)
- 5.1.3 FlexRay
- 5.1.4 Automotive Ethernet (10 Mbps - 10 Gbps)
- 5.1.5 Media Oriented Systems Transport (MOST)
- 5.2 By Vehicle Type
- 5.2.1 Passenger Cars
- 5.2.2 Light Commercial Vehicles
- 5.2.3 Heavy Commercial Vehicles
- 5.2.4 Off-Highway and Specialized Vehicles
- 5.3 By Application
- 5.3.1 Powertrain and Chassis Control
- 5.3.2 Safety and ADAS
- 5.3.3 Infotainment and Telematics
- 5.3.4 Body Control and Comfort
- 5.3.5 Autonomous Driving Compute Domains
- 5.4 By Component
- 5.4.1 Transceivers
- 5.4.2 Controllers and Gateways
- 5.4.3 Switches and Routers
- 5.4.4 Cabling and Connectors
- 5.4.5 Network ICs and PHYs
- 5.5 By Geography
- 5.5.1 North America
- 5.5.1.1 United States
- 5.5.1.2 Canada
- 5.5.1.3 Mexico
- 5.5.2 South America
- 5.5.2.1 Brazil
- 5.5.2.2 Argentina
- 5.5.2.3 Rest of South America
- 5.5.3 Europe
- 5.5.3.1 Germany
- 5.5.3.2 United Kingdom
- 5.5.3.3 France
- 5.5.3.4 Italy
- 5.5.3.5 Spain
- 5.5.3.6 Rest of Europe
- 5.5.4 Asia-Pacific
- 5.5.4.1 China
- 5.5.4.2 Japan
- 5.5.4.3 India
- 5.5.4.4 South Korea
- 5.5.4.5 ASEAN
- 5.5.4.6 Rest of Asia-Pacific
- 5.5.5 Middle East and Africa
- 5.5.5.1 Middle East
- 5.5.5.1.1 Saudi Arabia
- 5.5.5.1.2 United Arab Emirates
- 5.5.5.1.3 Turkey
- 5.5.5.1.4 Rest of the Middle East
- 5.5.5.2 Africa
- 5.5.5.2.1 South Africa
- 5.5.5.2.2 Nigeria
- 5.5.5.2.3 Rest of Africa
- 5.5.5.1 Middle East
- 5.5.1 North America
6 COMPETITIVE LANDSCAPE
- 6.1 Market Concentration
- 6.2 Strategic Moves
- 6.3 Market Share Analysis
- 6.4 Company Profiles (includes Global level Overview, Market level overview, Core Segments, Financials as available, Strategic Information, Market Rank/Share for key companies, Products and Services, and Recent Developments)
- 6.4.1 NXP Semiconductors N.V.
- 6.4.2 Robert Bosch GmbH
- 6.4.3 Texas Instruments Incorporated
- 6.4.4 Microchip Technology Inc.
- 6.4.5 STMicroelectronics N.V.
- 6.4.6 Broadcom Inc.
- 6.4.7 Marvell Technology, Inc.
- 6.4.8 Infineon Technologies AG
- 6.4.9 ON Semiconductor Corporation
- 6.4.10 Renesas Electronics Corporation
- 6.4.11 Analog Devices, Inc.
- 6.4.12 Realtek Semiconductor Corp.
- 6.4.13 Rohm Co., Ltd.
- 6.4.14 Melexis N.V.
- 6.4.15 ON Semiconductor Corporation
- 6.4.16 Molex LLC
- 6.4.17 TE Connectivity Ltd.
- 6.4.18 Aptiv PLC
- 6.4.19 Continental AG
- 6.4.20 Marvell Technology, Inc.
7 MARKET OPPORTUNITIES AND FUTURE OUTLOOK
- 7.1 White-space and Unmet-Need Assessment
 2026年全球控制器區域網路匯流排和物聯網閘道市場報告2026年全球光纖汽車網路市場報告
 下一代汽車網路市場:2026-2032年全球市場預測(按網路技術、連接方式、車輛類型、應用程式和最終用戶分類)
 汽車光纖通訊(光纖乙太網路、PON)和供應鏈(2026 年)2026年下一代汽車網路(IVN)全球市場報告2026年全球車載網路市場報告2026年全球車輛連網市場報告
 智慧車聯網系統市場預測:至2034年:按車輛類型、組件、技術、應用和地區分類的全球分析CAN匯流排介面模組市場按類型、資料速率、組件、應用和最終用戶分類,全球預測,2026-2032年CAN總線顯示器市場按車輛類型、顯示技術、連接類型、分銷管道和應用分類-全球預測,2026-2032年