


 |
市場調查報告書
商品編碼
2062458
金屬氧化物壓敏電阻:市佔率分析、產業趨勢與統計、成長預測(2026-2031)Metal Oxide Varistors - Market Share Analysis, Industry Trends & Statistics, Growth Forecasts (2026 - 2031) |
||||||

※ 本網頁內容可能與最新版本有所差異。詳細情況請與我們聯繫。
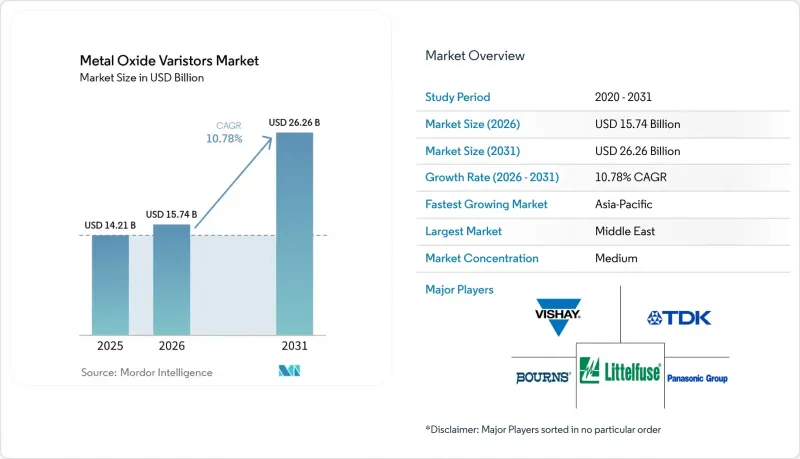
根據 Mordor Intelligence 預測,金屬氧化物壓敏電阻 (MOV) 市場規模將從 2025 年的 142.1 億美元和 2026 年的 157.4 億美元成長到 2031 年的 262.6 億美元,2026 年至 2031 年的年複合成長率(CAGR)為 10.78%。
本報告依產品類型(圓盤型MOV、表面黏著技術MOV、條形/塊狀MOV等)、額定電壓(低電壓≤230V、中壓230-1000V、其他)、終端用戶產業(家用電子電器、工業設備、其他)、應用(突波保護裝置、線路電壓保護、汽車、其他產業)和地區進行電子。市場預測以美元(USD)為單位。
全球金屬氧化物壓敏電阻市場趨勢及洞察
電動車充電基礎設施的快速擴張
2024年,全球公共電動車充電樁的數量將超過500萬個,IEC 61851-23:2023標準強制要求直流側突波保護裝置具備2.5 kV的保護等級。這些法規推動了1型和2型協同式架構的發展,這些架構在交流輸入端結合了金屬氧化物壓敏電阻(MOV)和氣體放電管,並在輸出端配備了專用的基於MOV的直流避雷器。此外,IEEE Std C62.230-2022標準規定了高達1500 V直流的保護能力,並建議採用高能量MOV吸收方案,而非僅使用半導體方案。現場可靠性至關重要,46%的快速充電用戶報告稱,充電樁因電氣故障而停機,充電樁故障造成的維修成本和收入損失總計可能超過4萬美元。組件製造商正在採取措施應對這一問題。 Raycap 的「2025 ProTec T2 DCGU 3Y」提供 1,000 V 和 1,500 V 相容的插入式模組,額定電流為 100 kA,標誌著向高壓、可維護 MOV 平台的過渡。
智慧家庭廣泛採用突波保護
目前,美國家庭平均安裝了約30台連網設備,而美國國家電氣規範2023版第230.67條規定,所有住宅供電入口都必須安裝突波保護裝置可有效保護整個住宅免受雷擊和電網波動的影響。過去十年間,這兩種設備的需求量分別增加了18%和17%。像Mersen這樣的製造商正在擴展其高階產品線,計劃在2025年推出75kA的住宅專用浪湧保護裝置,這些裝置整合了熱斷開式MOV核心、遠端狀態指示燈和連網設備保固服務,從而推高了平均售價。由於供應仍然緊張,符合AEC-Q200標準的MOV晶片的前置作業時間在某些額定值下已延長至九個月,迫使建築商和安裝商提前備貨。像Weidmuller的「VARITECTOR PU IoT AC」這樣的物聯網突波保護裝置能夠將過電壓事件即時傳輸到雲端控制面板,使住宅能夠在故障發生前安排更換。
氧化鋅原料價格波動
氧化鋅是金屬氧化物壓敏電阻(MOV)的功能性陶瓷基板,原料成本飆升可能導致季度利潤大幅縮水。預計2025年下半年現貨價格將在每公斤3.11美元至3.46美元之間波動,比疫情前水準高出約25%。財務基礎較弱的小規模亞洲供應商難以進行對沖,一些供應商不得不限制交付或收取附加費。同時,大型供應商的垂直整合在一定程度上抵消了價格波動的影響,多家公司簽訂了多年礦石供應契約,並投資於窯爐廢料的閉合迴路回收利用。
細分市場分析
到2025年,圓盤型裝置將在金屬氧化物壓敏電阻市場佔據39.43%的最大佔有率,憑藉其在進線和消費性電子產品突波保護器中的高能量阻隔性能而確立市場地位。然而,隨著汽車和通訊電路基板轉向回流焊接元件,表面黏著技術元件預計將呈現最高的成長率,到2031年複合年成長率將達到11.58%。這種轉變在獲得AEC-Q200認證的多層產品中尤其明顯,與徑向引線裝置相比,其安裝時間縮短了一半。帶狀和塊狀結構在保護電力變壓器和鐵路驅動裝置方面仍然發揮著至關重要的作用,這些應用通常涉及數十千安/脈衝的電流,但就整體市場價值而言,它們僅佔一小部分佔有率。其他類型的壓敏電阻,例如環形壓敏電阻,則用於特殊的電纜纏繞應用,並在不改變市場結構的情況下保持適度的需求。
在預測期內,隨著原始設備製造商 (OEM) 在基板級整合保護功能,並將表面黏著技術金屬氧化物壓敏電阻 (MOV) 整合到電源控制器附近以符合 ISO 7637 和 IEC 61000-4-5 標準,表面貼裝式 MOV 的市場規模將擴大。多層陶瓷層數的增加可使焦耳容量提高約 30%,縮小與 14 毫米圓盤式壓敏電阻的差距,同時保持亞奈秒的響應速度。圓盤式裝置在價格敏感的白色家電和 UPS 設計中仍然佔據主導地位,這些產品通常採用通孔安裝。供應商透過添加聚合物熱熔斷器和三防膠來區分圓盤式組件,以延長其在潮濕環境下的使用壽命。兩種規格的共存確保製造商擁有均衡的產品系列,並可根據直徑和層高靈活選擇陶瓷燒結爐。
到2025年,電壓範圍在230V至1000V的中壓裝置將佔據金屬氧化物壓敏電阻(MOV)市場44.59%的佔有率,這反映了它們適用於住宅單相和商業三相電源。電壓高於1000V的高壓元件由800V牽引電池和1500V太陽能組串驅動,其複合年成長率(CAGR)高達11.38%,位居業界之首。低壓MOV在消費基板和資料連接埠中仍然至關重要,但面臨矽TVS二極體的直接競爭。目前的產品藍圖關注可整合到直流快速充電器輸出級且無額定壓降的1500V連續工作模組。現場可更換的組件使操作人員在維護期間無需關閉整個機櫃。
隨著可再生能源裝置容量的擴張,電力公司正在指定使用高壓MOV-GDT混合裝置以滿足IEC 61643-41瞬態過電壓測試標準,市場需求正朝著峰值成長邁進。因此,儘管高壓MOV的絕對出貨量低於中壓產品,但其市場規模的成長速度仍高於整體市場平均值。製造商正在改進工作溫度低於180 度C的熱關斷機制,以防止在長時間故障的情況下發生災難性破裂。同時,中壓產品也在逐步改進,例如整合雷射標記的可追溯性程式碼和物聯網連接點,以便與智慧面板生態系統整合。低壓MOV持續應用於LED驅動器和筆記型電腦轉接器等設計目標為2kA單脈衝的應用,但其銷售成長仍較為緩慢。
區域分析
亞太地區是金屬氧化物壓敏電阻市場的主要驅動力,預計到2025年將佔全球銷售額的38.48%,複合年成長率(CAGR)為11.69%。中國關鍵零件70%國產化的政策目標正在推動合資企業的發展,而印度的「電子元件製造計畫」規模擴大至4000億印度盧比(約48億美元),已吸引了超過139億美元的投資承諾。在地化生產能力降低了物流風險,但也凸顯了仿冒品的風險。事實上,43%的工廠在搬遷生產基地後的六個月內報告了可疑零件。
北美市場依然至關重要,這主要得益於美國相關法規以及電動車(EV)產業的快速發展。 《晶片和積體電路法案》(CHIPS Act)撥款520億美元用於獎勵,在促進被動元件的國內生產和減少對進口的依賴方面發揮關鍵作用。此外,301條款關稅的實施將顯著影響從中國進口的金屬氧化物壓敏電阻(MOV)的成本,預計2025年後其價格將翻倍。這促使分銷商實現供應鏈多元化,以降低風險並有效控制成本。同時,加拿大和墨西哥的1型突波保護器(SPD)安裝量正在增加,尤其是在風力發電場和資料中心。這些安裝主要集中在雷電頻傳的草原地區,在這些地區,強大的突波保護對於確保基礎設施的可靠性和安全性至關重要。
在歐洲,EN 61643 標準下嚴格的電磁相容性法規以及對可再生能源的大力發展,為突波保護提供了強勁的推動力。在德國和法國,1500V 太陽能電池陣列的直流母線保護正在加速普及;而在英國,除非提交正式的風險豁免申請,否則電動車充電電路必須安裝浪湧保護器 (SPD)。區域性電力線路地下化工程降低了雷擊風險,同時也增加了對連網突波記錄的需求,以支援資產健康審計。在南美洲,受巴西太陽能發電設施的成長以及墨西哥汽車組裝叢集對符合 AEC-Q200 標準的金屬氧化物壓敏電阻 (MOV) 的需求推動,市場正在穩步擴張。在中東和非洲,電力公司和石油設施正在實施突波保護,阿拉伯聯合大公國正在推動一項智慧電網試點項目,該項目將物聯網狀態信標整合到浪湧保護器中。
其他好處:
- Excel格式的市場預測(ME)表
- 3個月的分析師支持
目錄
第1章:引言
- 研究假設和市場定義
- 調查範圍
第2章:調查方法
第3章執行摘要
第4章 市場狀況
- 市場概覽
- 市場促進因素
- 電動車充電基礎設施的快速普及
- 智慧家庭中廣泛採用突波保護裝置。
- 部署 5G 網路需要強大的突波抑制能力。
- 工業IoT在惡劣電力環境中的擴展
- 改善開發中國家電網邊緣電能品質的努力
- 保險公司主導的商業建築強制防雷措施
- 市場限制因素
- 氧化鋅原料價格波動
- 峰值能量處理中小型化的局限性
- 暫態電壓抑制器(TVS二極體)所帶來的替代品威脅
- 灰色市場供應鏈中的假零件
- 宏觀經濟因素對市場的影響
- 產業價值鏈分析
- 監理情勢
- 技術展望
- 波特五力分析
第5章 市場規模與成長預測
- 依產品類型
- Disc MOV
- 表面黏著技術元件(SMD/晶片)MOV
- 皮帶/塊狀 MOV
- 其他產品類型
- 按額定電壓
- 低電壓(230伏特或以下)
- 中型(230 至 1,000 伏特)
- 高電壓(1000伏特或以上)
- 按最終用戶行業分類
- 家用電子產品
- 工業設備
- 車
- 能源與電力
- 電訊
- 其他終端用戶產業
- 透過使用
- 突波保護裝置(SPD)
- 線路電壓保護
- 汽車電子
- 工業電力電子
- 其他用途
- 按地區
- 北美洲
- 美國
- 加拿大
- 墨西哥
- 南美洲
- 巴西
- 阿根廷
- 其他南美國家
- 歐洲
- 英國
- 德國
- 法國
- 義大利
- 西班牙
- 其他歐洲國家
- 亞太地區
- 中國
- 日本
- 印度
- 韓國
- 其他亞太國家
- 中東和非洲
- 中東
- 阿拉伯聯合大公國
- 沙烏地阿拉伯
- 其他中東國家
- 非洲
- 南非
- 埃及
- 其他非洲國家
- 中東
- 北美洲
第6章 競爭情勢
- 市場集中度
- 策略趨勢
- 市佔率分析
- 公司簡介
- TDK Corporation
- Vishay Intertechnology Inc.
- Panasonic Holdings Corporation
- Littelfuse Inc.
- Eaton Corporation plc
- Bourns Inc.
- Murata Manufacturing Co. Ltd.
- KOA Corporation
- KEMET(Yageo Corporation)
- Schneider Electric SE
- TE Connectivity Ltd.
- Honeywell International Inc.
- Amotech Co. Ltd.
- Dean Technology Inc.
- Epcos India Pvt. Ltd.
- Shenzhen MOV Electronics Co. Ltd.
- Nippon Chemi-Con Corporation
- Metrosil(M&I Materials Ltd.)
- General Electric Company
- ON Semiconductor Corporation
第7章 市場機會與未來展望
According to Mordor Intelligence, the metal oxide varistors market size is projected to expand from USD 14.21 billion in 2025 and USD 15.74 billion in 2026 to USD 26.26 billion by 2031, registering a CAGR of 10.78% between 2026 to 2031.
This report is Segmented by Product Type (Disc MOV, Surface-Mount MOV, Strap/Block MOV, and More), Voltage Rating (Low <=230 V, Medium 230-1000 V, and More), End-User Industry (Consumer Electronics, Industrial Equipment, and More), Application (Surge-Protective Devices, Line-Voltage Protection, Automotive Electronics, and More), and Geography. The Market Forecasts are Provided in Terms of Value (USD).
Global Metal Oxide Varistors Market Trends and Insights
Rapid Proliferation Of Electric Vehicle Charging Infrastructure
Global public EV chargers exceeded 5 million units in 2024, and IEC 61851-23:2023 now mandates DC-side surge-protective devices with a 2.5 kV protection level. These rules push coordinated Type 1 and Type 2 architectures that pair MOVs with gas-discharge tubes at AC inputs and dedicated MOV-based DC arresters at outputs. IEEE Std C62.230-2022 further codifies protection up to 1,500 V DC, favoring high-energy MOV absorption over semiconductor-only options. Field reliability matters, 46% of fast-charge users cite downtime linked to electrical faults, and a failed charger can cost more than USD 40,000 in repair and lost revenue. Component makers responded; Raycap's 2025 ProTec T2 DCGU 3Y provides pluggable 1,000 V and 1,500 V modules rated to 100 kA, illustrating the shift to high-voltage, serviceable MOV platforms.
Heightened Adoption of Smart Home Surge Protection
Homes now host roughly 30 connected devices, and NEC 2023 Article 230.67 requires surge protection on all U.S. dwelling service entrances. Whole-house MOV-based devices mitigate lightning strikes and grid fluctuations, which increased by 18% and 17%, respectively, over the past decade. Makers such as Mersen expanded premium lines in 2025 with 75 kA residential units that bundle thermal-disconnect MOV cores, remote status LEDs, and connected-equipment warranties, pushing average selling prices higher. Supply tension persists; however, lead times for AEC-Q200-grade MOV chips lengthened to nine months for select values, forcing builders and installers to pre-stock. IoT-enabled SPDs, such as Weidmuller's VARITECTOR PU IoT AC, now stream overvoltage events to cloud dashboards, allowing homeowners to schedule replacements before failure.
Volatility In Zinc Oxide Raw-Material Prices
Zinc oxide is the functional ceramic base of an MOV, and feedstock cost spikes can wipe out quarterly margins. Spot prices ranged between USD 3.11 kg and USD 3.46 kg during late 2025, roughly 25% above pre-pandemic norms. Smaller Asian suppliers with thin balance sheets struggle to hedge, prompting some to ration deliveries or impose surcharges. Vertical integration by top-tier vendors partially offsets volatility; several negotiated multi-year ore contracts and invested in closed-loop recycling of kiln scrap.
Other drivers and restraints analyzed in the detailed report include:
- 5G Network Roll-Outs Requiring Robust Surge Suppression
- Industrial IoT Expansion In Harsh-Power Environments
- Miniaturization Limits On Peak Energy Handling
For complete list of drivers and restraints, kindly check the Table Of Contents.
Segment Analysis
Disc devices retained the largest 39.43% slice of the metal oxide varistors market share in 2025, a position secured by their high-energy handling in service-entrance and appliance surge protectors. Surface-mount variants, however, deliver the fastest 11.58% CAGR through 2031 as automotive and telecom boards migrate to reflow-solderable components. This shift is evident in AEC-Q200-qualified multilayer offerings that halve placement time compared to radial leads. Strap-and-block formats continue to shield utility transformers and rail drives, where tens of kiloamperes per impulse are common, but they represent a niche in overall value terms. Other geometries such as ring MOVs occupy specialty cable-wrap roles, sustaining moderate demand without altering the hierarchy.
Over the forecast horizon, the metal oxide varistors market size for surface-mount parts expands as OEMs consolidate protection at the board level, embedding miniaturized MOVs next to power controllers to meet ISO 7637 and IEC 61000-4-5. Higher layer counts in multilayer ceramics increase joule capacity by roughly 30%, closing the gap with 14 mm discs while preserving sub-nanosecond response. Disc devices still dominate price-sensitive white goods and UPS designs, where through-hole assembly remains prevalent. Suppliers differentiate by adding polymer thermal fuses and conformal coatings to disc parts, extending cycle life in damp environments. The coexistence of both formats ensures a balanced portfolio for manufacturers that can flex ceramic kilns across diameters and stack heights.
Medium-voltage devices between 230 V and 1,000 V captured 44.59% of the 2025 metal oxide varistors market share, reflecting their fit with residential split-phase and three-phase commercial mains. High-voltage parts above 1,000 V post the leading 11.38% CAGR, fueled by 800 V traction batteries and 1,500 V photovoltaic strings. Low-voltage MOVs remain essential on consumer boards and data ports yet face direct competition from silicon TVS diodes. Product roadmaps now emphasize 1,500 V continuous-operation modules that slot into DC fast-charger output stages without derating. Field-replaceable cartridges help operators avoid full-cabinet shutdowns during maintenance.
As renewable-energy capacity scales, utilities specify high-voltage MOV-GDT hybrids to satisfy IEC 61643-41 temporary-overvoltage tests, pulling demand toward the top end of the curve. The metal oxide varistor market size, linked to high-voltage ratings, therefore grows faster than the overall average, even though absolute unit volumes remain lower than on medium-voltage lines. Manufacturers are improving thermal disconnect mechanisms that trip below 180 °C, preventing catastrophic rupture under sustained faults. Meanwhile, medium-voltage products receive incremental updates, laser-marked traceability codes, and IoT contact points that lock them into smart-panel ecosystems. Low-voltage MOVs will persist in LED drivers and laptop adapters where a single 2 kA pulse is the design target, but volume uplift remains modest.
Geography Analysis
Asia-Pacific leads the metal oxide varistors market, accounting for 38.48% of revenue in 2025 and an 11.69% CAGR outlook. China's policy goal of 70% domestic content in core components fuels joint ventures, while India's Electronics Components Manufacturing Scheme, expanded to INR 400 billion (USD 4.8 billion), has attracted pledged investments topping USD 13.9 billion. Local capacity reduces logistics risk but surfaces counterfeit exposure, as 43% of relocated plants reported suspect parts within six months of moving production.
North America follows as a significant market, driven by U.S. code mandates and the rapid expansion of the electric vehicle (EV) industry. The CHIPS Act, which allocates USD 52 billion in incentives, is playing a crucial role in encouraging domestic fabrication of passive components and reducing reliance on imports. Additionally, the implementation of Section 301 tariffs has significantly impacted the cost of Metal Oxide Varistors (MOVs) imported from China, effectively doubling their prices starting in 2025. This has prompted distributors to diversify their supply chains to mitigate risks and manage costs effectively. Meanwhile, Canada and Mexico are witnessing increased installations of Type 1 Surge Protective Devices (SPDs), particularly on wind farms and data centers. These installations are concentrated in lightning-prone prairie corridors, where the need for robust surge protection is critical to ensure the reliability and safety of infrastructure in these regions.
Europe benefits from stringent EMC rules under EN 61643 and the push toward renewable energy. Germany and France accelerate DC bus protection in 1,500 V solar arrays, while the United Kingdom requires SPDs on EV charger circuits unless a formal risk exemption is filed. Regional initiatives to underground distribution lines dampen lightning exposure but heighten demand for networked surge logging to support asset-health audits. South America expands steadily, led by Brazil's solar build-out and Mexico's automotive assembly clusters that source AEC-Q200 MOVs.The Middle East and Africa are adopting surge protection in utility and oil installations; the United Arab Emirates is promoting smart-grid pilots that instrument SPDs with IoT status beacons.
- TDK Corporation
- Vishay Intertechnology Inc.
- Panasonic Holdings Corporation
- Littelfuse Inc.
- Eaton Corporation plc
- Bourns Inc.
- Murata Manufacturing Co. Ltd.
- KOA Corporation
- KEMET (Yageo Corporation)
- Schneider Electric SE
- TE Connectivity Ltd.
- Honeywell International Inc.
- Amotech Co. Ltd.
- Dean Technology Inc.
- Epcos India Pvt. Ltd.
- Shenzhen MOV Electronics Co. Ltd.
- Nippon Chemi-Con Corporation
- Metrosil (M&I Materials Ltd.)
- General Electric Company
- ON Semiconductor Corporation
Additional Benefits:
- The market estimate (ME) sheet in Excel format
- 3 months of analyst support
TABLE OF CONTENTS
1 INTRODUCTION
- 1.1 Study Assumptions and Market Definition
- 1.2 Scope of the Study
2 RESEARCH METHODOLOGY
3 EXECUTIVE SUMMARY
4 MARKET LANDSCAPE
- 4.1 Market Overview
- 4.2 Market Drivers
- 4.2.1 Rapid Proliferation of Electric Vehicle Charging Infrastructure
- 4.2.2 Heightened Adoption of Smart Home Surge Protection
- 4.2.3 5G Network Roll-outs Requiring Robust Surge Suppression
- 4.2.4 Industrial IoT Expansion in Harsh-Power Environments
- 4.2.5 Grid-Edge Power Quality Initiatives in Developing Economies
- 4.2.6 Insurance-Driven Mandates for Lightning Protection in Commercial Buildings
- 4.3 Market Restraints
- 4.3.1 Volatility in Zinc Oxide Raw-Material Prices
- 4.3.2 Miniaturization Limits on Peak Energy Handling
- 4.3.3 Substitution Threat from Transient Voltage Suppressors (TVS Diodes)
- 4.3.4 Counterfeit Components in Gray-Market Supply Chains
- 4.4 Impact of Macroeconomic Factors on the Market
- 4.5 Industry Value Chain Analysis
- 4.6 Regulatory Landscape
- 4.7 Technological Outlook
- 4.8 Porter's Five Forces Analysis
- 4.8.1 Bargaining Power of Suppliers
- 4.8.2 Bargaining Power of Buyers
- 4.8.3 Threat of New Entrants
- 4.8.4 Threat of Substitutes
- 4.8.5 Intensity of Competitive Rivalry
5 MARKET SIZE AND GROWTH FORECASTS (VALUE)
- 5.1 By Product Type
- 5.1.1 Disc MOV
- 5.1.2 Surface-Mount (SMD/Chip) MOV
- 5.1.3 Strap / Block MOV
- 5.1.4 Other Product Types
- 5.2 By Voltage Rating
- 5.2.1 Low (<=230 V)
- 5.2.2 Medium (230 - 1,000 V)
- 5.2.3 High (Above 1,000 V)
- 5.3 By End-User Industry
- 5.3.1 Consumer Electronics
- 5.3.2 Industrial Equipment
- 5.3.3 Automotive
- 5.3.4 Energy and Power
- 5.3.5 Telecommunications
- 5.3.6 Other End-User Industries
- 5.4 By Application
- 5.4.1 Surge-Protective Devices (SPDs)
- 5.4.2 Line-Voltage Protection
- 5.4.3 Automotive Electronics
- 5.4.4 Industrial Power Electronics
- 5.4.5 Other Applications
- 5.5 By Geography
- 5.5.1 North America
- 5.5.1.1 United States
- 5.5.1.2 Canada
- 5.5.1.3 Mexico
- 5.5.2 South America
- 5.5.2.1 Brazil
- 5.5.2.2 Argentina
- 5.5.2.3 Rest of South America
- 5.5.3 Europe
- 5.5.3.1 United Kingdom
- 5.5.3.2 Germany
- 5.5.3.3 France
- 5.5.3.4 Italy
- 5.5.3.5 Spain
- 5.5.3.6 Rest of Europe
- 5.5.4 Asia-Pacific
- 5.5.4.1 China
- 5.5.4.2 Japan
- 5.5.4.3 India
- 5.5.4.4 South Korea
- 5.5.4.5 Rest of Asia-Pacific
- 5.5.5 Middle East and Africa
- 5.5.5.1 Middle East
- 5.5.5.1.1 United Arab Emirates
- 5.5.5.1.2 Saudi Arabia
- 5.5.5.1.3 Rest of Middle East
- 5.5.5.2 Africa
- 5.5.5.2.1 South Africa
- 5.5.5.2.2 Egypt
- 5.5.5.2.3 Rest of Africa
- 5.5.5.1 Middle East
- 5.5.1 North America
6 COMPETITIVE LANDSCAPE
- 6.1 Market Concentration
- 6.2 Strategic Moves
- 6.3 Market Share Analysis
- 6.4 Company Profiles (includes Global Level Overview, Market Level Overview, Core Segments, Financials as available, Strategic Information, Market Rank/Share, Products and Services, Recent Developments)
- 6.4.1 TDK Corporation
- 6.4.2 Vishay Intertechnology Inc.
- 6.4.3 Panasonic Holdings Corporation
- 6.4.4 Littelfuse Inc.
- 6.4.5 Eaton Corporation plc
- 6.4.6 Bourns Inc.
- 6.4.7 Murata Manufacturing Co. Ltd.
- 6.4.8 KOA Corporation
- 6.4.9 KEMET (Yageo Corporation)
- 6.4.10 Schneider Electric SE
- 6.4.11 TE Connectivity Ltd.
- 6.4.12 Honeywell International Inc.
- 6.4.13 Amotech Co. Ltd.
- 6.4.14 Dean Technology Inc.
- 6.4.15 Epcos India Pvt. Ltd.
- 6.4.16 Shenzhen MOV Electronics Co. Ltd.
- 6.4.17 Nippon Chemi-Con Corporation
- 6.4.18 Metrosil (M&I Materials Ltd.)
- 6.4.19 General Electric Company
- 6.4.20 ON Semiconductor Corporation
7 MARKET OPPORTUNITIES AND FUTURE OUTLOOK
- 7.1 White-Space and Unmet-Need Assessment

 金屬氧化物壓敏電阻市場-2026-2032年全球市場預測
 金屬氧化物壓敏電阻市場報告:趨勢、預測及競爭分析(至2035年)
 全球金屬氧化物壓敏電阻市場規模、佔有率、趨勢和成長分析報告(2026-2034年)
 金屬氧化物壓敏電阻市場 - 全球產業規模、佔有率、趨勢、競爭格局、機會及預測(按類型、最終用戶、結構、銷售管道、地區和競爭格局分類),2021-2031年金屬氧化物晶片壓敏電阻市場報告:2031 年趨勢、預測與競爭分析金屬氧化物壓敏電阻(MOV)市場:依產品類型、額定電壓、元件配置、應用、最終用戶、國家及地區分類-全球產業分析、市場規模、市場佔有率及2025-2032年預測
 全球片狀金屬氧化物壓敏電阻市場
![金屬氧化物壓敏電阻 (MOV) 市場 - [類型:單晶片、陣列;電壓範圍:18V - 50V、51V - 100、101V - 200V、201V - 300V、301V - 400V、400V 及以上] - 全球產業分析、預測規模](/sample/img/cover/42/default_cover_6.png) 金屬氧化物壓敏電阻 (MOV) 市場 - [類型:單晶片、陣列;電壓範圍:18V - 50V、51V - 100、101V - 200V、201V - 300V、301V - 400V、400V 及以上] - 全球產業分析、預測規模
金屬氧化物壓敏電阻 (MOV) 市場 - [類型:單晶片、陣列;電壓範圍:18V - 50V、51V - 100、101V - 200V、201V - 300V、301V - 400V、400V 及以上] - 全球產業分析、預測規模