


 |
市場調查報告書
商品編碼
2062444
智慧互聯資產管理:市場佔有率分析、產業趨勢與統計、成長預測(2026-2031)Smart Connected Assets And Operations - Market Share Analysis, Industry Trends & Statistics, Growth Forecasts (2026 - 2031) |
||||||
※ 本網頁內容可能與最新版本有所差異。詳細情況請與我們聯繫。
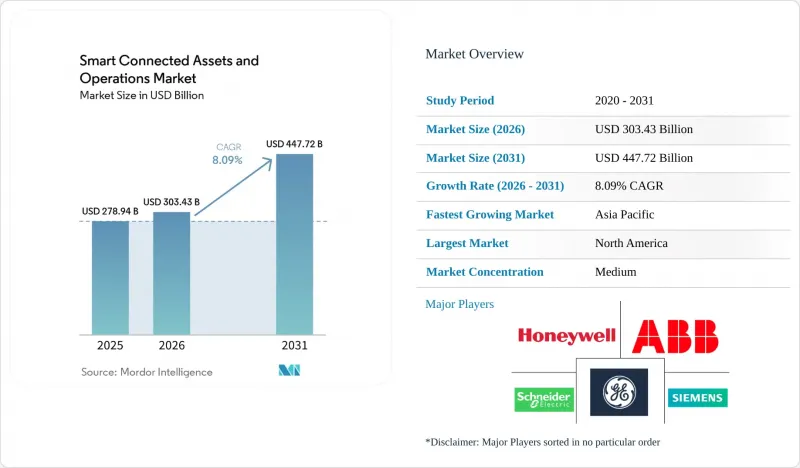
據 Mordor Intelligence 稱,2025 年智慧互聯資產和管理市場價值為 2,789.4 億美元,預計到 2031 年將達到 4477.2 億美元,而 2026 年為 3034.3 億美元,2026 年至 2031 年的年複合成長率(CAGR)。
本報告按組件(硬體、軟體、服務)、連接技術(有線、無線、衛星)、部署模式(本地部署、雲端部署、混合部署)、產業(製造業、能源和公共產業、石油和天然氣、採礦業、運輸和物流、醫療保健等)以及地區進行細分。市場預測以美元計價。
全球智慧互聯資產及投資市場趨勢及洞察
具有整合資產績效管理功能的工業IoT平台正快速普及。
全球製造商正將各種工具整合到一個統一的工業IoT平台中,該平台將感測器資料、歷史日誌和企業記錄聚合到一個預測性維護儀表板中。亞馬遜網路服務 (AWS) 於 2025 年發布了 SiteWise Edge,實現了亞毫秒的本地延遲,同時將匯總資料與雲端同步。這種設計將控制網路與公共流量隔離。根據 PTC 提交的 2025 年投資者報告,ThingWorx 的採用率同比成長了 40%,汽車零件供應商表示,CAD 和 PLM 的緊密整合將根本原因分析的時間從幾天縮短到了數小時。羅克韋爾自動化公司報告稱,其訂閱軟體收入在 2025 年將超過 10 億美元,這主要得益於其 FactoryTalk Hub,該平台連接了全球超過 50 萬台設備。 GE Digital 將 Predix 重新定位為一個水平層,現在正與各領域的專家合作,為風電場和發電廠提供承包最佳化解決方案,將渦輪機的檢查週期延長了多達 20%。
為了最大限度地減少停機時間,預測性維護正在取得進展。
隨著預測性維護的成本節約效益日益顯著,它正從試點階段走向企業級應用。殼牌在2025年永續發展報告中指出,意外停機時間減少了35%,維護成本降低了20%,每年可節省超過2億美元的成本。 2025年,Factory AI在12家汽車工廠中成功預測了軸承故障,準確率高達92%,並在劣化發生前14天發現了問題。艾默生的AspenTech V15整合了生成式人工智慧模型,能夠將維護時間與生產計劃相匹配,從而幫助化工廠將意外停機時間減少了15%。國際能源總署(IEA)估計,如果預測性維護的普及率達到60%,到2030年,整個發電產業將避免500億美元的停機成本。像Augury這樣的託管服務供應商感測器、分析和運轉率保證等服務,使中型工廠無需進行資本投資,同時將效能風險轉移給供應商。
前期投資高,且與現有設施整合複雜
對現有機械設備進行感測器和閘道器的改造,其成本通常是全新安裝的數倍。施耐德電機的報告顯示,在煉油廠實施 EcoStruxure 系統平均需要 18 至 24 個月。這是因為工程師必須先對使用了幾十年的可程式邏輯控制器 (PLC) 的邏輯進行逆向工程,才能添加分析功能。艾默生指出,40% 的資產績效改善項目需要客製化中間件來連接 Modbus、Profibus 和 Foundation Fieldbus,每個站點將增加 20 萬至 50 萬美元的成本。將於 2024 年最終確定的 IEC 62443 網路安全標準強制要求網路分段和加密,但許多現有設施(棕地)的營運商缺乏這些措施,迫使他們同時進行基礎設施升級。受監管的公共產業受費率調整週期的限制,通常會推遲此類資本密集型項目,除非安全和合規機構強制要求。
細分市場分析
2025年,硬體收入佔比將達到49.19%,但隨著企業從被動的資產所有權模式轉向基於結果的合約模式,智慧互聯資產和營運軟體及管理服務市場預計將以8.72%的複合年成長率成長。隨著半導體供應商將類比數位轉換、訊號調理和無線功能整合到單一晶片中,感測器和執行器正逐漸商品化,其單價每年下降高達20%。 NVIDIA Jetson Orin等邊緣閘道器以15瓦的功耗實現了275 TOPS的運算能力,無需與雲端進行往返通訊即可實現設備上的異常檢測。
隨著供應商從永久授權模式轉向付費使用制,軟體的利潤率正在不斷提高。 IBM Maximo 和 SAP Intelligent Asset Management 等資產效能管理套件整合了產生式人工智慧,能夠自動產生工單並提案備件來源,從而將負責人的工作量減少 40%。中型製造商越來越傾向於簽訂 3 至 5 年的託管服務契約,供應商承擔感測器校準、模型重新訓練和網路安全修補程式等責任,以換取運作保證。因此,價值獲取方式正從獨立的硬體轉向提供分析、服務和持續改進的供應商。
2025年,乙太網路將以76.73%的市場佔有率主導智慧互聯資產管理市場,但隨著專用5G、NB-IoT和LoRaWAN將覆蓋範圍擴展到行動和遠端資產,無線連接正以8.95%的複合年成長率成長。工業乙太網路持續支援亞毫秒確定性控制,利用思科、Hirschmann和Moxa交換器內建的IEEE 802.1時間敏感網路擴充功能。無線方案正朝著兩大方向發展:高頻寬的工廠內移動性和遠距離、低功耗的遙測。
西門子於2026年2月宣布,在製造環境中可實現低於10毫秒的延遲,凸顯了5G技術在自主移動機器人和擴增實境(AR)工作流程中的適用性。 NB-IoT憑藉其與通訊業者的無縫整合,佔據了全球低功耗廣域網路(LPWA)部署的58%。同時,LoRaWAN在中國以外的免許可頻段部署中佔據主導地位,市佔率高達40%。銥星和新興的低地球軌道衛星星系提供的衛星鏈路,回程傳輸遙測資料從海上鑽井設施和偏遠礦區回傳至地面網路部署仍不切實際的地區。
區域分析
到2025年,北美將佔總收入的37.63%,並以8.87%的複合年成長率快速成長,這主要得益於製造商將產能遷回本土以及公共產業對老舊輸電資產進行數位化改造。根據美國能源局估計,加州和德克薩斯州的可再生能源滲透率已超過40%,凸顯了電網現代化改造的迫切性。羅克韋爾自動化公司已撥款20億美元用於PLC和邊緣設備的國內生產,以緩解供應鏈瓶頸。加拿大安大略省和不列顛哥倫比亞省的電力公司正在加速部署高級計量基礎設施(AMI),以縮短停電響應時間。墨西哥正在吸引外國投資進入汽車電子領域,並加速部署互聯資產平台,以連接墨西哥、加拿大和墨西哥三國的供應鏈。
在歐洲,能源效率是歐盟《企業永續性報告指令》(CSRD) 的優先事項,企業必須量化其設備層面的排放。塞文特倫特水務公司計劃於 2025 年 9 月與 Netmore 合作,部署一百萬個支援 LoRaWAN 技術的水錶,以減少 10% 的未計費水量損失。西門子、施耐德電氣和 ABB 正在德國、法國和英國試點建設數位雙胞胎工廠,為全球推廣做準備。地緣政治制裁正在減緩俄羅斯的現代化進程,區域需求正轉向國內自動化供應商。
隨著中國、日本、印度和韓國不斷完善其智慧製造政策,亞太地區正經歷最高的絕對成長率。中國的「中國製造2025」藍圖將智慧工廠列為優先事項,而日本的「社會5.0」則整合了網實整合系統以應對勞動力老化問題。印度的「智慧城市計畫」支持在100個大都會區建造基於物聯網的交通、廢棄物和水資源管理網路。澳洲的礦業公司正在營運由數千公里外的都市區控制的自動駕駛車隊,這證明了邊緣分析在偏遠環境中的可行性。在中東,石油收入正被投資於各種智慧城市項目,例如沙烏地阿拉伯的NEOM,這需要強大的資產績效管理系統。南非和奈及利亞正在試行精密農業和智慧電錶解決方案,以提高糧食安全和電網可靠性。在南美洲,巴西和阿根廷在農產品中主導引入互聯資產框架,以滿足出口市場的永續性認證要求。
其他好處:
- Excel格式的市場預測(ME)表
- 3個月的分析師支持
目錄
第1章:引言
- 研究假設和市場定義
- 調查範圍
第2章:調查方法
第3章執行摘要
第4章 市場狀況
- 市場概覽
- 市場促進因素
- 具有整合資產績效管理功能的工業IoT平台正快速普及。
- 為了最大限度地減少停機時間,預測性維護正日益受到重視。
- 在危險環境中進行遠端操作的必要性以及工人安全
- 5G專用網路的普及將使邊緣即時分析成為可能。
- 監管促進永續性和能源效率報告
- 數位雙胞胎技術與人工智慧驅動的資產建模的融合
- 市場限制因素
- 前期投資高,且與現有設施整合複雜
- 擴大的攻擊面中的網路安全漏洞
- 專有遺留協定帶來的互通性挑戰
- OT、IT 和分析領域跨學科人才短缺。
- 產業價值鏈分析
- 監理情勢
- 技術展望
- 宏觀經濟因素對市場的影響
- 五力分析
- 供應商的議價能力
- 買方的議價能力
- 新進入者的威脅
- 替代品的威脅
- 競爭公司之間的競爭
第5章 市場規模與成長預測
- 按組件
- 硬體
- 感測器和執行器
- 閘道器和邊緣設備
- 軟體
- 資產績效管理(APM)
- 製造執行系統(MES)
- SCADA和HMI
- 分析和人工智慧平台
- 服務
- 專業服務
- 託管服務
- 硬體
- 透過連接技術
- 有線
- Ethernet
- 工業現場匯流排
- 無線的
- Wi-Fi 和藍牙
- 5G/專用LTE
- LPWAN(LoRa、NB-IoT、Sigfox)
- 衛星/遠程
- 有線
- 部署模式
- 現場
- 雲
- 混合
- 按行業分類
- 製造業
- 能源公用事業
- 石油和天然氣
- 礦業
- 運輸/物流
- 衛生保健
- 農業
- 智慧城市和基礎設施
- 按地區
- 北美洲
- 美國
- 加拿大
- 墨西哥
- 歐洲
- 德國
- 英國
- 法國
- 俄羅斯
- 其他歐洲國家
- 亞太地區
- 中國
- 日本
- 印度
- 韓國
- 澳洲
- 其他亞太國家
- 中東和非洲
- 中東
- 非洲
- 南美洲
- 巴西
- 阿根廷
- 其他南美國家
- 北美洲
第6章 競爭情勢
- 市場集中度
- 策略趨勢
- 市佔率分析
- 公司簡介
- Siemens AG
- General Electric Company
- Schneider Electric SE
- ABB Ltd.
- Honeywell International Inc.
- Rockwell Automation, Inc.
- Emerson Electric Co.
- Mitsubishi Electric Corporation
- Robert Bosch GmbH
- Hitachi, Ltd.
- Yokogawa Electric Corporation
- PTC Inc.
- Cisco Systems, Inc.
- IBM Corporation
- Microsoft Corporation
- SAP SE
- Oracle Corporation
- Fujitsu Limited
- Aspen Technology, Inc.
- AVEVA Group plc
第7章 市場機會與未來展望
According to Mordor Intelligence, the smart connected assets and Operations market size was valued at USD 278.94 billion in 2025 and is estimated to grow from USD 303.43 billion in 2026 to reach USD 447.72 billion by 2031, at a CAGR of 8.09% during 2026-2031.
This report is Segmented by Component (Hardware, Software, and Services), Connectivity Technology (Wired, Wireless, and Satellite), Deployment Mode (On-Premise, Cloud, and Hybrid), Industry Vertical (Manufacturing, Energy and Utilities, Oil and Gas, Mining, Transportation and Logistics, Healthcare, and More), and Geography. The Market Forecasts are Provided in Terms of Value (USD).
Global Smart Connected Assets And Operations Market Trends and Insights
Rapid Adoption of Industrial IoT Platforms Integrating Asset Performance Management
Global manufacturers are consolidating point tools into unified industrial IoT platforms that stream sensor data, historian logs, and enterprise records into prescriptive-maintenance dashboards. Amazon Web Services shipped SiteWise Edge in 2025, offering sub-100 ms local latency while synchronizing summaries with the cloud, a design that keeps control networks isolated from public traffic.PTC's 2025 investor filing showed ThingWorx deployments rising 40% year over year as automotive suppliers cited tight CAD and PLM integration that cuts root-cause analysis from days to hours. Rockwell Automation reported subscription software revenue surpassing USD 1 billion in 2025, driven by FactoryTalk Hub, which connects more than 500,000 devices worldwide. GE Digital repositioned Predix as a horizontal layer and now partners with domain specialists to deliver turnkey wind-farm and power-plant optimizations that extend turbine inspection intervals by up to 20%.
Increasing Shift Towards Predictive Maintenance to Minimise Downtime
Predictive maintenance has moved from pilot to enterprise scale as the savings case hardens. Shell documented a 35% drop in unplanned downtime and a 20% reduction in maintenance spend in its 2025 sustainability report, resulting in annual savings above USD 200 million. Factory AI achieved a 92% bearing-failure forecast accuracy 14 days before degradation across 12 automotive plants in 2025. Emerson's AspenTech V15 embeds generative AI models that align maintenance windows with production schedules, helping chemical plants reduce unplanned outages by 15%. The International Energy Agency calculates that similar techniques could avert USD 50 billion in outage costs across power generation by 2030 if adoption reaches 60%. Managed-service providers such as Augury bundle sensors, analytics, and uptime guarantees so mid-size factories can avoid capital expense while transferring performance risk to the vendor.
High Upfront Capital and Integration Complexity for Brownfield Assets
Retrofitting legacy machinery with sensors and gateways often costs multiple times as much as greenfield deployments. Schneider Electric reported average EcoStruxure rollouts at refineries lasting 18-24 months because engineers must reverse-engineer decades-old programmable-logic-controller logic before layering analytics. Emerson disclosed that 40% of asset-performance projects require custom middleware to bridge Modbus, Profibus, and Foundation Fieldbus, adding USD 200,000-500,000 per site. IEC 62443 cybersecurity standards finalized in 2024 compel network segmentation and encryption that many brownfield operators lack, driving parallel infrastructure upgrades. Regulated utilities, constrained by rate-case cycles, often defer such capital-heavy programs unless mandated by safety or compliance bodies.
Other drivers and restraints analyzed in the detailed report include:
- Proliferation of 5G Private Networks Enabling Real-Time Analytics at Edge
- Regulatory Push for Sustainability and Energy-Efficiency Reporting
- Cyber-Security Vulnerabilities Across Expanded Attack Surfaces
For complete list of drivers and restraints, kindly check the Table Of Contents.
Segment Analysis
Hardware retained 49.19% of 2025 revenue, yet the Smart Connected Assets and Operations market size for software and managed services is projected to expand at an 8.72% CAGR as enterprises migrate from reactive asset ownership to outcome-based contracts. Sensors and actuators are commoditizing as semiconductor vendors collapse analog-to-digital conversion, signal conditioning, and radios onto single chips, lowering unit prices by up to 20% annually. Edge gateways such as NVIDIA Jetson Orin deliver 275 TOPS in a 15-watt envelope, enabling on-device anomaly detection without cloud round-trips.
Software commands premium margins as vendors shift from perpetual licenses to consumption pricing. Asset performance suites like IBM Maximo and SAP Intelligent Asset Management embed generative AI that auto-drafts work orders and suggests spare-parts procurement, trimming planner workload by 40%. Managed-services contracts spanning 3-5 years are gaining traction among mid-size manufacturers, with providers assuming responsibility for sensor calibration, model retraining, and cybersecurity patching in exchange for uptime guarantees. Consequently, value capture is tilting toward vendors that bundle analytics, services, and continuous improvement rather than stand-alone hardware.
Ethernet dominated the Smart Connected Assets and Operations market with 76.73% market share in 2025, but wireless links are growing at an 8.95% CAGR as private 5G, NB-IoT, and LoRaWAN extend coverage to mobile and remote assets. Industrial Ethernet continues to anchor sub-1 ms deterministic control using IEEE 802.1 time-sensitive networking extensions built into Cisco, Hirschmann, and Moxa switches. Wireless options bifurcate between high-bandwidth intra-plant mobility and long-range, low-power telemetry.
Siemens' February 2026 announcement of sub-10 ms production-floor latency underscores 5G's suitability for autonomous mobile robots and augmented-reality workflows. NB-IoT accounts for 58% of low-power wide-area deployments globally due to seamless carrier integration, while LoRaWAN leads unlicensed spectrum rollouts outside China with 40% share. Satellite links from Iridium and emerging low-earth-orbit constellations backhaul telemetry from offshore rigs and remote mines where terrestrial networks remain impractical.
Geography Analysis
North America generated 37.63% of 2025 revenue and is advancing at an 8.87% CAGR as manufacturers reshore capacity and utilities digitize aging transmission assets. The U.S. Department of Energy estimates that renewable penetration exceeded 40% in California and Texas, underscoring the urgency of grid modernization. Rockwell Automation earmarked USD 2 billion for domestic production of PLCs and edge devices to mitigate supply chain bottlenecks. Canada's utilities in Ontario and British Columbia accelerate advanced-metering infrastructure deployments to shorten outage response times. Mexico attracts foreign investment in automotive electronics, spurring the adoption of connected-asset platforms to sync tri-national supply chains.
Europe prioritizes energy efficiency under the EU CSRD, compelling firms to quantify equipment-level emissions. Severn Trent partnered with Netmore in September 2025 to roll out 1 million LoRaWAN water meters to cut non-revenue water losses by 10%. Siemens, Schneider Electric, and ABB are piloting digital twin factories in Germany, France, and the United Kingdom before global scaling. Geopolitical sanctions slow Russia's modernization, steering regional demand toward domestic automation vendors.
Asia-Pacific posts the fastest absolute growth as China, Japan, India, and South Korea embed smart-manufacturing policies. China's Made in China roadmap prioritizes intelligent factories, while Japan's Society 5.0 aligns cyber-physical systems to offset workforce aging. India's Smart Cities Mission supports IoT-enabled networks for traffic, waste, and water in 100 urban centers. Australia's miners operate autonomous fleets controlled from urban centers thousands of kilometers away, validating the viability of edge analytics in remote environments. The Middle East channels oil revenues into diversified smart-city projects, such as Saudi Arabia's NEOM, and demands robust asset-performance layers. South Africa and Nigeria are piloting precision agriculture and smart metering solutions to improve food security and grid reliability. South America, led by Brazil and Argentina, applies connected-asset frameworks in agribusiness to meet export-market sustainability certification requirements.
- Siemens AG
- General Electric Company
- Schneider Electric SE
- ABB Ltd.
- Honeywell International Inc.
- Rockwell Automation, Inc.
- Emerson Electric Co.
- Mitsubishi Electric Corporation
- Robert Bosch GmbH
- Hitachi, Ltd.
- Yokogawa Electric Corporation
- PTC Inc.
- Cisco Systems, Inc.
- IBM Corporation
- Microsoft Corporation
- SAP SE
- Oracle Corporation
- Fujitsu Limited
- Aspen Technology, Inc.
- AVEVA Group plc
Additional Benefits:
- The market estimate (ME) sheet in Excel format
- 3 months of analyst support
TABLE OF CONTENTS
1 INTRODUCTION
- 1.1 Study Assumptions and Market Definition
- 1.2 Scope of the Study
2 RESEARCH METHODOLOGY
3 EXECUTIVE SUMMARY
4 MARKET LANDSCAPE
- 4.1 Market Overview
- 4.2 Market Drivers
- 4.2.1 Rapid Adoption of Industrial IoT Platforms Integrating Asset Performance Management
- 4.2.2 Increasing Shift Towards Predictive Maintenance to Minimise Downtime
- 4.2.3 Demand for Remote Operations and Worker Safety in Hazardous Environments
- 4.2.4 Proliferation of 5G Private Networks Enabling Real-Time Analytics at Edge
- 4.2.5 Regulatory Push for Sustainability and Energy-Efficiency Reporting
- 4.2.6 Convergence of Digital-Twin Technology with AI-Driven Asset Modelling
- 4.3 Market Restraints
- 4.3.1 High Upfront Capital and Integration Complexity for Brownfield Assets
- 4.3.2 Cyber-Security Vulnerabilities Across Expanded Attack Surfaces
- 4.3.3 Interoperability Challenges Due to Proprietary Legacy Protocols
- 4.3.4 Shortage of Cross-Disciplinary OT-IT-Analytics Talent
- 4.4 Industry Value-Chain Analysis
- 4.5 Regulatory Landscape
- 4.6 Technological Outlook
- 4.7 Impact of Macroeconomic Factors on the Market
- 4.8 Porter''s Five Forces Analysis
- 4.8.1 Bargaining Power of Suppliers
- 4.8.2 Bargaining Power of Buyers
- 4.8.3 Threat of New Entrants
- 4.8.4 Threat of Substitutes
- 4.8.5 Intensity of Competitive Rivalry
5 MARKET SIZE AND GROWTH FORECASTS (VALUE)
- 5.1 By Component
- 5.1.1 Hardware
- 5.1.1.1 Sensors and Actuators
- 5.1.1.2 Gateways and Edge Devices
- 5.1.2 Software
- 5.1.2.1 Asset Performance Management (APM)
- 5.1.2.2 Manufacturing Execution System (MES)
- 5.1.2.3 SCADA and HMI
- 5.1.2.4 Analytics and AI Platforms
- 5.1.3 Services
- 5.1.3.1 Professional Services
- 5.1.3.2 Managed Services
- 5.1.1 Hardware
- 5.2 By Connectivity Technology
- 5.2.1 Wired
- 5.2.1.1 Ethernet
- 5.2.1.2 Industrial Fieldbus
- 5.2.2 Wireless
- 5.2.2.1 Wi-Fi and Bluetooth
- 5.2.2.2 5G / Private LTE
- 5.2.2.3 LPWAN (LoRa, NB-IoT, Sigfox)
- 5.2.3 Satellite / Remote
- 5.2.1 Wired
- 5.3 By Deployment Mode
- 5.3.1 On-Premise
- 5.3.2 Cloud
- 5.3.3 Hybrid
- 5.4 By Industry Vertical
- 5.4.1 Manufacturing
- 5.4.2 Energy and Utilities
- 5.4.3 Oil and Gas
- 5.4.4 Mining
- 5.4.5 Transportation and Logistics
- 5.4.6 Healthcare
- 5.4.7 Agriculture
- 5.4.8 Smart Cities and Infrastructure
- 5.5 By Geography
- 5.5.1 North America
- 5.5.1.1 United States
- 5.5.1.2 Canada
- 5.5.1.3 Mexico
- 5.5.2 Europe
- 5.5.2.1 Germany
- 5.5.2.2 United Kingdom
- 5.5.2.3 France
- 5.5.2.4 Russia
- 5.5.2.5 Rest of Europe
- 5.5.3 Asia-Pacific
- 5.5.3.1 China
- 5.5.3.2 Japan
- 5.5.3.3 India
- 5.5.3.4 South Korea
- 5.5.3.5 Australia
- 5.5.3.6 Rest of Asia-Pacific
- 5.5.4 Middle East and Africa
- 5.5.4.1 Middle East
- 5.5.4.2 Africa
- 5.5.5 South America
- 5.5.5.1 Brazil
- 5.5.5.2 Argentina
- 5.5.5.3 Rest of South America
- 5.5.1 North America
6 COMPETITIVE LANDSCAPE
- 6.1 Market Concentration
- 6.2 Strategic Moves
- 6.3 Market Share Analysis
- 6.4 Company Profiles (includes Global Level Overview, Market Level Overview, Core Segments, Financials as available, Strategic Information, Market Rank/Share, Products and Services, Recent Developments)
- 6.4.1 Siemens AG
- 6.4.2 General Electric Company
- 6.4.3 Schneider Electric SE
- 6.4.4 ABB Ltd.
- 6.4.5 Honeywell International Inc.
- 6.4.6 Rockwell Automation, Inc.
- 6.4.7 Emerson Electric Co.
- 6.4.8 Mitsubishi Electric Corporation
- 6.4.9 Robert Bosch GmbH
- 6.4.10 Hitachi, Ltd.
- 6.4.11 Yokogawa Electric Corporation
- 6.4.12 PTC Inc.
- 6.4.13 Cisco Systems, Inc.
- 6.4.14 IBM Corporation
- 6.4.15 Microsoft Corporation
- 6.4.16 SAP SE
- 6.4.17 Oracle Corporation
- 6.4.18 Fujitsu Limited
- 6.4.19 Aspen Technology, Inc.
- 6.4.20 AVEVA Group plc
7 MARKET OPPORTUNITIES AND FUTURE OUTLOOK
- 7.1 White-Space and Unmet-Need Assessment
