


 |
市場調查報告書
商品編碼
2062308
微細分:市場佔有率分析、產業趨勢與統計、成長預測(2026-2031)Microsegmentation - Market Share Analysis, Industry Trends & Statistics, Growth Forecasts (2026 - 2031) |
||||||

※ 本網頁內容可能與最新版本有所差異。詳細情況請與我們聯繫。
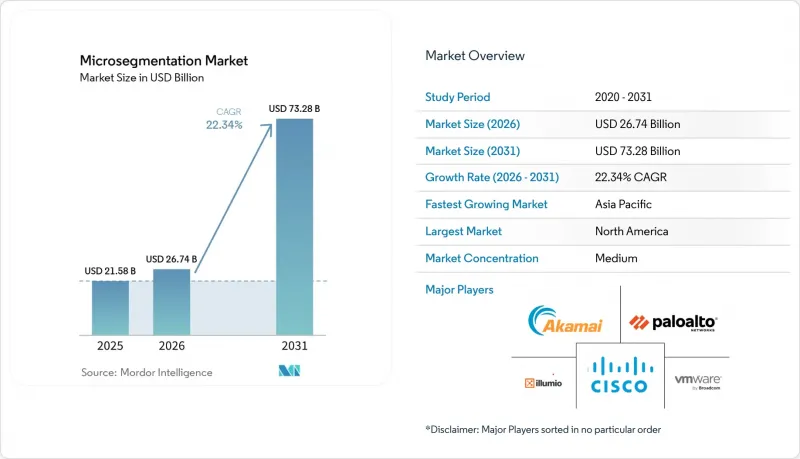
根據 Mordor Intelligence 預測,微分割市場規模將在 2025 年達到 215.8 億美元,2026 年達到 267.4 億美元,2031 年達到 732.8 億美元。
預計從 2026 年到 2031 年,其複合年成長率將達到 22.34%。
本報告按元件(軟體、服務)、部署模式(本地部署、雲端部署)、組織規模(中小企業、大型企業)、最終用戶產業(銀行、金融服務和保險、醫療保健和生命科學、其他)、安全類型(以網路為中心、以應用程式為中心、以工作負載為中心、以終端為中心)和地區進行細分。市場預測以美元(USD)為單位。
全球微分割市場趨勢及洞察
零信任安全架構的廣泛應用
零信任計畫以持續檢驗取代隱式信任,要求組織隔離所有工作負載、裝置和會話。美國管理和預算辦公室 (OMB) 呼籲聯邦機構在 2027 會計年度之前達到零信任 3 級成熟度,這明確要求在所有網路中實施微隔離,並正在推動高度監管的私營部門採取類似舉措。金融機構報告稱,實施網路隔離後,攻擊者的延遲時間已從 21 天縮短至不到 48 小時,這證實了該措施對減少資料外洩造成的經濟損失具有直接影響。供應商正在相應地調整藍圖,建立一個整合身分、網路和工作負載策略的單一引擎,以確保其符合零信任原則。
勒索軟體和橫向機芯攻擊的增加
由於攻擊者在發動攻擊前會花更多時間繪製內部拓樸圖,預計2025年,企業平均勒索贖金將達到530萬美元,較去年同期成長74%。在近68%的成功攻擊事件中觀察到了不同網路段之間的橫向移動,但微隔離透過阻止未使用的路徑來防止這種模式。提前實施網路隔離的組織與同業相比,恢復成本降低了89%,從而將網路安全性從一項不斷增加的成本轉變為精算對沖工具。
實施的複雜性和高成本
由於需要對應用程式依賴關係進行徹底調查和廣泛的前導測試,實施系統分段通常需要 6 到 18 個月。中型企業在第一階段會投資 50 萬到 500 萬美元,僅專注於關鍵業務資產,並從其他現代化項目中重新分配有限的資金。由於範圍界定中的任何一個失誤都可能擾亂生產工作流程、損害相關人員的信心並延誤後續階段,因此出現挫折的風險極高。
細分市場分析
服務市場的成長速度超過了整體微隔離市場,這反映出企業迫切需要能夠將抽象的安全意圖轉化為可執行規則的架構師。儘管軟體在2025年仍將佔據大部分收入,但企業已經意識到,僅靠許可不足以保護其網路。專家團隊花費數月時間來繪製流量圖、建立白名單,並檢驗策略對傳統工作負載的影響。隨著這些工作的成熟,基於結果的合約變得越來越普遍,供應商的付款與攻擊面或審計結果的可衡量減少掛鉤。託管服務供應商正在將微隔離整合到更廣泛的服務中,包括持續的策略調整、變更管理和事件回應——這對於那些無法負擔專門隔離負責人的企業至關重要。
另一個趨勢是低程式碼策略產生工具的興起,這些工具整合了常見企業應用的最佳實踐範本。這些工具將服務價值從迭代式規則制定提升到高利潤的諮詢工作。儘管軟體價格趨於同質化,但這種融合仍然帶來了大量的諮詢項目和較高的平均專案規模。
到 2025 年,雲端採用率佔總收入的 58.43%。這主要歸功於企業對基於 SaaS 的控制平台的偏好,該平台可擴展,並允許在幾分鐘內完成新計畫的策略檢驗。雲端交付無需機架空間、佈線和硬體更新周期,從而加快了分散式企業實現價值的速度。對於多重雲端使用者而言,統一的 SaaS主機可避免 Amazon Web Services、Microsoft Azure 和 Google Cloud 環境中策略語法不一致的問題。
然而,在受資料主權法規約束或採用空氣間隙的營運技術 (OT) 網路的行業中,本地部署仍然十分普遍。在這些環境中,設備和本地虛擬機器仍然能夠提供確定性的效能和離線運作能力。混合模式也很常見,即組織運行透過雲端交付的策略引擎,並將規則從雲端推送到本地執行器,從而在不移動敏感資料的情況下實現單一管理介面。
區域分析
亞太地區的快速成長得益於數十億美元的工廠現代化項目、金融科技的蓬勃發展以及各國網路安全戰略。中國強制要求對關鍵資訊基礎設施進行在地化保護,並鼓勵在能源、金融和電信等行業實施精細化管控。在日本,向工業4.0的維修正推動可程式邏輯控制器(PLC)實現更廣泛的網路連接,這需要對工作負載進行隔離,以避免流程中斷。
北美憑藉其成熟的網路安全預算和日益複雜的威脅活動,繼續保持主導。美國聯邦零信任策略和各州隱私權法構成了多元化的監管體系,清楚地界定了企業發展藍圖中的細分市場。加拿大對關鍵基礎設施韌性的重視正在逐步提振需求,而墨西哥的近岸外包舉措則在製造業聚集區創造了新的需求。
在歐洲,隨著違反NIS2(網路和資訊安全指令2)的處罰日益受到經營團隊重視,各關鍵產業的實施工作正在同步推進。在中東,石油收入正被用於技術多元化,大規模智慧城市和能源專案從設計階段就開始融入網路分段技術。南美洲的實施工作主要集中在巴西和阿根廷,金融監管機構正在收緊資料外洩報告規則。同時,非洲仍處於發展階段,受限於安全架構師的短缺,但通訊基礎設施的現代化正在推動其發展。
其他好處:
- Excel格式的市場預測(ME)表
- 3個月的分析師支持
目錄
第1章:引言
- 研究假設和市場定義
- 調查範圍
第2章:調查方法
第3章執行摘要
第4章 市場狀況
- 市場概覽
- 市場促進因素
- 零信任安全架構的廣泛應用
- 勒索軟體攻擊和橫向機芯攻擊呈上升趨勢。
- 東西向交通管制的監管要求
- 雲端原生工作負載和微服務的激增
- 與安全存取服務邊緣 (SASE) 平台整合
- 與微隔離相關的網路保險預篩選要求
- 市場限制因素
- 實施的複雜性和高成本
- 與傳統基礎設施相容性相關的挑戰
- 認證微分割架構師短缺
- 營運技術(OT)網路中的延遲開銷
- 產業價值鏈分析
- 監理情勢
- 技術展望
- 宏觀經濟因素對市場的影響
- 波特五力分析
第5章 市場規模與成長預測
- 按組件
- 軟體
- 服務
- 部署模式
- 現場
- 雲
- 按組織規模
- 小型企業
- 大公司
- 按最終用戶行業分類
- 銀行、金融服務和保險(BFSI)
- 醫療保健和生命科學
- 政府/國防
- 資訊科技/通訊
- 零售與電子商務
- 能源公用事業
- 其他終端用戶產業
- 按安全類型
- 以網路為中心
- 以應用為中心
- 以工作量為中心
- 以端點為中心
- 按地區
- 北美洲
- 美國
- 加拿大
- 墨西哥
- 歐洲
- 德國
- 英國
- 法國
- 俄羅斯
- 其他歐洲國家
- 亞太地區
- 中國
- 日本
- 印度
- 韓國
- 澳洲
- 其他亞太國家
- 中東
- 沙烏地阿拉伯
- 阿拉伯聯合大公國
- 其他中東國家
- 非洲
- 南非
- 埃及
- 其他非洲國家
- 南美洲
- 巴西
- 阿根廷
- 其他南美國家
- 北美洲
第6章 競爭情勢
- 市場集中度
- 策略趨勢
- 市佔率分析
- 公司簡介
- Illumio, Inc.
- VMware, Inc.
- Cisco Systems, Inc.
- Akamai Technologies, Inc.
- Palo Alto Networks, Inc.
- Fortinet, Inc.
- Check Point Software Technologies Ltd.
- Juniper Networks, Inc.
- Unisys Corporation
- Forcepoint LLC
- Sophos Group plc
- F5, Inc.
- Nutanix, Inc.
- ColorTokens Inc.
- CloudPassage, Inc.
- Tufin Software Technologies Ltd.
- Zscaler, Inc.
- Armo Security Ltd.
- Guardicore Ltd.
- McAfee LLC
第7章 市場機會與未來展望
According to Mordor Intelligence, the microsegmentation market size is projected to be USD 21.58 billion in 2025, USD 26.74 billion in 2026, and reach USD 73.28 billion by 2031, growing at a CAGR of 22.34% from 2026 to 2031.
This report is Segmented by Component (Software, Services), Deployment Mode (On-Premises, Cloud), Organization Size (Small and Medium Enterprises, Large Enterprises), End-User Industry (BFSI, Healthcare and Life Sciences, and More), Security Type (Network-Centric, Application-Centric, Workload-Centric, Endpoint-Centric), and Geography. The Market Forecasts are Provided in Terms of Value (USD).
Global Microsegmentation Market Trends and Insights
Rising Adoption Of Zero-Trust Security Architectures
Zero-trust programs replace implicit trust with continuous verification, forcing enterprises to isolate every workload, device, and session. The U.S. Office of Management and Budget requires federal agencies to attain zero-trust Level 3 maturity by fiscal 2027, which explicitly calls for microsegmentation on all networks, driving similar moves in highly regulated private sectors.Financial institutions report that dwell time dropped from 21 days to under 48 hours after segmentation, confirming the control's direct impact on breach economics. Vendors align roadmaps accordingly, integrating identity, network, and workload policies into a unified engine that executes in line with zero-trust principles.
Surge In Ransomware And Lateral-Movement Attacks
Average enterprise ransom demands climbed to USD 5.3 million in 2025, a 74% rise from the prior year, as attackers spent longer mapping internal topologies before detonation. Nearly 68% of successful incidents involved cross-segment traversal, a pattern microsegmentation disrupts by sealing off unused pathways. Organizations with pre-existing segmentation reported 89% lower recovery outlays than peers, converting cybersecurity into an actuarial hedge rather than a sunk cost.
High Implementation Complexity And Cost
Segmentation rollouts typically require six to eighteen months, driven by painstaking discovery of application dependencies and extensive pilot testing. Mid-sized enterprises invest between USD 500,000 and USD 5 million for a first phase that covers only mission-critical assets, diverting scarce capital from other modernization programs. Rework risk looms large, as one mis-scoped policy can interrupt production workflows, eroding stakeholder confidence and delaying further phases.
Other drivers and restraints analyzed in the detailed report include:
- Regulatory Mandates For East-West Traffic Control
- Proliferation Of Cloud-Native Workloads And Microservices
- Legacy Infrastructure Compatibility Challenges
For complete list of drivers and restraints, kindly check the Table Of Contents.
Segment Analysis
Services growth outpaces the overall microsegmentation market, reflecting an acute need for architects who translate abstract security intent into enforceable rules. In 2025, software still generated most revenue, yet organizations discovered that licensing alone does not secure networks. Professional teams spend months mapping traffic flows, drafting allowlists, and validating policy impact on legacy workloads. As these engagements mature, outcome-based contracts gain traction, tying vendor payments to measurable reductions in attack surface or audit findings. Managed service providers bundle microsegmentation into broader offerings that include continuous policy tuning, change management, and incident response, crucial for organizations unable to field full-time segmentation staff.
A secondary dynamic is the emergence of low-code policy generators that embed best practice templates for common enterprise applications. These tools elevate the value of services from repetitive rule writing toward higher-margin advisory roles. The convergence keeps average project scopes high and sustains robust consulting pipelines, even as software per-unit prices are being commoditized.
Cloud deployments held 58.43% of 2025 revenue as greenfield projects favored SaaS control planes that scale elastically and validate policies in minutes. Cloud delivery removes the need for rack space, cabling, and hardware refresh cycles, reducing time-to-value for distributed enterprises. For multi-cloud users, a unified SaaS console prevents policy syntax drift across Amazon Web Services, Microsoft Azure, and Google Cloud environments.
On-premises deployments, however, remain a fixture in sectors with data sovereignty rules or air-gapped operational technology networks. In those contexts, appliances or self-hosted virtual machines still offer deterministic performance and offline operation. Hybrid patterns are common, with organizations running cloud-delivered policy engines that push rules to on-premises enforcers, yielding a single pane of glass without relocating sensitive data.
Geography Analysis
Asia-Pacific's high-growth trajectory is fueled by multi-billion-dollar factory modernization programs, fintech proliferation, and national cybersecurity strategies. China mandates localized protection of critical information infrastructure, encouraging sectors such as energy, finance, and telecom to adopt granular controls. In Japan, Industry 4.0 retrofits expose programmable logic controllers to broader networks, necessitating workload isolation that avoids process interruptions.
North America retains demand leadership by virtue of mature cyber budgets and advanced threat activity. U.S. federal zero-trust milestones and state privacy laws create a mosaic of mandates that place segmentation squarely on enterprise roadmaps. Canada's emphasis on critical infrastructure resilience adds incremental volume, while Mexican nearshoring initiatives inject new demand in manufacturing corridors.
Europe experiences synchronized adoption across critical sectors as penalties for NIS2 non-conformance become a board-level concern. The Middle East channels oil revenue into technology diversification, with large-scale smart city and energy projects embedding segmentation at design time. South American uptake centers on Brazil and Argentina, where financial regulators tighten breach reporting rules, while Africa remains emergent, constrained by shortage of security architects but buoyed by telecom modernization.
- Illumio, Inc.
- VMware, Inc.
- Cisco Systems, Inc.
- Akamai Technologies, Inc.
- Palo Alto Networks, Inc.
- Fortinet, Inc.
- Check Point Software Technologies Ltd.
- Juniper Networks, Inc.
- Unisys Corporation
- Forcepoint LLC
- Sophos Group plc
- F5, Inc.
- Nutanix, Inc.
- ColorTokens Inc.
- CloudPassage, Inc.
- Tufin Software Technologies Ltd.
- Zscaler, Inc.
- Armo Security Ltd.
- Guardicore Ltd.
- McAfee LLC
Additional Benefits:
- The market estimate (ME) sheet in Excel format
- 3 months of analyst support
TABLE OF CONTENTS
1 INTRODUCTION
- 1.1 Study Assumptions and Market Definition
- 1.2 Scope of the Study
2 RESEARCH METHODOLOGY
3 EXECUTIVE SUMMARY
4 MARKET LANDSCAPE
- 4.1 Market Overview
- 4.2 Market Drivers
- 4.2.1 Rising Adoption of Zero-Trust Security Architectures
- 4.2.2 Surge in Ransomware and Lateral-Movement Attacks
- 4.2.3 Regulatory Mandates for East-West Traffic Control
- 4.2.4 Proliferation of Cloud-Native Workloads and Micro-services
- 4.2.5 Convergence with Secure Access Service Edge (SASE) Platforms
- 4.2.6 Cyber-Insurance Pre-qualification Requirements for Microsegmentation
- 4.3 Market Restraints
- 4.3.1 High Implementation Complexity and Cost
- 4.3.2 Legacy Infrastructure Compatibility Challenges
- 4.3.3 Scarcity of Certified Microsegmentation Architects
- 4.3.4 Latency Overheads in Operational Technology (OT) Networks
- 4.4 Industry Value-Chain Analysis
- 4.5 Regulatory Landscape
- 4.6 Technological Outlook
- 4.7 Impact of Macroeconomic Factors on the Market
- 4.8 Porter's Five Forces Analysis
- 4.8.1 Threat of New Entrants
- 4.8.2 Threat of Substitutes
- 4.8.3 Bargaining Power of Suppliers
- 4.8.4 Bargaining Power of Buyers
- 4.8.5 Intensity of Competitive Rivalry
5 MARKET SIZE AND GROWTH FORECASTS (VALUE)
- 5.1 By Component
- 5.1.1 Software
- 5.1.2 Services
- 5.2 By Deployment Mode
- 5.2.1 On-Premises
- 5.2.2 Cloud
- 5.3 By Organization Size
- 5.3.1 Small and Medium Enterprises
- 5.3.2 Large Enterprises
- 5.4 By End-User Industry
- 5.4.1 Banking, Financial Services and Insurance (BFSI)
- 5.4.2 Healthcare and Life Sciences
- 5.4.3 Government and Defense
- 5.4.4 IT and Telecommunication
- 5.4.5 Retail and E-Commerce
- 5.4.6 Energy and Utilities
- 5.4.7 Rest of End-User Industry
- 5.5 By Security Type
- 5.5.1 Network-Centric
- 5.5.2 Application-Centric
- 5.5.3 Workload-Centric
- 5.5.4 Endpoint-Centric
- 5.6 By Geography
- 5.6.1 North America
- 5.6.1.1 United States
- 5.6.1.2 Canada
- 5.6.1.3 Mexico
- 5.6.2 Europe
- 5.6.2.1 Germany
- 5.6.2.2 United Kingdom
- 5.6.2.3 France
- 5.6.2.4 Russia
- 5.6.2.5 Rest of Europe
- 5.6.3 Asia-Pacific
- 5.6.3.1 China
- 5.6.3.2 Japan
- 5.6.3.3 India
- 5.6.3.4 South Korea
- 5.6.3.5 Australia
- 5.6.3.6 Rest of Asia-Pacific
- 5.6.4 Middle East
- 5.6.4.1 Saudi Arabia
- 5.6.4.2 United Arab Emirates
- 5.6.4.3 Rest of Middle East
- 5.6.5 Africa
- 5.6.5.1 South Africa
- 5.6.5.2 Egypt
- 5.6.5.3 Rest of Africa
- 5.6.6 South America
- 5.6.6.1 Brazil
- 5.6.6.2 Argentina
- 5.6.6.3 Rest of South America
- 5.6.1 North America
6 COMPETITIVE LANDSCAPE
- 6.1 Market Concentration
- 6.2 Strategic Moves
- 6.3 Market Share Analysis
- 6.4 Company Profiles (includes Global Level Overview, Market Level Overview, Core Segments, Financials as available, Strategic Information, Market Rank/Share, Products and Services, Recent Developments)
- 6.4.1 Illumio, Inc.
- 6.4.2 VMware, Inc.
- 6.4.3 Cisco Systems, Inc.
- 6.4.4 Akamai Technologies, Inc.
- 6.4.5 Palo Alto Networks, Inc.
- 6.4.6 Fortinet, Inc.
- 6.4.7 Check Point Software Technologies Ltd.
- 6.4.8 Juniper Networks, Inc.
- 6.4.9 Unisys Corporation
- 6.4.10 Forcepoint LLC
- 6.4.11 Sophos Group plc
- 6.4.12 F5, Inc.
- 6.4.13 Nutanix, Inc.
- 6.4.14 ColorTokens Inc.
- 6.4.15 CloudPassage, Inc.
- 6.4.16 Tufin Software Technologies Ltd.
- 6.4.17 Zscaler, Inc.
- 6.4.18 Armo Security Ltd.
- 6.4.19 Guardicore Ltd.
- 6.4.20 McAfee LLC
7 MARKET OPPORTUNITIES AND FUTURE OUTLOOK
- 7.1 White-space and Unmet-Need Assessment


