


 |
市場調查報告書
商品編碼
2062199
線束組件:市場佔有率分析、產業趨勢與統計、成長預測(2026-2031)Cable Assembly - Market Share Analysis, Industry Trends & Statistics, Growth Forecasts (2026 - 2031) |
||||||
※ 本網頁內容可能與最新版本有所差異。詳細情況請與我們聯繫。
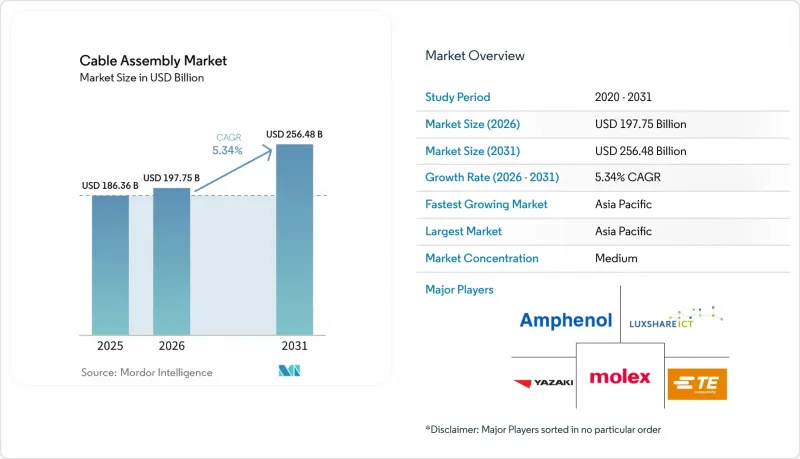
根據 Mordor Intelligence 預測,電纜組件市場規模預計將在 2025 年達到 1863.6 億美元,2026 年達到 1977.5 億美元,2031 年達到 2564.8 億美元,2026 年至 2031 年的複合年成長率為 5.34%。
本報告按產品類型(客製化線纜組件、標準/現成組件、注塑成型線纜組件、光纖組件等)、線纜類型(同軸電纜等)、終端用戶產業(汽車/運輸、電訊等)、應用領域(資料傳輸/通訊等)及地區進行細分。市場預測以美元(USD)為單位。
全球線束組件市場趨勢與洞察
高速資料中心互連需求激增
超大規模業者正從 400 Gbps 光模組升級到 800 Gbps 和 1.6 Tbps光學模組,將更換週期縮短至約兩年,並增加多年供貨合約下的光纖採購量。主動式光纜的連接埠功耗約為直連銅纜的一半。這一差異使得光纜在高密度 GPU 機架中具有優勢,因為單一伺服器的功耗高達 10 千瓦。能夠每班次認證超過 10,000 個終端的自動化拋光生產線仍然稀缺,這為大型營運商帶來了營運優勢。隨著 IEEE 802.3 標準在 2026 年初批准 1.6 Tbps 以太網,預計現有 200G 和 400G 設備的更換速度將加快,光纖組件的兩位數成長預計將在整個預測期內持續。
5G和FTTH(光纖到府)部署的擴展
預計到2025年,美國光纖到府(FTTH)的建設將新增超過1,180萬戶家庭。隨著安裝人員從熔接轉向推入式連接器,每戶家庭將消耗1.2至1.5套入口光纖組件。預端接線束的單價雖然高出35%,但可減少約三分之一的現場施工量,在現場人工成本超過每小時75美元的市場中,這使其成為一個頗具吸引力的選擇。同時,5G中頻段密度的提升推動了對整合直流電源的混合銅芯光纖供電電纜的需求,這種饋線可用於遠端射頻單元(RRH)。此外,在農村固定無線部署中,由於地形崎嶇,鑽孔困難,因此更傾向於使用符合NEMA 4X標準的回程傳輸組件。
銅和特殊金屬價格波動
2025年初至2026年中期,倫敦金屬交易所(LME)的銅期貨價格上漲了63%,導致組裝製造商的原物料成本上漲了約五分之一。儘管汽車業的合約包含與指數掛鉤的調整條款,但60至90天的滯後意味著,在價格大幅上漲期間,毛利率可能會被壓縮多達400個基點。對於磷青銅和鈹銅而言,沒有避險或批量折扣機制的中小型區域組裝商要么收取附加費,要么改用鋁導體。鋁導體每公斤成本可節省60%至70%,但導電率也低40%。對於平均使用80至100公斤銅的電動車線束而言,如果銅價穩定在每噸1萬美元,則佈線成本將增加高達1000美元,汽車製造商難以完全消化這部分成本。
細分市場分析
預計到2025年,光纖組件將佔總銷售額的36.54%,並以6.06%的複合年成長率成長,超越傳統銅纜產品,這主要得益於超大規模園區向800Gbps光纖通訊的轉型。 Meta與康寧公司簽訂的數十億美元契約,預付了產能,並展現了對長期需求的信心,光纖電纜組件市場也因此受益。客製化電纜組件約佔總銷售額的28-30%,為汽車、航太和醫療行業的專案提供支持,而即時供貨模式正在幫助OEM製造商減少現場庫存。
標準現成組件的價格仍然非常敏感,中國代工廠生產的基本款 USB-C 線單價不到 2 美元,這使得零售品牌在小眾市場之外的利潤空間十分有限。注塑成型和高頻組裝的毛利率維持在 30% 左右,因為難以在低成本下實現防塵防水性能和插入損耗保證。扁平線纜和帶狀線纜常用於超薄消費性電子產品,但正逐漸被具有多層訊號和電源層的軟性印刷電路板部分取代。
預計到2025年,光纖電纜將佔總銷售額的37.72%,並將繼續以6.11%的複合年成長率推動市場成長,因為插入損耗低於0.3 dB的單模光纖規格在脊葉式網路架構中將成為標準配置。同軸電纜約佔電纜組件市場的五分之一,由於5G安裝商更傾向於低損耗波紋電纜,其成長速度有所放緩,但對於超過100公尺的饋線天線而言,同軸電纜仍然不可或缺。
在800V車輛架構的背景下,電力電纜市場發展勢頭強勁。隨著絕緣等級和電流耐受能力的提升,電力電纜在電纜組件市場的佔有率正逐步擴大至個位數中段。射頻和微波電纜也保持著個位數中段的成長,這得益於電子戰系統的升級以及國防預算中對高頻雷達的優先發展。 Cat6A和Cat7雙絞線電纜在企業園區內推動了替換需求,但商品化趨勢正使其成長速度放緩至個位數低段。
區域分析
預計到2025年,亞太地區將佔全球銷售額的42.12%,並以5.78%的複合年成長率成長。這主要得益於TE Connectivity、Hirose Electric和立訊精密等公司在菲律賓、印度和中國當地的新投資。日本和韓國正在投資光纖網路建設,以滿足各自國家日益成長的雲端服務需求。同時,隨著各大品牌將採購來源從中國擴展到其他地區,越南的家用電子電器市場也蓬勃發展。
北美約佔29%的市場佔有率,Nike森收購Electro Cables以及多個州針對關鍵基礎設施供應鏈的優惠政策,正在加速製造業回流美國。墨西哥正崛起為美國組裝廠線束的近岸外包中心,以抵銷美國高昂的人事費用。
歐洲約佔總銷售額的五分之一。儘管遵守 RoHS 和 REACH 法規對中小型製造商來說是一項沉重的負擔,但諸如用於人工智慧資料中心的光纖和 800V 汽車線束等高階細分市場卻蓬勃發展。中東、非洲和南美洲合計佔比不到 10%,但海底電纜、交通電氣化和區域資料中心擴建的訂單仍然強勁。
其他好處:
- Excel格式的市場預測(ME)表
- 3個月的分析師支持
目錄
第1章:引言
- 市場分析與定義的前提條件
- 分析範圍
第2章 分析方法
第3章執行摘要
第4章 市場狀況
- 市場概覽
- 市場促進因素
- 高速資料中心互連需求激增
- 擴大 5G 和 FTTH(光纖到府)的部署
- 由於電氣化和高級駕駛輔助系統(ADAS)的普及,汽車線路的複雜性日益增加。
- 工業自動化與智慧工廠實施
- 量子計算低溫電纜的要求
- 用於電動垂直起降飛行器和城市空中運輸的模組化動力線束
- 市場限制因素
- 銅及特殊金屬價格波動
- 嚴格的RoHS/REACH法規和強制性無鹵材料
- 高性能氟聚合物介電材料供應緊張
- 超小型高頻連接器中的訊號完整性挑戰
- 產業供應鏈分析
- 監理情勢
- 技術展望
- 宏觀經濟因素對市場的影響
- 波特五力分析
第5章 市場規模與成長預測
- 依產品類型
- ☐ 電纜組件
- 標準/現成組裝
- 包覆成型電纜組件
- 光纖元件
- 扁平/帶狀電纜組件
- 高速高頻組裝
- 按電纜類型
- 同軸
- 光纖
- 絲帶/扁平
- 雙絞線/網路
- 射頻和微波
- 電源
- 按最終用途行業分類
- 汽車和運輸業
- 電訊
- 家用電子電器
- 工業自動化與機器人
- 醫療及醫療設備
- 航太/國防
- IT與資料中心
- 能源與電力
- 鐵路和公共交通
- 透過使用
- 資料傳輸和通訊
- 動力傳輸
- 射頻/微波訊號
- 高效能運算
- 感測器和控制
- 充電和電池管理
- 照明和展示
- 按地區
- 北美洲
- 美國
- 加拿大
- 墨西哥
- 南美洲
- 巴西
- 阿根廷
- 其他南美國家
- 歐洲
- 德國
- 英國
- 法國
- 俄羅斯
- 其他歐洲國家
- 亞太地區
- 中國
- 日本
- 印度
- 韓國
- 澳洲
- 其他亞太國家
- 中東
- 沙烏地阿拉伯
- 阿拉伯聯合大公國
- 其他中東國家
- 非洲
- 南非
- 埃及
- 其他非洲國家
- 北美洲
第6章 競爭情勢
- 市場集中度
- 策略趨勢
- 市佔率分析
- 公司簡介
- TE Connectivity Ltd.
- Amphenol Corporation
- Molex LLC
- Luxshare Precision Industry Co., Ltd.
- Yazaki Corporation
- Aptiv PLC
- Sumitomo Electric Industries, Ltd.
- Rosenberger Hochfrequenztechnik GmbH & Co. KG
- Carlisle Interconnect Technologies(Carlisle Companies Inc.)
- Samtec, Inc.
- HARTING Technology Group
- JAE Electronics, Inc.(Japan Aviation Electronics Industry, Ltd.)
- LEMO SA
- Hirose Electric Co., Ltd.
- Radiall SA
- Belden Inc.
- BizLink Holding Inc.
- Nexans SA
- WL Gore & Associates, Inc.
- 3M Company
第7章 市場機會與未來展望
According to Mordor Intelligence, the cable assembly market size is projected to be USD 186.36 billion in 2025, USD 197.75 billion in 2026, and reach USD 256.48 billion by 2031, growing at a CAGR of 5.34% from 2026 to 2031.
This report is Segmented by Product Type (Custom Cable Assemblies, Standard/Off-the-Shelf Assemblies, Overmolded Cable Assemblies, Fiber-Optic Assemblies, and More), Cable Type (Coaxial, and More), End-Use Industry (Automotive and Transportation, Telecommunications, and More), Application (Data Transfer and Communication, and More), and Geography. The Market Forecasts are Provided in Terms of Value (USD).
Global Cable Assembly Market Trends and Insights
Surge In High-Speed Data-Center Interconnect Demand
Hyperscale operators are migrating from 400 Gbps to 800 Gbps and 1.6 Tbps optics, compressing refresh cycles to roughly two years and lifting fiber purchases under multi-year supply agreements. Active optical cables dissipate roughly half the port power of direct-attach copper, a difference that favors them in dense GPU racks where a single server can draw 10 kilowatts. Automated polishing lines that certify more than 10,000 termini per shift remain scarce, giving scale players an execution edge. IEEE 802.3's ratification of 1.6 Tbps Ethernet in early 2026 will accelerate replacement of installed 200 G and 400 G inventories, sustaining double-digit fiber-assembly growth well into the forecast window.
Expansion Of 5 G And Fiber-To-The-Home Deployments
United States FTTH construction passed 11.8 million additional premises during 2025, absorbing 1.2-1.5 drop-cable assemblies per home as installers pivot from fusion splicing to push-on connectors. Pre-terminated harnesses cost up to 35% more per unit yet cut truck-roll labor by around one-third, an attractive trade-off in markets where field labor exceeds USD 75 per hour. Parallel 5 G mid-band densification boosts demand for hybrid copper-fiber feeder cables that integrate DC power for remote radio heads, while rural fixed-wireless rollouts favor NEMA 4X-rated backhaul assemblies in difficult trench terrain.
Volatility In Copper and Specialty Metal Prices
London Metal Exchange copper futures climbed 63% from early 2025 to mid-2026, inflating the raw-material cost of goods by roughly one-fifth for assembly houses. Automotive contracts offer indexed adjustments, yet 60-90-day lags compress gross margin by as much as 400 basis points during rapid spikes. Smaller regional assemblers, lacking hedging or volume rebates on phosphor bronze and beryllium copper, apply surcharges or shift toward aluminum conductors that save 60-70% per kilogram but sacrifice 40% conductivity. Electric-vehicle harnesses averaging 80-100 kg of copper would incur up to USD 1,000 in extra wiring cost at a steady USD 10,000 per metric-ton price, a figure automakers struggle to absorb in full.
Other drivers and restraints analyzed in the detailed report include:
- Electrification And ADAS-Driven Automotive Wiring Complexity
- Industrial Automation and Smart-Factory Rollouts
- Stringent RoHS/REACH And Halogen-Free Material Mandates
For complete list of drivers and restraints, kindly check the Table Of Contents.
Segment Analysis
Fiber-optic assemblies held 36.54% of 2025 revenue and are projected to expand at a 6.06% CAGR, outpacing legacy copper offerings as hyperscale campuses migrate to 800 Gbps optics. The cable assembly market size for fiber products benefits from Meta's multibillion-dollar Corning agreement, which pre-books capacity and signals confidence in long-term demand. Custom cable assemblies, about 28-30% of sales, underpin automotive, aerospace, and medical projects where just-in-time kitting shrinks' inventory on original equipment manufacturers' floors.
Standard off-the-shelf assemblies remain price sensitive, with Chinese contractors routing basic USB-C cables at sub-USD 2-unit costs, compressing margins outside retail-branded niches. Overmolded designs and high-frequency assemblies sustain gross margins near 30% because ingress-protection and insertion-loss guarantees are hard to replicate cheaply. Ribbon and flat-cable formats serve ultrathin consumer devices but face partial substitution from flexible printed circuits that co-laminate signal and power layers.
Fiber-optic cables accounted for 37.72% of 2025 revenue and will continue to lead at a 6.11% CAGR as single-mode specifications with sub-0.3 dB insertion loss become standard in spine-leaf architectures. Coaxial lines, roughly one-fifth of the cable assembly market size, grow more slowly as 5 G installers prefer lower-loss corrugated designs, yet they stay critical for antenna feeders that exceed 100 meters.
Power cables are gaining momentum from 800-volt vehicle architectures, lifting their share of the cable assembly market by mid-single digits as insulation ratings and current thresholds rise. RF and microwave cables, buoyed by electronic-warfare upgrades, sustain mid-single-digit growth on defense budgets that favour higher-frequency radar. Cat6A and Cat7 twisted-pair lines refresh enterprise campuses, but commoditization tempers growth to the low-single-digit range.
Geography Analysis
Asia-Pacific contributed 42.12% of global 2025 revenue and is set to rise at a 5.78% CAGR as TE Connectivity, Hirose Electric, and Luxshare commit fresh capital to the Philippines, India, and mainland China. Japan and South Korea invest in optical-fiber capacity to serve domestic cloud expansion, whereas Vietnam picks up consumer-electronics programs as brands diversify sourcing beyond China.
North America sits near 29% share, with reshoring activity accelerating after Nexans' Electro Cables acquisition and multiple state incentives targeting critical infrastructure supply chains. Mexico advances as a nearshoring hub for harnesses feeding U.S. assembly plants, balancing higher U.S. labor costs.
Europe holds roughly one-fifth of revenue; compliance burdens from RoHS and REACH weigh on smaller shops, yet premium niches such as AI-datacenter fiber and 800-volt vehicle harnesses thrive. Middle East and Africa and South America collectively remain below 10% but log steady orders for submarine links, transit electrification, and regional data-center buildouts.
- TE Connectivity Ltd.
- Amphenol Corporation
- Molex LLC
- Luxshare Precision Industry Co., Ltd.
- Yazaki Corporation
- Aptiv PLC
- Sumitomo Electric Industries, Ltd.
- Rosenberger Hochfrequenztechnik GmbH & Co. KG
- Carlisle Interconnect Technologies (Carlisle Companies Inc.)
- Samtec, Inc.
- HARTING Technology Group
- JAE Electronics, Inc. (Japan Aviation Electronics Industry, Ltd.)
- LEMO SA
- Hirose Electric Co., Ltd.
- Radiall SA
- Belden Inc.
- BizLink Holding Inc.
- Nexans SA
- W. L. Gore & Associates, Inc.
- 3M Company
Additional Benefits:
- The market estimate (ME) sheet in Excel format
- 3 months of analyst support
TABLE OF CONTENTS
1 INTRODUCTION
- 1.1 Study Assumptions and Market Definition
- 1.2 Scope of the Study
2 RESEARCH METHODOLOGY
3 EXECUTIVE SUMMARY
4 MARKET LANDSCAPE
- 4.1 Market Overview
- 4.2 Market Drivers
- 4.2.1 Surge in High-Speed Data-Center Interconnect Demand
- 4.2.2 Expansion of 5G and Fiber-to-the-Home Deployments
- 4.2.3 Electrification and ADAS-Driven Automotive Wiring Complexity
- 4.2.4 Industrial Automation and Smart-Factory Roll-outs
- 4.2.5 Quantum-Computing Cryogenic Cabling Requirements
- 4.2.6 eVTOL and Urban-Air-Mobility Modular Power Harnesses
- 4.3 Market Restraints
- 4.3.1 Volatility in Copper and Specialty Metal Prices
- 4.3.2 Stringent RoHS/REACH and Halogen-Free Material Mandates
- 4.3.3 Tight Supply of High-Performance Fluoropolymer Dielectrics
- 4.3.4 Signal-Integrity Challenges in Ultra-Miniature High-Freq Connectors
- 4.4 Industry Value-Chain Analysis
- 4.5 Regulatory Landscape
- 4.6 Technological Outlook
- 4.7 Impact of Macroeconomic Factors on the Market
- 4.8 Porter's Five Forces Analysis
- 4.8.1 Threat of New Entrants
- 4.8.2 Bargaining Power of Buyers
- 4.8.3 Bargaining Power of Suppliers
- 4.8.4 Threat of Substitutes
- 4.8.5 Competitive Rivalry
5 MARKET SIZE AND GROWTH FORECASTS (VALUE)
- 5.1 By Product Type
- 5.1.1 Custom Cable Assemblies
- 5.1.2 Standard / Off-the-Shelf Assemblies
- 5.1.3 Overmolded Cable Assemblies
- 5.1.4 Fiber-Optic Assemblies
- 5.1.5 Ribbon / Flat-Cable Assemblies
- 5.1.6 High-Speed and High-Freq Assemblies
- 5.2 By Cable Type
- 5.2.1 Coaxial
- 5.2.2 Fiber-Optic
- 5.2.3 Ribbon / Flat
- 5.2.4 Twisted-Pair / Networking
- 5.2.5 RF and Microwave
- 5.2.6 Power
- 5.3 By End-Use Industry
- 5.3.1 Automotive and Transportation
- 5.3.2 Telecommunications
- 5.3.3 Consumer Electronics
- 5.3.4 Industrial Automation and Robotics
- 5.3.5 Healthcare and Medical Devices
- 5.3.6 Aerospace and Defense
- 5.3.7 IT and Data Centers
- 5.3.8 Energy and Power
- 5.3.9 Rail and Mass Transit
- 5.4 By Application
- 5.4.1 Data Transfer and Communication
- 5.4.2 Power Transmission
- 5.4.3 RF / Microwave Signal
- 5.4.4 High-Performance Computing
- 5.4.5 Sensor and Control
- 5.4.6 Charging and Battery Management
- 5.4.7 Lighting and Display
- 5.5 By Geography
- 5.5.1 North America
- 5.5.1.1 United States
- 5.5.1.2 Canada
- 5.5.1.3 Mexico
- 5.5.2 South America
- 5.5.2.1 Brazil
- 5.5.2.2 Argentina
- 5.5.2.3 Rest of South America
- 5.5.3 Europe
- 5.5.3.1 Germany
- 5.5.3.2 United Kingdom
- 5.5.3.3 France
- 5.5.3.4 Russia
- 5.5.3.5 Rest of Europe
- 5.5.4 Asia-Pacific
- 5.5.4.1 China
- 5.5.4.2 Japan
- 5.5.4.3 India
- 5.5.4.4 South Korea
- 5.5.4.5 Australia
- 5.5.4.6 Rest of Asia-Pacific
- 5.5.5 Middle East
- 5.5.5.1 Saudi Arabia
- 5.5.5.2 United Arab Emirates
- 5.5.5.3 Rest of Middle East
- 5.5.6 Africa
- 5.5.6.1 South Africa
- 5.5.6.2 Egypt
- 5.5.6.3 Rest of Africa
- 5.5.1 North America
6 COMPETITIVE LANDSCAPE
- 6.1 Market Concentration
- 6.2 Strategic Moves
- 6.3 Market Share Analysis
- 6.4 Company Profiles (includes Global Level Overview, Market Level Overview, Core Segments, Financials as available, Strategic Information, Market Rank/Share, Products and Services, Recent Developments)
- 6.4.1 TE Connectivity Ltd.
- 6.4.2 Amphenol Corporation
- 6.4.3 Molex LLC
- 6.4.4 Luxshare Precision Industry Co., Ltd.
- 6.4.5 Yazaki Corporation
- 6.4.6 Aptiv PLC
- 6.4.7 Sumitomo Electric Industries, Ltd.
- 6.4.8 Rosenberger Hochfrequenztechnik GmbH & Co. KG
- 6.4.9 Carlisle Interconnect Technologies (Carlisle Companies Inc.)
- 6.4.10 Samtec, Inc.
- 6.4.11 HARTING Technology Group
- 6.4.12 JAE Electronics, Inc. (Japan Aviation Electronics Industry, Ltd.)
- 6.4.13 LEMO SA
- 6.4.14 Hirose Electric Co., Ltd.
- 6.4.15 Radiall SA
- 6.4.16 Belden Inc.
- 6.4.17 BizLink Holding Inc.
- 6.4.18 Nexans SA
- 6.4.19 W. L. Gore & Associates, Inc.
- 6.4.20 3M Company
7 MARKET OPPORTUNITIES AND FUTURE OUTLOOK
- 7.1 White-Space and Unmet-Need Assessment
 2026年全球數位電纜市場報告2026年全球機器人線束市場報告
 全球線束組件市場規模、佔有率、趨勢及成長分析報告(2026-2034年)
 電纜組件市場:按類型、連接器類型、絕緣材料、應用和最終用戶分類-2026-2032年全球市場預測開關型電纜分線盒市場:按類型、額定電壓、材料、應用、最終用戶、通路分類,全球預測(2026-2032年)
 2026-2030年全球電纜組件市場
 射頻電纜組件和跳線市場 - 全球產業規模、佔有率、趨勢、機會及預測(按電纜類型、最終用戶、地區和競爭格局分類,2021-2031年)UL/CSA認證電線電纜市場(按產品類型、額定電壓、材料、絕緣材料、導體數量、應用和最終用途分類)-2026-2032年全球預測光伏電纜線束市場按電纜類型、連接器類型、絕緣材料、安裝環境、系統電壓和應用分類-全球預測,2026-2032年
 電纜組件市場規模、佔有率和成長分析(按電纜類型、連接器類型、屏蔽、組裝、應用和地區分類)-2026-2033年產業預測