


 |
市場調查報告書
商品編碼
2062178
噪音監測:市場佔有率分析、產業趨勢與統計、成長預測(2026-2031)Noise Monitoring - Market Share Analysis, Industry Trends & Statistics, Growth Forecasts (2026 - 2031) |
||||||

※ 本網頁內容可能與最新版本有所差異。詳細情況請與我們聯繫。
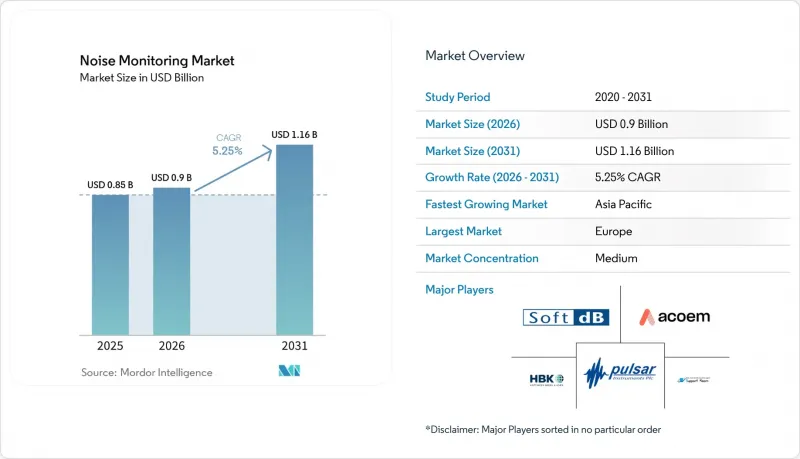
根據 Mordor Intelligence 預測,噪音監測市場規模將從 2025 年的 8.5 億美元和 2026 年的 9 億美元成長到 2031 年的 11.6 億美元,2026 年至 2031 年的複合年成長率為 5.25%。
本報告按組件(硬體、軟體、服務)、產品類型(固定/永久性、可攜式、穿戴式劑量計、遠端自助服務終端、其他)、技術(即時、物聯網、雲端分析、人工智慧驅動的預測分析、其他)、應用(建築、工業、其他)和地區進行細分。市場預測以美元計價。
全球噪音監測市場趨勢及洞察
加強環境噪音法規
新的法規正在將以往可選的監測轉變為採購要求。愛爾蘭的指導草案強制要求採用CNOSSOS-EU的調查方法、最新的輸入數據,並對放寬限制區域檢驗,從而推動了對高精度感測器和建模工具的需求成長。在美國,聯邦公路管理局提案在州一級建立庫存清單,並在±3dB範圍內進行模型檢驗,鼓勵各機構建立連續網路,將數據傳輸到經批准的軟體。紐約市等市政當局的法規,例如強制要求在2026年前實現自動化API上傳,進一步加速了雲端連接設備的普及。通過IEC 61672-1和EN ISO 3744:2010認證的供應商在公開競標中享有優先權。
智慧城市與城市擴張的發展
如今,噪音感測器正被整合到多參數平台中,這些平台還能追蹤交通、空氣品質和微氣候數據。巴塞隆納的「交通噪音」(TRAFFIC-NOISE)計畫利用聲學和視覺分析來即時管理交通堵塞,這表明市政當局正逐漸傾向於購買整合系統而非單一儀器。澳洲的「OpenAIR」計畫正在資助13個地方政府部署連網感測器,並採用開放協議以確保採購的前瞻性。早期採用者更傾向於選擇能夠提供現成API和儀錶板Widgets的供應商,這些組件可以整合到現有的城市管理系統中,從而推動了開源軟體的競爭格局。
較高的初始投資和維護成本
一級測量儀器、校準麥克風和安全雲端訂閱服務給小規模市政當局的預算帶來了沉重負擔。紐約市對符合特定安裝高度的戶外設備規範就是一個很好的例子,它顯示高性能硬體和定期重新校準是如何推高生命週期成本的。供應商正在透過訂閱模式來應對這一問題,將資本支出 (Capex) 轉化為營運支出 (OpEx),例如採礦業的車隊為基礎的定價模式。然而,在新興市場,精度較低的替代方案仍然普遍存在,這會導致資料缺失,而資料缺失會影響政策決策。
細分市場分析
隨著客戶對承包合規解決方案和分析服務的需求日益成長,服務領域的成長速度超過了硬體領域。儘管預計2025年設備銷售仍將主導噪音監測市場,但校準、雲端儀錶板和專家數據分析等循環合約的成長速度預計將超過設備銷售,從而提升整體服務市場佔有率。 Cirrus Research 的增強型 NoiseTools 套件就是一個很好的例子,它展示了軟體升級如何鞏固現有設備部署並創造提升銷售機會。歐洲環境署等政府機構正在撥出專項預算用於資料處理和機器學習試點項目,這進一步推動了對專家諮詢公司的需求。
服務供應商正利用長期合約將硬體租賃、遠端診斷和標準合規性審核捆綁在一起,從而減輕硬體更換週期對收入的影響。這種轉變使供應商的獎勵與客戶的實際利益保持一致,有助於提高噪音監測市場的利潤率並加強合作關係。
儘管固定監測網路對於繪製都市區噪音地圖仍然至關重要,但穿戴式式劑量計在職業健康項目中變得越來越普遍。在飛機維修、採礦和製造業等領域,對移動作業人員進行持續的噪音暴露追蹤,正在加速採用夾式感測器來記錄個人的聲音劑量。而建築工地,例如紐約市針對距離住宅50英尺範圍內的項目所製定的更嚴格的法規,仍然傾向於使用配備防風雨麥克風的堅固耐用的固定監測站。
穿戴式裝置透過驗證個人暴露限值是否達標,並為工作人員提供即時振動和聲音回饋,從而完善了這些網路。整合藍牙連接和雲端同步功能的供應商正將穿戴式裝置定位為企業安全平台的延伸,從而促進與區域監測器的資料共享,並擴大目標雜訊監測市場。
區域分析
歐洲透過《環境噪音指令》規定的五年報告週期和標準化的CNOSSOS-EU調查方法支持全球銷售,該方法要求各城市更新噪音地圖和公共行動計畫。義大利的高速公路降噪計畫和蘇格蘭的靜音區劃定等國家措施正在增強未來發展的前景。
亞太地區是成長最快的地區,這得益於智慧城市試點計畫和大型企劃的推動。澳洲的OpenAIR網路和雪梨科技大學的噪音攝影機偵測計畫是政府資助部署的典型案例,它們將低成本感測器與先進的分析功能結合。東南亞和印度的快速都市化進程正在推動越來越多的市政用戶尋求經濟實惠、可擴展的節點和雲端控制面板。
在北美,更新的聯邦指南和嚴格的城市法令正在推動市場成長。紐約市的持續監測法規正在促使採購工作即時展開,而聯邦公路管理局(FHWA)即將推出強制性庫存要求,使各州機構為未來多年的硬體和軟體採購做好準備。南美和中東及非洲地區的銷售額雖然落後於北美,但在礦區和基礎設施走廊等環境許可依賴持續噪音記錄的地區,市場正呈現成長動能。區域標準化正在推動對模組化平台的需求,這些平台允許韌體和報告模板的調整,而無需完全更換硬體,從而確保了噪音監測市場供應商的利潤率。
其他好處
- Excel格式的市場預測(ME)表
- 3個月的分析師支持
目錄
第1章:引言
- 研究假設和市場定義
- 調查範圍
第2章:調查方法
第3章執行摘要
第4章 市場狀況
- 市場概覽
- 市場促進因素
- 加強環境噪音法規
- 智慧城市與城市擴張的發展
- 擴大基礎建設項目
- 大眾對噪音對健康的影響日益關注。
- 與環境、社會及治理 (ESG) 相關的聲學監管要求
- 用於動態交通管理的即時噪音數據
- 市場限制因素
- 高昂的資本投資和維護成本
- 持續監測中的資料隱私挑戰
- 多廠商物聯網網路中的互通性差距
- 聲學資料分析人員短缺
- 產業價值鏈分析
- 宏觀經濟因素對市場的影響
- 監理情勢
- 技術展望
- 波特五力分析
第5章 市場規模與成長預測
- 按組件
- 硬體
- 軟體
- 服務
- 依產品類型
- 固定/永久噪音監測系統
- 可攜式噪音監測系統
- 穿戴式個人噪音劑量計
- 遠端噪音監測亭
- 其他
- 透過技術
- 即時的
- 相容物聯網
- 基於雲端的分析
- 人工智慧驅動的預測分析
- 其他
- 透過使用
- 建築工地及拆除工地
- 產業
- 交通樞紐和走廊
- 城市和區域噪音映射
- 採礦和能源業務
- 娛樂活動場地
- 其他
- 按地區
- 北美洲
- 美國
- 加拿大
- 墨西哥
- 歐洲
- 德國
- 英國
- 法國
- 義大利
- 西班牙
- 其他歐洲國家
- 亞太地區
- 中國
- 日本
- 印度
- 韓國
- 澳洲
- 其他亞太國家
- 南美洲
- 巴西
- 阿根廷
- 其他南美國家
- 中東和非洲
- 中東
- 沙烏地阿拉伯
- 阿拉伯聯合大公國
- 其他中東國家
- 非洲
- 南非
- 埃及
- 其他非洲地區
- 中東
- 北美洲
第6章 競爭情勢
- 市場集中度
- 策略趨勢
- 市佔率分析
- 公司簡介
- Hottinger Bruel & Kjaer GmbH
- Acoem Group
- Larson Davis(PCB Piezotronics)
- RION Co., Ltd.
- Svantek
- Cirrus Research
- NTi Audio
- Casella(IDEAL Industries)
- Pulsar Instruments Plc
- GRAS Sound and Vibration
- Norsonic AS
- Soft dB
- SINUS Messtechnik
- Extech Instruments(FLIR)
- TES Electrical Electronic Corp.
- AWA Instruments
- NoiseMeters Inc.
- Bruitparif
- 3M Personal Safety Division
- Castle Group Ltd.
第7章 市場機會與未來展望
According to Mordor Intelligence, the noise monitoring market size is projected to expand from USD 0.85 billion in 2025 and USD 0.90 billion in 2026 to USD 1.16 billion by 2031, registering a 5.25% CAGR between 2026 and 2031.
This report is Segmented by Component (Hardware, Software, and Services), Product Type (Fixed/Permanent, Portable, Wearable Dosimeters, Remote Kiosks, and More), Technology (Real-Time, IoT-Enabled, Cloud-Based Analytics, AI-Powered Predictive Analytics, and More), Application (Construction, Industrial, and More), and Geography. Market Forecasts are Provided in Terms of Value (USD).
Global Noise Monitoring Market Trends and Insights
Stricter Environmental Noise Regulations
New regulations convert once-optional monitoring into a procurement requirement. Ireland's draft guidance mandates CNOSSOS-EU methodology, recent input data, and validation of candidate mitigation areas, which expands demand for precision sensors and modeling tools. In the United States, the Federal Highway Administration proposes state-level inventories and model validation within +-3 dB, pushing agencies to deploy continuous networks that feed approved software. Municipal rules such as New York City's 2026 mandate for automated API uploads further accelerate the adoption of cloud-integrated devices. Vendors that certify to IEC 61672-1 and EN ISO 3744:2010 secure preferential status in public tenders.
Growth of Smart Cities and Urban Expansion
Noise sensors are now embedded within multiparameter platforms that also track traffic, air quality, and micro-climate data. Barcelona's TRAFFIC-NOISE project links acoustic and visual analytics to manage congestion in real time, illustrating how municipalities buy integrated stacks rather than stand-alone meters. Australia's OpenAIR program funds networked sensors across 13 local councils, using open protocols to future-proof procurement. Early adopters prefer suppliers offering ready-to-consume APIs and dashboard widgets that fit existing city operating systems, reshaping competition toward software openness.
High Capital and Maintenance Costs
Class 1 instrumentation, calibrated microphones, and secure cloud subscriptions strain small-city budgets. New York City's specification for outdoor-rated devices with compliant mounting heights illustrates how premium hardware and periodic recalibration inflate lifecycle cost. Vendors respond with subscription models that convert capex to opex, such as fleet-based pricing in the mining sector. Yet emerging markets still gravitate toward lower-accuracy alternatives, risking data gaps that undermine policy decisions.
Other drivers and restraints analyzed in the detailed report include:
- Expansion of Construction and Infrastructure Projects
- Rising Public Awareness of Noise-Related Health Impacts
- Data-Privacy Hurdles in Continuous Monitoring
For complete list of drivers and restraints, kindly check the Table Of Contents.
Segment Analysis
Services outpace hardware as clients seek turnkey compliance and analytics. Although equipment sales dominated the noise monitoring market in 2025, recurring contracts for calibration, cloud dashboards, and expert interpretation are forecast to grow faster, pushing the overall services share upward. Cirrus Research's expanded NoiseTools suite exemplifies how software upgrades anchor installed devices and create upsell paths. Government agencies such as the European Environment Agency earmark dedicated budgets for data processing and machine-learning pilots, reinforcing demand for specialized consultancies.
Service providers leverage long-term agreements to bundle hardware leasing, remote diagnostics, and standards compliance audits, buffering revenue against hardware refresh cycles. This migration aligns vendor incentives with customer outcomes, supporting higher margins and stickier relationships across the noise monitoring market.
Fixed networks remain indispensable for urban noise maps, yet wearable dosimeters are gaining traction in occupational health programs. Continuous exposure tracking for mobile workers in aviation maintenance, mining haulage, and manufacturing floors accelerates uptake of clip-on sensors that log personal sound dose. New regulations in construction hotspots, such as New York City's rule for projects within 50 feet of residences, still favour rugged fixed stations with weatherproof microphones.
Wearables complement these networks by confirming individual compliance with exposure limits and delivering real-time vibration or sound feedback to workers. Vendors integrating Bluetooth connectivity and cloud synchronization position wearables as an extension of enterprise safety platforms, smoothing data correlation with area monitors and widening the addressable noise monitoring market.
Geography Analysis
Europe anchors global revenues through the Environmental Noise Directive's five-year reporting cadence and standardized CNOSSOS-EU methodology, which obliges cities to refresh noise maps and public action plans. National initiatives such as Italy's highway abatement program and Scotland's designation of quiet areas reinforce pipeline visibility.
Asia-Pacific is the fastest-growing region, buoyed by smart-city pilots and megaprojects. Australia's OpenAIR network and the University of Technology Sydney's noise-camera trial exemplify government-funded deployments that blend low-cost sensors with advanced analytics. Rapid urbanization across Southeast Asia and India adds municipal customers focused on affordable, scalable nodes and cloud dashboards.
North America benefits from updated federal guidance and stringent city ordinances. New York City's continuous monitoring rule spurs immediate procurement, while the Federal Highway Administration's forthcoming inventory mandate primes state departments for multiyear hardware and software purchases. South America and the Middle East and Africa trail in revenue but show momentum in mining belts and infrastructure corridors where environmental permits hinge on continuous sound logging. Regional diversity in standards drives demand for modular platforms that adapt firmware and reporting templates without wholesale hardware swaps, safeguarding vendor margins within the noise monitoring market.
- Hottinger Bruel & Kjaer GmbH
- Acoem Group
- Larson Davis (PCB Piezotronics)
- RION Co., Ltd.
- Svantek
- Cirrus Research
- NTi Audio
- Casella (IDEAL Industries)
- Pulsar Instruments Plc
- G.R.A.S Sound and Vibration
- Norsonic AS
- Soft dB
- SINUS Messtechnik
- Extech Instruments (FLIR)
- TES Electrical Electronic Corp.
- AWA Instruments
- NoiseMeters Inc.
- Bruitparif
- 3M Personal Safety Division
- Castle Group Ltd.
Additional Benefits:
- The market estimate (ME) sheet in Excel format
- 3 months of analyst support
TABLE OF CONTENTS
1 INTRODUCTION
- 1.1 Study Assumptions and Market Definition
- 1.2 Scope of the Study
2 RESEARCH METHODOLOGY
3 EXECUTIVE SUMMARY
4 MARKET LANDSCAPE
- 4.1 Market Overview
- 4.2 Market Drivers
- 4.2.1 Stricter Environmental Noise Regulations
- 4.2.2 Growth of Smart Cities and Urban Expansion
- 4.2.3 Expansion of Construction and Infrastructure Projects
- 4.2.4 Rising Public Awareness of Noise-Related Health Impacts
- 4.2.5 ESG-Linked Acoustic Compliance Mandates
- 4.2.6 Real-Time Noise Data for Dynamic Traffic Management
- 4.3 Market Restraints
- 4.3.1 High Capital and Maintenance Costs
- 4.3.2 Data-Privacy Hurdles in Continuous Monitoring
- 4.3.3 Interoperability Gaps in Multi-Vendor IoT Networks
- 4.3.4 Shortage of Acoustic-Data Analytics Talent
- 4.4 Industry Value-Chain Analysis
- 4.5 Impact of Macroeconomic Factors on the Market
- 4.6 Regulatory Landscape
- 4.7 Technological Outlook
- 4.8 Porter's Five Forces Analysis
- 4.8.1 Threat of New Entrants
- 4.8.2 Bargaining Power of Suppliers
- 4.8.3 Bargaining Power of Buyers
- 4.8.4 Threat of Substitutes
- 4.8.5 Competitive Rivalry
5 MARKET SIZE AND GROWTH FORECASTS (VALUE)
- 5.1 By Component
- 5.1.1 Hardware
- 5.1.2 Software
- 5.1.3 Services
- 5.2 By Product Type
- 5.2.1 Fixed/Permanent Noise Monitoring Systems
- 5.2.2 Portable Noise Monitoring Systems
- 5.2.3 Wearable Personal Noise Dosimeters
- 5.2.4 Remote Noise Monitoring Kiosks
- 5.2.5 Other Product Types
- 5.3 By Technology
- 5.3.1 Real-Time Noise Monitoring
- 5.3.2 IoT-Enabled Smart Monitoring
- 5.3.3 Cloud-Based Noise Analytics Platforms
- 5.3.4 AI-Powered Predictive Acoustic Analytics
- 5.3.5 Other Technologies
- 5.4 By Application
- 5.4.1 Construction and Demolition Sites
- 5.4.2 Industrial Manufacturing Facilities
- 5.4.3 Transportation Hubs and Corridors
- 5.4.4 Urban / Community Noise Mapping
- 5.4.5 Mining and Energy Operations
- 5.4.6 Entertainment and Event Venues
- 5.4.7 Other Applications
- 5.5 By Geography
- 5.5.1 North America
- 5.5.1.1 United States
- 5.5.1.2 Canada
- 5.5.1.3 Mexico
- 5.5.2 Europe
- 5.5.2.1 Germany
- 5.5.2.2 United Kingdom
- 5.5.2.3 France
- 5.5.2.4 Italy
- 5.5.2.5 Spain
- 5.5.2.6 Rest of Europe
- 5.5.3 Asia-Pacific
- 5.5.3.1 China
- 5.5.3.2 Japan
- 5.5.3.3 India
- 5.5.3.4 South Korea
- 5.5.3.5 Australia
- 5.5.3.6 Rest of Asia-Pacific
- 5.5.4 South America
- 5.5.4.1 Brazil
- 5.5.4.2 Argentina
- 5.5.4.3 Rest of South America
- 5.5.5 Middle East and Africa
- 5.5.5.1 Middle East
- 5.5.5.1.1 Saudi Arabia
- 5.5.5.1.2 United Arab Emirates
- 5.5.5.1.3 Rest of Middle East
- 5.5.5.2 Africa
- 5.5.5.2.1 South Africa
- 5.5.5.2.2 Egypt
- 5.5.5.2.3 Rest of Africa
- 5.5.5.1 Middle East
- 5.5.1 North America
6 COMPETITIVE LANDSCAPE
- 6.1 Market Concentration
- 6.2 Strategic Moves
- 6.3 Market Share Analysis
- 6.4 Company Profiles (includes Global Level Overview, Market Level Overview, Core Segments, Financials as available, Strategic Information, Market Rank/Share, Products and Services, Recent Developments)
- 6.4.1 Hottinger Bruel & Kjaer GmbH
- 6.4.2 Acoem Group
- 6.4.3 Larson Davis (PCB Piezotronics)
- 6.4.4 RION Co., Ltd.
- 6.4.5 Svantek
- 6.4.6 Cirrus Research
- 6.4.7 NTi Audio
- 6.4.8 Casella (IDEAL Industries)
- 6.4.9 Pulsar Instruments Plc
- 6.4.10 G.R.A.S Sound and Vibration
- 6.4.11 Norsonic AS
- 6.4.12 Soft dB
- 6.4.13 SINUS Messtechnik
- 6.4.14 Extech Instruments (FLIR)
- 6.4.15 TES Electrical Electronic Corp.
- 6.4.16 AWA Instruments
- 6.4.17 NoiseMeters Inc.
- 6.4.18 Bruitparif
- 6.4.19 3M Personal Safety Division
- 6.4.20 Castle Group Ltd.
7 MARKET OPPORTUNITIES AND FUTURE OUTLOOK
- 7.1 White-Space and Unmet-Need Assessment

 噪音偵測與監測市場-2026-2032年全球市場預測
 聲級計市場規模、佔有率和成長分析:按產品類型、應用、技術、最終用戶、測量方法、分銷管道和地區分類-2026-2033年產業預測
 聲級計市場規模、佔有率、趨勢和預測:按類型、應用和地區分類,2026-2034 年
 射頻相位雜訊分析儀市場預測至2034年-按類型、最終用戶和地區分類的全球分析模組化相位雜訊分析儀市場預測至2034年-按類型、頻率範圍、應用和地區分類的全球分析
 聲級計市場分析及至2035年預測:依類型、產品類型、服務、技術、組件、應用、形式、設備及最終用戶分類
 噪音監測系統市場 - 全球產業規模、佔有率、趨勢、機會及預測(按監測系統、監測方法、組件、地區和競爭格局分類,2021-2031年)
 相位雜訊分析儀:全球市場佔有率和排名、總收入和需求預測(2025-2031 年)
 全球聲級計市場
 全球聲級計市場:市場規模、市場佔有率、趨勢分析(按類型和應用)、區域展望和未來預測(2024-2031)