


 |
市場調查報告書
商品編碼
2062108
網路靶場和模擬平台:市場佔有率分析、行業趨勢和統計數據、成長預測(2025-2030 年)Cyber Ranges And Simulation Platforms - Market Share Analysis, Industry Trends & Statistics, Growth Forecasts (2025 - 2030) |
||||||

※ 本網頁內容可能與最新版本有所差異。詳細情況請與我們聯繫。
根據 Mordor Intelligence 預測,網路靶場和類比平台市場預計將在 2025 年達到 23.7 億美元,並在 2030 年擴大到 50.2 億美元,複合年成長率將達到 16.2%,呈現強勁成長。
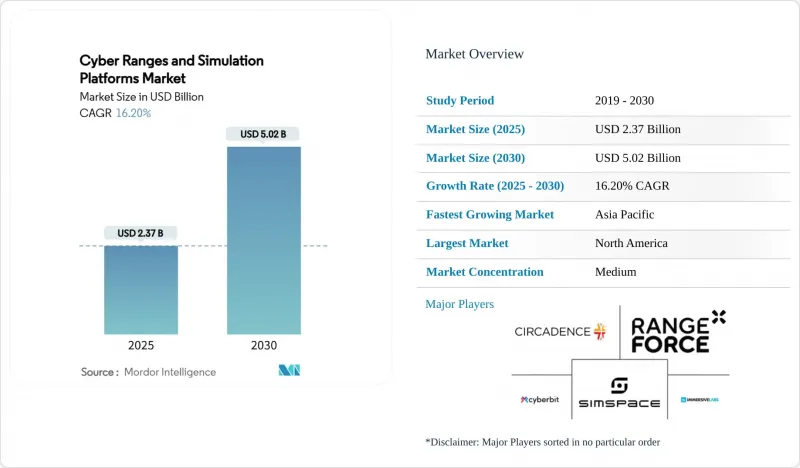
本報告按組件(軟體和服務)、靶場類型(模擬靶場、模擬靶場等)、部署模式(本地部署、雲端部署、混合部署)、最終用戶(國防和安全機構、銀行、金融服務和保險機構等)、應用(培訓和認證、威脅情報和分析等)以及地區進行細分。市場預測以美元計價。
全球網路靶場與模擬平台市場趨勢及洞察
針對關鍵基礎設施的網路攻擊頻率正在激增。
製造業、能源和交通運輸業者目前正面臨前所未有的勒索軟體攻擊,新加坡網路安全局記錄顯示,2023年共發生132起此類事件,主要目標為工業環境。這種不斷升級的情況推動了對包含真實控制器和感測器網路的營運技術(OT)靶場的需求。愛達荷國家實驗室擴展的工業控制系統(ICS)專案展示了真實設備如何提升場景的真實性。 「自由日蝕」(Liberty Eclipse)和「電網演習VII」(GridEx VII)等演習凸顯了網路安全團隊和電網營運商之間協調方面的不足,進一步強調了多學科模擬的必要性。能源營運商現在將網路安全培訓視為一項必要的安全措施,因為一次失敗的網路攻擊可能導致物理中斷。美國能源局的CyTRICS舉措透過在專用靶場對能源相關組件進行壓力測試來支持這一趨勢。
加強監管機構要求的網路回應培訓
金融監理機構要求的是基於實證的培訓,而不僅僅是政策清單。紐約州修訂後的《23 NYCRR 500》規定,銀行必須每年進行穿透測試和事件模擬。歐洲的《營運韌性評估條例》(DORA) 要求在整個地區進行統一的營運韌性測試。美國金融業監理局 (FINRA) 的 2025 年監管報告指出,人工智慧驅動的網路釣魚是最大的風險,並建議會員公司利用測試環境進行回應培訓。這些法規使得對能夠記錄參與者指標並產生可用於審計的證據的平台的需求持續成長,採購標準也從基於功能轉向基於結果記錄。
對身臨其境型物理範圍的大量初始投資
使用實際的交換器、PLC 和 SCADA 設備建造實體靶場的成本可能超過 100 萬美元。惠普的 Wolf Security 報告顯示,60% 的買家在設備採購過程中忽略了安全性,導致維修預算超支。工業買家還需要為設施配備電力、冷卻和保全措施,這使得純粹的實體建設對許多公司來說並不現實。雖然虛擬靶場可以降低成本,但某些動態場景(例如電網容錯移轉)仍然需要實體設備。這導致一些組織推遲投資或將部署限制在小範圍的試點項目中,阻礙了網路靶場和模擬平台市場的短期成長。
細分市場分析
軟體引擎在2024年佔總營收的57.3%,凸顯了虛擬機器管理程式、編配層和分析儀表板在建構逼真場景中的重要角色。在這一領域,人工智慧驅動的威脅生成和拖放式網路建構器正在縮短場景創建的前置作業時間。然而,企業擴大將這項繁重的工作外包出去。服務領域的複合年成長率高達18.1%,因為買家更傾向於承包的課程設計、即時指導和演練後的糾正指導。託管服務提供者採用持續學習循環,每週更新場景,確保場景的相關性,同時又不會增加內部人員的負擔。這種轉變表明,網路靶場和模擬平台市場正從以產品為中心的經濟模式轉向以結果為中心的經濟模式。
在實踐中,像 Cloud Range 這樣的供應商會將商業 SIEM、防火牆和 EDR 堆疊整合到其產品系列中,使藍隊能夠使用與實際生產環境相同的工具進行演練。演練後的分析會將績效數據轉換為經營團隊的指標,例如平均偵測時間 (MTD)。隨著這些洞察反映在風險儀表板中,更多首席資訊安全長 (CISO) 能夠更有力地證明續訂的合理性,從而增強了持續的收入來源,並有助於市場穩定。
由於實施成本低且可線性擴充性,虛擬模擬環境在2024年佔據了44.3%的市場。大學無需實體機架即可同時部署數百個學生模擬單元,而企業則利用模擬技術在授予新員工生產環境存取權之前對其進行認證。然而,將虛擬層與特定實體資產結合的混合設計正以17.3%的複合年成長率快速成長。例如,一家大型石油燃氣公司正在將實際的PLC機架整合到虛擬管道中,以模擬感測器延遲和訊號雜訊。這種組合方式無需在實驗室中建造整個工廠即可進行高保真演練。
疊加和模擬領域專注於協議級測試,在這些測試中,資料包時序或設備韌體的細微差別至關重要。雖然這些細分市場規模小規模,但由於需要專用設備和內容,因此價格往往很高。
區域分析
北美地區在聯邦預算充足和各州嚴格監管的支持下,2024年貢獻了38.3%的收入。美國能源部的OTDefender獎學金計畫正在向公共產業公司輸送畢業生,擴大了該地區對OT專用測試環境的需求。此外,雲端運算的廣泛普及進一步推動了商業性應用,並使中型企業能夠快速部署SaaS。加拿大和墨西哥透過跨國電網安全計畫參與其中,但與美國相比,它們的佔有率仍然很小。
亞太地區是成長最快的地區,預計到2030年複合年成長率將達到17.0%。新加坡網路防禦測試與評估中心為來自學術界、軍方和私營部門的團隊提供協調一致的存取管道。日本的「CyberKONGO2025」演習涵蓋17個國家,顯示該地區對聯盟內部互通性的濃厚興趣。同時,印度和中國正大力投資建置反映各自通訊技術的自主靶場,凸顯了網路靶場和模擬平台市場在地化的必要性。
在歐洲,透過遵守《網路防禦指令》(DORA)、開展聯合網路演習以及擴大國家網路靶場,網路安全領域正保持穩定發展動能。德國和法國優先發展國防應用,而英國則加速推動金融領域的演習。歐洲網路安全組織 (ECSO) 的功能清單有助於供應商之間的比較,並推動市場走向互通性。在中東和非洲其他地區,買家則專注於能源和通訊安全,並利用海灣國家和南非的政府資助計畫來加速本地人才培養。
其他好處:
- Excel格式的市場預測(ME)表
- 3個月的分析師支持
目錄
第1章:引言
- 研究假設和市場定義
- 調查範圍
第2章:調查方法
第3章執行摘要
第4章 市場狀況
- 市場概覽
- 市場促進因素
- 針對關鍵基礎設施的網路攻擊頻率正在激增。
- 監管機構加強網路安全緊急應變培訓。
- 在國防領域引入數位雙胞胎進行任務演練
- 雲端原生配送模式降低了中小企業的總擁有成本。
- 由生成式人工智慧驅動的威脅模擬加速器
- 與 5G/OT 測試平台整合,實現統一安全
- 市場限制因素
- 打造身臨其境型實體體驗區需要大量的初始投資。
- 熟練的網路靶場內容開發人員短缺
- 專有測距協定棧之間的互通性差距
- 跨國範圍共用中的資料主權問題
- 價值鏈分析
- 監理情勢
- 技術展望
- 波特五力分析
- 宏觀經濟因素對市場的影響
第5章 市場規模與成長預測
- 按組件
- 軟體
- 服務
- 微波爐類型
- 模擬範圍
- 模擬範圍
- 油電混合系列
- 疊加範圍
- 部署模式
- 現場
- 基於雲端的
- 混合
- 最終用戶
- 國防和安全機構
- BFSI
- 資訊科技/通訊
- 衛生保健
- 工業和關鍵基礎設施
- 教育和培訓機構
- 其他最終用戶
- 透過使用
- 培訓和認證
- 威脅情報與分析
- 研發/測試
- 合規性與評估
- 按地區
- 北美洲
- 美國
- 加拿大
- 墨西哥
- 南美洲
- 巴西
- 阿根廷
- 智利
- 其他南美國家
- 歐洲
- 德國
- 英國
- 法國
- 義大利
- 西班牙
- 其他歐洲國家
- 亞太地區
- 中國
- 日本
- 印度
- 韓國
- 澳洲
- 新加坡
- 馬來西亞
- 其他亞太國家
- 中東和非洲
- 中東
- 沙烏地阿拉伯
- 阿拉伯聯合大公國
- 土耳其
- 其他中東國家
- 非洲
- 南非
- 奈及利亞
- 其他非洲國家
- 中東
- 北美洲
第6章 競爭情勢
- 市場集中度
- 策略趨勢
- 市佔率分析
- 公司簡介
- SimSpace Corporation
- Cyberbit Ltd.
- RangeForce Inc.
- Immersive Labs Ltd.
- Circadence Corporation
- ThreatGEN LLC
- Offensive Security Services, LLC
- Raytheon Intelligence and Space
- Lockheed Martin Corporation
- Northrop Grumman Corporation
- CAE Inc.
- L3Harris Technologies, Inc.
- IBM Corporation
- Airbus Defence and Space SAS
- Atos SE
- Science Applications International Corp.
- Leidos Holdings, Inc.
- Thales Group
- Mandiant(a Google LLC company)
- Palo Alto Networks, Inc.
第7章 市場機會與未來展望
According to Mordor Intelligence, the cyber ranges and simulation platforms market size reached USD 2.37 billion in 2025 and is forecast to advance to USD 5.02 billion by 2030, posting a sturdy 16.2% CAGR.
This report is Segmented by Component (Software and Services), Range Type (Simulation Range, Emulation Range, and More), Deployment Mode (On-Premises, Cloud-Based, and Hybrid), End-User (Defense and Security Agencies, BFSI, and More), Application (Training and Certification, Threat Intelligence and Analysis, and More), and Geography. The Market Forecasts are Provided in Terms of Value (USD).
Global Cyber Ranges And Simulation Platforms Market Trends and Insights
Surging Cyber-Attack Frequency Across Critical Infrastructure
Manufacturing, energy, and transport operators now experience record ransomware volumes, with Singapore's Cyber Security Agency logging 132 incidents in 2023 that mainly struck industrial environments. This escalation propels demand for operational-technology ranges embedding real controllers and sensor networks. Idaho National Laboratory's expanded ICS programs illustrate how authentic equipment enriches scenario fidelity. Exercises such as Liberty Eclipse and GridEx VII underline coordination gaps between cyber teams and grid operators, reinforcing the need for multi-disciplinary simulations. Energy utilities now view cyber training as a safety imperative because failures can trigger physical disruptions. The U.S. Department of Energy's CyTRICS initiative confirms the trend by stress-testing energy components inside purpose-built ranges.
Escalating Regulatory-Mandated Cyber-Readiness Drills
Financial watchdogs require evidence-based drills rather than policy checklists. New York's updated 23 NYCRR 500 forces banks to run penetration tests and incident simulations each year. Europe's DORA imposes harmonised operational-resilience testing across the bloc. FINRA's 2025 oversight report flags AI-enabled phishing as a top risk and advises member firms to use ranges for response rehearsals. These rules generate continuous demand for platforms that log participant metrics and produce audit-ready evidence, shifting buying criteria from feature lists to outcome documentation.
High Capital Outlay for Immersive Physical Ranges
Building physical ranges with real switches, PLCs, and SCADA equipment can top USD 1 million. HP's Wolf Security report shows that 60% of buyers overlook security during device procurement, inflating retrofit budgets. Industrial buyers must also fund power, cooling, and secure facilities, making pure physical builds untenable for many. Virtualised ranges reduce spend, yet certain kinetic scenarios-such as power-grid failovers-still require tangible gear. Organisations therefore delay investment or adopt limited-scope pilots, restraining near-term growth in the cyber ranges and simulation platforms market.
Other drivers and restraints analyzed in the detailed report include:
- Defense Digital-Twin Adoption for Mission Rehearsal
- Cloud-Native Range Delivery Lowers TCO for SMEs
- Shortage of Skilled Cyber-Range Content Developers
For complete list of drivers and restraints, kindly check the Table Of Contents.
Segment Analysis
Software engines delivered 57.3% of 2024 revenue, underscoring the role of hypervisors, orchestration layers, and analytics dashboards in building realism. Within this domain, AI-assisted threat generation and drag-and-drop network builders reduce scenario lead times. However, enterprises increasingly outsource the heavy lifting. The services segment is tracking an 18.1% CAGR as buyers prefer turnkey curriculum design, live coaching, and post-exercise remediation guidance. Managed providers operate continuous-learning cycles where scenarios update weekly, ensuring relevance without internal headcount strain. This pivot signals that the cyber ranges and simulation platforms market is maturing from a product to an outcome economy.
In practice, providers like Cloud Range embed commercial SIEM, firewall, and EDR stacks inside their ranges so that blue teams rehearse using the same tooling seen in production. Post-event analytics translate performance data into board-level metrics such as mean-time-to-detect. As these insights feed risk dashboards, more CISOs justify subscription renewals, fortifying recurring revenue streams that underpin market stability.
Virtual simulation ranges held 44.3% of the 2024 share thanks to their low entry cost and linear scalability. Universities deploy hundreds of concurrent student pods without physical racks, while enterprises use simulation to certify new hires before granting production access. Yet hybrid designs that marry virtual layers with select physical assets are scaling fastest at 17.3% CAGR. Oil-and-gas majors, for instance, insert actual PLC racks into virtual pipelines to emulate sensor latency and signal noise. The combination supports high-fidelity rehearsals without building entire plants in a lab.
Overlay and emulation ranges cater to niche, protocol-level testing where packet timing or device firmware nuances are mission-critical. Although smaller in absolute dollars, these niches often command premium pricing because of specialised equipment and content.
Geography Analysis
North America generated 38.3% of 2024 revenue, anchored by generous federal budgets and stringent state-level regulations. The Department of Energy's OTDefender fellowship funnels graduates into utilities, amplifying local demand for OT-focused ranges. Commercial adoption is further propelled by widespread cloud readiness, enabling rapid SaaS onboarding across mid-market firms. Canada and Mexico participate through cross-border grid-security programmes, though their share is modest relative to the United States.
Asia-Pacific is the fastest-growing theatre at 17.0% CAGR to 2030. Singapore's Cyber Defence Test and Evaluation Centre offers federated access to academic, military, and private-sector teams. Japan's CyberKONGO2025 exercise spans 17 nations and demonstrates regional appetite for coalition interoperability. Meanwhile, India and China channel national-security investments into sovereign ranges that reflect unique telecommunications stacks, underscoring localisation imperatives within the cyber ranges and simulation platforms market.
Europe maintains steady momentum under DORA compliance, joint cyber exercises, and national range build-outs. Germany and France prioritise defence applications, while the UK accelerates financial-sector drills. ECSO's feature checklist fosters vendor comparison, nudging the market towards interoperability. Elsewhere, Middle East and Africa buyers emphasise energy and telecom protection, leveraging government-funded programmes in the Gulf and South Africa to jump-start local talent pipelines.
- SimSpace Corporation
- Cyberbit Ltd.
- RangeForce Inc.
- Immersive Labs Ltd.
- Circadence Corporation
- ThreatGEN LLC
- Offensive Security Services, LLC
- Raytheon Intelligence and Space
- Lockheed Martin Corporation
- Northrop Grumman Corporation
- CAE Inc.
- L3Harris Technologies, Inc.
- IBM Corporation
- Airbus Defence and Space SAS
- Atos SE
- Science Applications International Corp.
- Leidos Holdings, Inc.
- Thales Group
- Mandiant (a Google LLC company)
- Palo Alto Networks, Inc.
Additional Benefits:
- The market estimate (ME) sheet in Excel format
- 3 months of analyst support
TABLE OF CONTENTS
1 INTRODUCTION
- 1.1 Study Assumptions and Market Definition
- 1.2 Scope of the Study
2 RESEARCH METHODOLOGY
3 EXECUTIVE SUMMARY
4 MARKET LANDSCAPE
- 4.1 Market Overview
- 4.2 Market Drivers
- 4.2.1 Surging cyber-attack frequency across critical infrastructure
- 4.2.2 Escalating regulatory-mandated cyber-readiness drills
- 4.2.3 Defense digital-twin adoption for mission rehearsal
- 4.2.4 Cloud-native range delivery lowers TCO for SMEs
- 4.2.5 Generative-AI powered threat emulation accelerators
- 4.2.6 Integration with 5G/OT testbeds for converged security
- 4.3 Market Restraints
- 4.3.1 High capital outlay for immersive physical ranges
- 4.3.2 Shortage of skilled cyber-range content developers
- 4.3.3 Inter-operability gaps between proprietary range stacks
- 4.3.4 Data-sovereignty concerns in cross-border range sharing
- 4.4 Value Chain Analysis
- 4.5 Regulatory Landscape
- 4.6 Technological Outlook
- 4.7 Porter's Five Forces Analysis
- 4.7.1 Threat of New Entrants
- 4.7.2 Bargaining Power of Buyers
- 4.7.3 Bargaining Power of Suppliers
- 4.7.4 Threat of Substitutes
- 4.7.5 Intensity of Competitive Rivalry
- 4.8 Impact of Macroeconomic Factors on the Market
5 MARKET SIZE AND GROWTH FORECASTS (VALUES)
- 5.1 By Component
- 5.1.1 Software
- 5.1.2 Services
- 5.2 By Range Type
- 5.2.1 Simulation Range
- 5.2.2 Emulation Range
- 5.2.3 Hybrid Range
- 5.2.4 Overlay Range
- 5.3 By Deployment Mode
- 5.3.1 On-Premises
- 5.3.2 Cloud-Based
- 5.3.3 Hybrid
- 5.4 By End-user
- 5.4.1 Defense and Security Agencies
- 5.4.2 BFSI
- 5.4.3 IT and Telecom
- 5.4.4 Healthcare
- 5.4.5 Industrial and Critical Infrastructure
- 5.4.6 Academic and Training Institutes
- 5.4.7 Other End-users
- 5.5 By Application
- 5.5.1 Training and Certification
- 5.5.2 Threat Intelligence and Analysis
- 5.5.3 Research and Development / Testing
- 5.5.4 Compliance and Assessment
- 5.6 By Geography
- 5.6.1 North America
- 5.6.1.1 United States
- 5.6.1.2 Canada
- 5.6.1.3 Mexico
- 5.6.2 South America
- 5.6.2.1 Brazil
- 5.6.2.2 Argentina
- 5.6.2.3 Chile
- 5.6.2.4 Rest of South America
- 5.6.3 Europe
- 5.6.3.1 Germany
- 5.6.3.2 United Kingdom
- 5.6.3.3 France
- 5.6.3.4 Italy
- 5.6.3.5 Spain
- 5.6.3.6 Rest of Europe
- 5.6.4 Asia-Pacific
- 5.6.4.1 China
- 5.6.4.2 Japan
- 5.6.4.3 India
- 5.6.4.4 South Korea
- 5.6.4.5 Australia
- 5.6.4.6 Singapore
- 5.6.4.7 Malaysia
- 5.6.4.8 Rest of Asia-Pacific
- 5.6.5 Middle East and Africa
- 5.6.5.1 Middle East
- 5.6.5.1.1 Saudi Arabia
- 5.6.5.1.2 United Arab Emirates
- 5.6.5.1.3 Turkey
- 5.6.5.1.4 Rest of Middle East
- 5.6.5.2 Africa
- 5.6.5.2.1 South Africa
- 5.6.5.2.2 Nigeria
- 5.6.5.2.3 Rest of Africa
- 5.6.5.1 Middle East
- 5.6.1 North America
6 COMPETITIVE LANDSCAPE
- 6.1 Market Concentration
- 6.2 Strategic Moves
- 6.3 Market Share Analysis
- 6.4 Company Profiles (includes Global level Overview, Market level overview, Core Segments, Financials as available, Strategic Information, Market Rank/Share for key companies, Products and Services, and Recent Developments)
- 6.4.1 SimSpace Corporation
- 6.4.2 Cyberbit Ltd.
- 6.4.3 RangeForce Inc.
- 6.4.4 Immersive Labs Ltd.
- 6.4.5 Circadence Corporation
- 6.4.6 ThreatGEN LLC
- 6.4.7 Offensive Security Services, LLC
- 6.4.8 Raytheon Intelligence and Space
- 6.4.9 Lockheed Martin Corporation
- 6.4.10 Northrop Grumman Corporation
- 6.4.11 CAE Inc.
- 6.4.12 L3Harris Technologies, Inc.
- 6.4.13 IBM Corporation
- 6.4.14 Airbus Defence and Space SAS
- 6.4.15 Atos SE
- 6.4.16 Science Applications International Corp.
- 6.4.17 Leidos Holdings, Inc.
- 6.4.18 Thales Group
- 6.4.19 Mandiant (a Google LLC company)
- 6.4.20 Palo Alto Networks, Inc.
7 MARKET OPPORTUNITIES AND FUTURE OUTLOOK
- 7.1 White-space and Unmet-Need Assessment

 入侵和攻擊模擬市場:按組件、使用模型、定價模式、安全類型、最終用戶、交付方式和組織規模分類——2026-2032年全球市場預測
 入侵和攻擊模擬市場規模、佔有率和成長分析:按產品/服務、部署方式、應用領域、組織規模、最終用戶產業和地區分類-2026-2033年產業預測
 自動化入侵與攻擊模擬市場:按組件、部署模型、攻擊模擬類型、企業規模和最終用戶產業分類-市場規模、產業動態、機會分析和預測(2026-2035 年)
 2026年全球網實整合威脅模擬市場報告2026年全球自動化入侵與攻擊模擬市場報告
 2025-2030年全球自動化安全檢驗(ASV)市場Frost Radar ™:自動化安全檢驗,2026 年
 自動化入侵與攻擊模擬市場分析及預測(至 2035 年):按類型、產品、服務、技術、組件、應用、部署模式、最終用戶、解決方案和模式分類入侵和攻擊模擬軟體市場:按組件、部署模式、用例、組織規模和垂直行業分類的全球預測(2026-2032 年)按服務模式、部署類型、測試頻率、測試類型、組織規模和垂直行業分類的入侵和攻擊模擬平台市場 - 全球預測,2026-2032 年