


 |
市場調查報告書
商品編碼
2062045
身臨其境型分析:市場佔有率分析、產業趨勢與統計、成長預測(2026-2031)Immersive Analytics - Market Share Analysis, Industry Trends & Statistics, Growth Forecasts (2026 - 2031) |
||||||

※ 本網頁內容可能與最新版本有所差異。詳細情況請與我們聯繫。
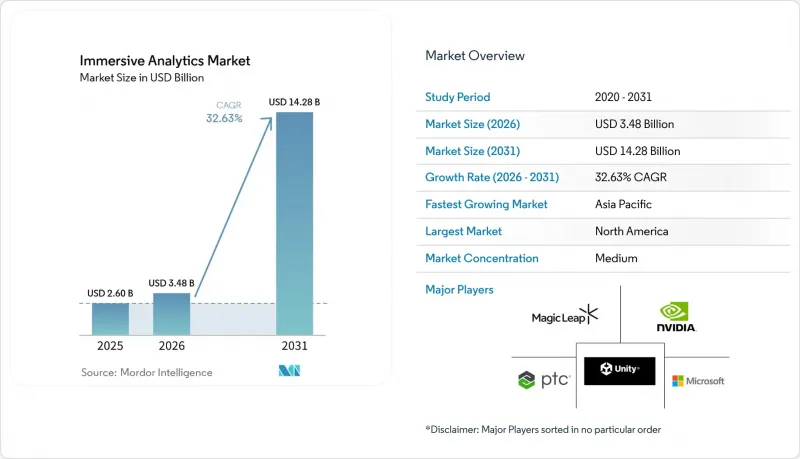
根據 Mordor Intelligence 預測,身臨其境型分析市場將從 2025 年的 26 億美元成長到 2026 年的 34.8 億美元,到 2031 年達到 142.8 億美元。
預計從 2026 年到 2031 年,其複合年成長率將達到 32.63%。
本報告按組件(軟體、硬體、服務)、技術(擴增實境(AR) 等)、部署模式(雲端、本地部署等)、互動方式(基於手勢等)、最終用戶行業(醫療保健與生命科學、製造與工業、零售與電子商務等)以及地區進行細分。市場預測以美元 (USD) 為單位。
全球身臨其境型分析市場趨勢與洞察
加速企業採用數位雙胞胎技術
實體資產與虛擬副本的近即時同步正在將數位雙胞胎轉變為用於身臨其境型分析的即時數據平台。結合物聯網遙測、模擬和3D視覺化技術的製造商已實現了18個月的平均投資回收期,是傳統儀錶板的兩倍。隨著ABB Genix等平台的出現,警報延遲已縮短至兩秒以內,使維修團隊能夠在停機前疊加設備故障機率。包括日本「Ouranos生態系統」在內的政府主導舉措正在解決工廠間的互通性,從而實現跨國部署而非孤立的先導計畫。因此,那些改進了數據同化演算法,能夠將稀疏感測器數據與物理模型融合的供應商將在身臨其境型分析市場中脫穎而出。
XR頭戴式顯示器的單價較低
企業級混合實境(MR) 頭戴裝置的售價如今已遠低於 2022 年的價格。 Meta Quest 3 提供工作站級別的圖像質量,售價卻不到 500 美元;而像 Apple Vision Pro 這樣的高階機型也證明,即使是配備高品質光學系統的產品,年銷量也能達到百萬台。顯示器製造商正在改造智慧型手機 OLED 生產線,以超越莫耳定律的速度加速價格下降。如今,MR 頭顯的成本已與加固型平板電腦相當,零售、教育和建築等行業的中型企業終於可以將其部署到整個團隊,從而實現大規模訂購,推動身臨其境型分析市場遠遠超越試點規模。
生產人員短缺
由於空間設計、資料工程和領域知識很少能在同一職位上同時具備,企業很難將2D儀錶板轉化為身臨其境型佈局。儘管歐盟的 XR2Learn 等計畫旨在擴大人才儲備,但其人才培育速度仍無法滿足市場需求。即使微軟 Mesh 配備了無程式碼編輯器,企業仍需要聘請 Unity 和 Unreal 專家進行微調,這造成了專案瓶頸。由於大學往往專注於長條圖和散點圖,因此再培訓至關重要。在人才庫擴大之前,招募成本和前置作業時間將減緩身臨其境型分析技術的普及,並拖慢其成長速度。
細分市場分析
2025年,隨著訂閱平台直接整合到企業資料倉儲中,軟體將佔據身臨其境型分析市場51.78%的佔有率。供應商發布了將3D畫布嵌入Tableau和Power BI的插件,使分析師無需切換工具。部署專案通常涉及將傳統SQL轉換為空間查詢,從而推動業務收益達到兩位數成長。隨著企業需要變更管理藍圖、增強安全性和客製化工作流程邏輯,身臨其境型分析服務市場預計將以33.23%的複合年成長率快速成長。雖然硬體對於光學、感測器和運算能力仍然至關重要,但自帶頭戴式裝置(BYH)政策正在減緩資本支出成長,並將價值轉移到軟體生態系統。
持續的中介軟體創新也是軟體優勢的基石。 Unity 的機器人連接器能夠以 99.99% 的準確率同步真實世界的遙測資料和場景圖,讓工廠無需重構程式碼即可查看更新後的數位雙胞胎模型。 Immersion Analytics 擁有分層發光和半透明技術的專利,該技術可同時顯示六個變數而不會造成資訊混淆。隨著低程式碼創建模板的日益普及,身臨其境型分析市場的軟體留存率將超過硬體更換週期,從而強化以訂閱為中心的收入模式。
到2025年,擴增實境(AR)將佔據44.82%的市場佔有率,這主要得益於免手持疊加顯示技術的發展,該技術允許現場工作人員將手冊和品質指標疊加顯示在機械設備上。然而,混合實境(MR)的身臨其境型分析市場預計將以33.03%的複合年成長率更快成長,因為將感測器數據與3D模擬融合可以實現預測性任務,例如透過將變電站的數位雙胞胎模型與熱數據相結合來檢測變壓器應力。虛擬實境(VR)在飛行員和外科醫生培訓中仍然很受歡迎,因為外部干擾會影響注意力,但其封閉的環境限制了需要情境資訊的操作儀錶板的使用。
設備藍圖表明,各種模式正在融合而非競爭。 Apple Vision Pro 用戶可以將分析儀表板與實體便籤並排固定,而 Meta 專注於開放的 Quest 硬體,使得第三方開發者能夠支援任何身臨其境型場景。因此,企業對設備同步的需求日益成長,供應商也被迫建立雲端協作層,以在VR頭戴裝置、 AR 眼鏡甚至 2D 瀏覽器之間切換會話時保持狀態。這種互通性將成為身臨其境型分析市場競爭者的關鍵需求。
區域分析
預計到2025年,北美將佔全球收入的35.62%,這得益於聯邦預算撥款將數位雙胞胎整合到交通安全研究和國防測試環境中。兩黨共同支持的《身臨其境型技術領導法案》正在將這項技術提升至國家競爭力水平,從而促進津貼和跨機構合作。加拿大礦業和林業從業者正依靠身臨其境型地下模型來安全地定位遠端作業人員,而墨西哥的一個汽車產業叢集則將空間品質儀表板直接整合到SAP系統和生產線上。企業買家也受益於高密度5G部署和託管低延遲渲染叢集的超大規模雲端節點。
亞太地區預計將成為成長最快的地區,到2031年複合年成長率將達到33.74%。日本的「PLATEAU」計畫已為236個市町村提供了3D城市模型,並計畫在2027年將覆蓋範圍擴大到500個市町村。這是一個公共資料資產,可用於城市災害模擬和基礎設施規劃。在中國上海,孿生地圖正被用於管理廢棄物收集和電動自行車充電,並為流行病學分析提供數據,展示了城市規模的應用案例。印度的Jio True5G網路目前已覆蓋5500個城市,即使在偏遠的變電站也能實現身臨其境型現場服務疊加。韓國和澳洲正在投資智慧工廠和採礦孿生技術,從而推動全部區域的成長勢頭。
預計到2025年,歐洲在全球數位世界中的佔有率將處於中等水平,但受政策利好因素的影響,其佔有率有望加速成長。 「歐洲虛擬世界夥伴關係」已聯合出資2億歐元(約2.26億美元),「數位歐洲測試平台」也已投資1,700萬歐元(約1,920萬美元)用於跨境沙盒計畫。這些項目強制推行開放標準API,從而促進供應商中立性並增強買家信心。比利時、芬蘭和荷蘭的「x-CITE CitiVerse」等試點計畫讓公民以3D形式查看分區規劃方案,加深公眾理解。南美洲、中東和非洲在絕對支出方面落後於歐洲,但它們正利用主權財富基金以及石油、天然氣和採礦等資源行業的應用案例,為可在全部區域推廣的開創性項目資金籌措。
其他好處:
- Excel格式的市場預測(ME)表
- 3個月的分析師支持
目錄
第1章:引言
- 研究假設和市場定義
- 調查範圍
第2章:調查方法
第3章執行摘要
第4章 市場狀況
- 市場概覽
- 市場促進因素
- 加速企業採用數位雙胞胎技術
- XR頭戴式顯示器的單價較低
- 5G和邊緣運算基礎設施的擴展
- 整合生成式人工智慧以獲得即時洞察
- 開放原始碼空間分析框架的成熟
- 工業IoT平台分析能力的提升
- 市場限制因素
- 作家短缺
- 硬體相關的動暈症和疲勞
- XR資料的企業安全標準尚不成熟
- 特定領域工作流程的客製化成本很高
- 宏觀經濟因素對市場的影響
- 產業價值鏈分析
- 監理情勢
- 技術展望
- 波特五力分析
第5章 市場規模與成長預測
- 按組件
- 軟體
- 硬體
- 服務
- 透過技術
- 擴增實境(AR)
- 虛擬實境(VR)
- 混合實境(MR)
- 3D桌面/空間計算顯示器
- 按部署模式
- 雲
- 現場
- 邊緣/設備端
- 互動方法
- 基於手勢
- 語音/NLP
- 眼動追蹤
- 觸覺/力回饋
- 多模態融合
- 按最終用戶行業分類
- 醫療保健和生命科學
- 製造業和工業
- 零售與電子商務
- 能源公用事業
- 教育/研究
- 媒體、娛樂、體育
- 國防/航太
- 金融服務
- 按地區
- 北美洲
- 美國
- 加拿大
- 墨西哥
- 南美洲
- 巴西
- 阿根廷
- 其他南美國家
- 歐洲
- 英國
- 德國
- 法國
- 義大利
- 其他歐洲國家
- 亞太地區
- 中國
- 日本
- 印度
- 韓國
- 其他亞太國家
- 中東和非洲
- 中東
- 阿拉伯聯合大公國
- 沙烏地阿拉伯
- 其他中東國家
- 非洲
- 南非
- 埃及
- 其他非洲國家
- 中東
- 北美洲
第6章 競爭情勢
- 市場集中度
- 策略趨勢
- 市佔率分析
- 公司簡介
- Microsoft Corporation
- NVIDIA Corporation
- Unity Software Inc.
- Magic Leap, Inc.
- PTC Inc.
- Alphabet Inc.(Google)
- Apple Inc.
- Meta Platforms, Inc.
- Siemens AG
- Dassault Systemes SE
- Varjo Technologies Oy
- HTC Corporation
- Qualcomm Technologies, Inc.
- Lenovo Group Limited
- Amazon Web Services, Inc.
- Autodesk, Inc.
- Ultraleap Ltd.
- Ultrahaptics IP Two Limited
- CrunchFish AB
- Tobii AB
第7章 市場機會與未來展望
According to Mordor Intelligence, the immersive analytics market size is expected to increase from USD 2.6 billion in 2025 to USD 3.48 billion in 2026 and reach USD 14.28 billion by 2031, growing at a CAGR of 32.63% over 2026-2031.
This report is Segmented by Component (Software, Hardware, and Services), Technology (Augmented Reality, and More), Deployment Model (Cloud, On-Premises, and More), Interaction Modality (Gesture-Based, and More), End-User Industry (Healthcare and Life Sciences, Manufacturing and Industrial, Retail and E-Commerce, and More), and Geography. The Market Forecasts are Provided in Terms of Value (USD).
Global Immersive Analytics Market Trends and Insights
Accelerating Enterprise Digital Twins Adoption
Near-real-time synchronization of physical assets with virtual replicas is turning digital twins into a live data substrate for immersive analytics. Manufacturers that combined IoT telemetry, simulation, and 3D visualization recorded median payback periods of 18 months, twice as fast as legacy dashboards. Platform launches such as ABB Genix deliver sub-2-second alerting latencies, so maintenance crews can overlay failure probabilities on equipment before downtime occurs. Government-backed initiatives, including Japan's Ouranos Ecosystem, are addressing cross-factory interoperability, enabling multinational deployments rather than isolated pilots. As a result, vendors that refine data-assimilation algorithms to fuse sparse sensors with physics models will stand out in the immersive analytics market.
Falling Unit Costs of XR Head-Mounted Displays
Enterprise-grade mixed-reality headsets now retail for a fraction of 2022 prices. Meta Quest 3 ships for under USD 500 yet rivals workstation-class visuals, and high-end options such as the Apple Vision Pro have proved that premium optics can still move one million units in one year. Display makers are reutilizing smartphone OLED fabs, pushing price declines faster than Moore's Law. Cost parity with rugged tablets means mid-market firms in retail, education, and construction can finally equip entire teams, unlocking volume orders that lift the immersive analytics market far beyond pilot scale.
Limited Availability of Authoring Talent
Spatial design, data engineering, and domain knowledge rarely coexist in one role, so enterprises struggle to convert 2D dashboards into immersive layouts. European Union programs such as XR2Learn aim to widen the pipeline, but will not graduate cohorts fast enough to meet demand. Even with no-code editors in Microsoft Mesh, firms still hire Unity or Unreal specialists for fine-tuning, creating project bottlenecks. Universities focus on bar charts and scatter plots, so retraining is essential. Until the talent pool deepens, hiring costs and lead times will slow rollouts and shave points off the growth of the immersive analytics market.
Other drivers and restraints analyzed in the detailed report include:
- Expansion of 5G and Edge Computing Infrastructure
- Integration of Generative AI for Real-Time Insights
- Hardware-Induced Motion Sickness and Fatigue
For complete list of drivers and restraints, kindly check the Table Of Contents.
Segment Analysis
Software accounted for 51.78% of the immersive analytics market in 2025 as subscription platforms integrated directly into enterprise data warehouses. Vendors released plug-ins that embed 3D canvases inside Tableau and Power BI so analysts avoid switching tools. Implementation projects often involve translating legacy SQL into spatial queries, which drive double-digit growth in service revenue. The immersive analytics services market is projected to grow briskly, with a 33.23% CAGR, as organizations need change management roadmaps, security hardening, and custom workflow logic. Hardware remains essential for optics, sensors, and compute, yet bring-your-own-headset policies dampen capital-expenditure growth and shift value to software ecosystems.
Ongoing middleware innovation also sustains the software lead. Unity's robotics connector synchronizes real-world telemetry with scene graphs at 99.99% accuracy, allowing factories to see updated digital twins without code refactoring. Immersion Analytics patented layered glow and translucency techniques that display half a dozen variables at once without information collapse. As low-code authoring templates become commonplace, the immersive analytics market will see software retention rates edge higher than hardware refresh cycles, reinforcing a subscription-centric revenue mix.
Augmented reality held 44.82% share in 2025 because line workers value hands-free overlays that superimpose manuals or quality metrics onto machinery. However, the immersive analytics market for mixed reality will expand faster, with a CAGR of 33.03%, as blending sensor feeds with 3D simulations enables predictive tasks, such as fusing thermal data with substation twins to spot transformer stress. Virtual-reality cocoons remain popular for training pilots or surgeons where external distractions hinder focus, but their isolation limits operational dashboards that require situational context.
Device roadmaps hint that modalities are converging rather than competing. Apple Vision Pro users pin analytics dashboards beside physical sticky notes, and Meta's focus on open Quest hardware lets third-party developers target any immersive scenario. Enterprises, therefore, demand cross-device synchronization, prompting vendors to architect cloud orchestration layers that hand off a session from VR headsets to AR glasses and back to 2D browsers without losing state. That interoperability will become table stakes for contenders in the immersive analytics market.
Geography Analysis
North America generated 35.62% of 2025 revenue, backed by federal appropriations that embed digital twins into transportation safety studies and defense testbeds. A bipartisan Leadership in Immersive Technology Act elevates the technology to national-competitiveness status, unlocking grants and coordination across agencies. Canadian miners and foresters rely on immersive subsurface models to safely staff remote operations, while Mexico's automotive clusters integrate spatial quality dashboards directly into line-side SAP systems. Enterprise buyers also benefit from dense 5G rollouts and hyperscale cloud nodes that host low-latency rendering farms.
Asia-Pacific is forecast to be the fastest-growing region, with a 33.74% CAGR through 2031. Japan's PLATEAU project already offers 3D city models for 236 municipalities and aims for 500 by 2027, a public data asset that fuels urban disaster simulations and infrastructure planning. China's Shanghai twin maps waste collection and e-bike charging while feeding epidemiological analyses, proving out city-scale use cases. India's Jio True5G blanket now covers 5,500 cities, enabling immersive field-service overlays in far-flung substations. South Korea and Australia invest in smart factories and mining twins, rounding out regional momentum.
Europe held a mid-tier share in 2025, yet policy tailwinds portend acceleration. The European Partnership for Virtual Worlds commits EUR 200 million (USD 226 million) in joint funding, and the Digital Europe Test Beds funnel EUR 17 million (USD 19.2 million) into cross-border sandboxes. These programs mandate open-standard APIs, encouraging vendor neutrality and boosting buyer confidence. Pilots such as the x-CITE CitiVerse in Belgium, Finland, and the Netherlands let citizens visualize zoning proposals in 3D, widening public familiarity. South America, the Middle East, and Africa trail in absolute spend but leverage sovereign-wealth funds and commodity-sector use cases, oil, gas, and mining, to finance lighthouse projects that can scale regionally.
- Microsoft Corporation
- NVIDIA Corporation
- Unity Software Inc.
- Magic Leap, Inc.
- PTC Inc.
- Alphabet Inc. (Google)
- Apple Inc.
- Meta Platforms, Inc.
- Siemens AG
- Dassault Systemes SE
- Varjo Technologies Oy
- HTC Corporation
- Qualcomm Technologies, Inc.
- Lenovo Group Limited
- Amazon Web Services, Inc.
- Autodesk, Inc.
- Ultraleap Ltd.
- Ultrahaptics IP Two Limited
- CrunchFish AB
- Tobii AB
Additional Benefits:
- The market estimate (ME) sheet in Excel format
- 3 months of analyst support
TABLE OF CONTENTS
1 INTRODUCTION
- 1.1 Study Assumptions and Market Definition
- 1.2 Scope of the Study
2 RESEARCH METHODOLOGY
3 EXECUTIVE SUMMARY
4 MARKET LANDSCAPE
- 4.1 Market Overview
- 4.2 Market Drivers
- 4.2.1 Accelerating Enterprise Digital Twins Adoption
- 4.2.2 Falling Unit Costs of XR Head-Mounted Displays
- 4.2.3 Expansion of 5G and Edge Computing Infrastructure
- 4.2.4 Integration of Generative AI for Real-Time Insights
- 4.2.5 Open-Source Spatial Analytics Frameworks Maturing
- 4.2.6 Rise of Analytics as a Feature in Industrial IoT Platforms
- 4.3 Market Restraints
- 4.3.1 Limited Availability of Authoring Talent
- 4.3.2 Hardware-Induced Motion Sickness and Fatigue
- 4.3.3 Immature Enterprise Security Standards for XR Data
- 4.3.4 High Customization Costs for Domain-Specific Workflows
- 4.4 Impact of Macroeconomic Factors on the Market
- 4.5 Industry Value Chain Analysis
- 4.6 Regulatory Landscape
- 4.7 Technological Outlook
- 4.8 Porter's Five Forces Analysis
- 4.8.1 Bargaining Power of Suppliers
- 4.8.2 Bargaining Power of Buyers
- 4.8.3 Threat of New Entrants
- 4.8.4 Threat of Substitutes
- 4.8.5 Intensity of Competitive Rivalry
5 MARKET SIZE AND GROWTH FORECASTS (VALUE)
- 5.1 By Component
- 5.1.1 Software
- 5.1.2 Hardware
- 5.1.3 Services
- 5.2 By Technology
- 5.2.1 Augmented Reality (AR)
- 5.2.2 Virtual Reality (VR)
- 5.2.3 Mixed Reality (MR)
- 5.2.4 3D Desktop / Spatial-Computing Displays
- 5.3 By Deployment Model
- 5.3.1 Cloud
- 5.3.2 On-Premises
- 5.3.3 Edge / On-Device
- 5.4 By Interaction Modality
- 5.4.1 Gesture-Based
- 5.4.2 Voice / NLP
- 5.4.3 Eye-Tracking
- 5.4.4 Haptic / Force-Feedback
- 5.4.5 Multimodal Fusion
- 5.5 By End-User Industry
- 5.5.1 Healthcare and Life Sciences
- 5.5.2 Manufacturing and Industrial
- 5.5.3 Retail and e-Commerce
- 5.5.4 Energy and Utilities
- 5.5.5 Education and Research
- 5.5.6 Media, Entertainment and Sports
- 5.5.7 Defense and Aerospace
- 5.5.8 Financial Services
- 5.6 By Geography
- 5.6.1 North America
- 5.6.1.1 United States
- 5.6.1.2 Canada
- 5.6.1.3 Mexico
- 5.6.2 South America
- 5.6.2.1 Brazil
- 5.6.2.2 Argentina
- 5.6.2.3 Rest of South America
- 5.6.3 Europe
- 5.6.3.1 United Kingdom
- 5.6.3.2 Germany
- 5.6.3.3 France
- 5.6.3.4 Italy
- 5.6.3.5 Rest of Europe
- 5.6.4 Asia-Pacific
- 5.6.4.1 China
- 5.6.4.2 Japan
- 5.6.4.3 India
- 5.6.4.4 South Korea
- 5.6.4.5 Rest of Asia-Pacific
- 5.6.5 Middle East and Africa
- 5.6.5.1 Middle East
- 5.6.5.1.1 United Arab Emirates
- 5.6.5.1.2 Saudi Arabia
- 5.6.5.1.3 Rest of Middle East
- 5.6.5.2 Africa
- 5.6.5.2.1 South Africa
- 5.6.5.2.2 Egypt
- 5.6.5.2.3 Rest of Africa
- 5.6.5.1 Middle East
- 5.6.1 North America
6 COMPETITIVE LANDSCAPE
- 6.1 Market Concentration
- 6.2 Strategic Moves
- 6.3 Market Share Analysis
- 6.4 Company Profiles (includes Global Level Overview, Market Level Overview, Core Segments, Financials as available, Strategic Information, Market Rank/Share, Products and Services, Recent Developments)
- 6.4.1 Microsoft Corporation
- 6.4.2 NVIDIA Corporation
- 6.4.3 Unity Software Inc.
- 6.4.4 Magic Leap, Inc.
- 6.4.5 PTC Inc.
- 6.4.6 Alphabet Inc. (Google)
- 6.4.7 Apple Inc.
- 6.4.8 Meta Platforms, Inc.
- 6.4.9 Siemens AG
- 6.4.10 Dassault Systemes SE
- 6.4.11 Varjo Technologies Oy
- 6.4.12 HTC Corporation
- 6.4.13 Qualcomm Technologies, Inc.
- 6.4.14 Lenovo Group Limited
- 6.4.15 Amazon Web Services, Inc.
- 6.4.16 Autodesk, Inc.
- 6.4.17 Ultraleap Ltd.
- 6.4.18 Ultrahaptics IP Two Limited
- 6.4.19 CrunchFish AB
- 6.4.20 Tobii AB
7 MARKET OPPORTUNITIES AND FUTURE OUTLOOK
- 7.1 White-Space and Unmet-Need Assessment

 全球身臨其境型分析市場規模、佔有率、趨勢和成長分析報告(2026-2034年)
 身臨其境型分析市場:按組件、技術類型、設備類型、應用和最終用戶分類-2026-2032年全球市場預測
 身臨其境型分析市場分析及預測(至2035年):依類型、產品類型、服務、技術、組件、應用、設備、部署類型、最終用戶及功能分類
 沉浸式分析市場 - 全球產業規模、佔有率、趨勢、機會和預測,按組件、應用、產業、地區、競爭細分,2020-2030F
 身臨其境型分析市場預測至 2032 年:按組件、部署模式、技術、應用、最終用戶和地區進行的全球分析
 身臨其境型分析市場規模、佔有率、趨勢分析報告:按組件、產業、應用、地區、細分市場預測,2025 年至 2030 年
 身臨其境型分析的全球市場