


 |
市場調查報告書
商品編碼
2062041
貿易管理:市場佔有率分析、產業趨勢與統計、成長預測(2026-2031)Trade Management - Market Share Analysis, Industry Trends & Statistics, Growth Forecasts (2026 - 2031) |
||||||

※ 本網頁內容可能與最新版本有所差異。詳細情況請與我們聯繫。
根據 Mordor Intelligence 預測,全球貿易管理市場規模將從 2025 年的 27.1 億美元和 2026 年的 28.4 億美元成長到 2031 年的 34.3 億美元,2026 年至 2031 年的年複合成長率(CAGR)為 3.87%。
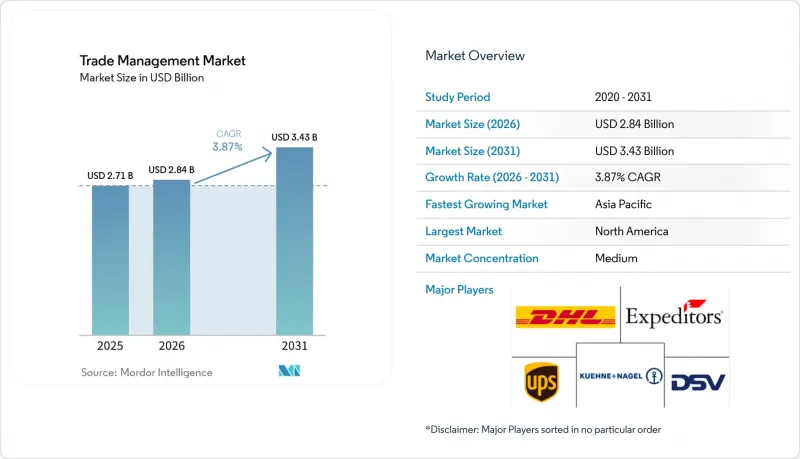
這一成長反映了關稅調整、強制性電子文檔要求以及新一代自由貿易協定如何將合規軟體從單純的成本中心提升為供應鏈的控制塔。本報告按服務(貿易合規管理、海關業務等)、組織規模(大型企業、中小企業)、終端用戶行業(製造業、零售和電子商務等)以及地區(北美、南美、亞太、歐洲、中東和非洲)進行細分。市場預測以美元計價。
全球貿易管理市場趨勢與洞察
擴大下一代自由貿易協定(CPTPP、AfCFTA、DEPA)
跨區域協定正在重塑關稅結構,因此需要建立機制來即時檢驗多種關稅方案。光是RCEP一項預計到2030年每年就能帶來2,450億美元的營收成長,並創造280萬個就業崗位,凸顯了協定匹配自動化的經濟獎勵。 CPTPP的擴大進一步加劇了優惠規則重疊的「複雜局面」。同時,非洲大陸自由貿易區(AfCFTA)下54個國家的關稅協調正在刺激非洲對更具適應性的平台的需求。 DEPA正在試行無紙化貿易規範,其影響將波及更廣泛的監管藍圖。 2024年日本RCEP證書數量的激增凸顯了企業迫切需要相關技術來追蹤多層供應鏈中的零件採購。總而言之,隨著企業從被動合規轉向利潤最大化,這些協定正在推動全球貿易管理市場的形成。
自2022年起,關稅和貿易救濟措施的波動性將加劇
如今,難以預測的關稅措施變化速度甚至超過了產品開發週期。 57%的供應鏈高層認為政策變化是2024年他們面臨的最大挑戰。 301條款措施、歐盟保障措施以及印度的浮動關稅迫使企業每週都要對進項成本的波動進行建模。雖然降低關稅的益處超過了縮短清關時間,但兩者都依賴統一的數據。隨著多邊協議的削弱,企業開始將全球貿易管理(GTM)市場軟體視為轉型籌資策略所需的分析工具,而非避免罰款的成本。
港口和海關系統之間貿易資料標準分散
儘管存在 EDIFACT 和 WCO 資料模型,但連接埠層面的差異迫使供應商編寫數百個自訂適配器。 《2024 年亞太貿易便利化報告》指出,標準化可以將貿易成本降低 13%,但由於實施並非強制性的,進展緩慢。供應商正在創建抽象層,這導致開發預算膨脹、供應商鎖定,並減緩了全球貿易管理市場的成長。
細分市場分析
到2025年,貿易合規管理將佔全球貿易管理市場的39.88%,鞏固其作為所有買家基礎功能的地位。然而,預計到2031年,物流和運輸管理將以5.51%的複合年成長率超越所有其他服務,顯示客戶對整合式海關、承運商和里程碑管理的需求日益成長。 DHL的趨勢雷達報告強調,生成式人工智慧和電腦視覺是目前正被納入貨運層面合規工作流程的最尖端科技。隨著透過政府入口網站直接申報成為可能,報關行的利潤空間受到擠壓,促使他們轉向更高附加價值的諮詢服務。
此外,主要專注於價值鏈視覺化和風險分析的「其他」服務,由於即時地緣政治格局的變化以及持續航線重新計算的需求,正日益受到關注。整合式儀錶板能夠同時顯示關稅變化和船舶預計到達時間 (ETA),從而加快決策速度,並進一步整合營運和監管數據。在這種日益融合的趨勢下,解決方案的差異化正轉向人工智慧驅動的分類引擎和易於使用的自由貿易協定 (FTA) 最佳化工具,而傳統獨立解決方案在全球貿易管理市場中的價值正在下降。
區域分析
北美地區在美墨加協定(USMCA)的穩定及其完善的出口管制內容庫的支持下,預計到2025年將佔全球收入的37.24%。該地區大型企業的主導地位保證了高額的經常性許可收入,而加拿大向CARM的過渡也引發了一波現有系統的升級浪潮。同時,亞太地區預計將實現6.15%的複合年成長率,這主要得益於區域全面經濟夥伴關係協定(RCEP)的啟動以及中國人工智慧主導的海關基準測試。日本證書簽發量的激增表明,符合自由貿易協定(FTA)的平台能夠迅速帶來投資回報,凸顯了關稅減讓如何為軟體投資提供資金。
在歐洲,邊境調節措施(CBAM)和增值稅位化(ViDA)要求企業將碳排放指標和即時增值稅(VAT)報告納入關稅計算,以幫助維持經濟平衡成長。斯堪的斯堪地那維亞的先驅正在將環境、社會和治理(ESG)模組納入主流競標,並為英國計劃於2027年生效的邊境調節措施法規建立參考設計。
儘管南美洲、中東和非洲的基礎設施仍落後,但由於非洲大陸自由貿易區(AfCFTA)和現代化基金的實施,預計需求將會成長。整體而言,不僅貿易量,各地區數位化準備程度也將是預測全球貿易管理市場滲透率的關鍵因素。
其他好處:
- Excel格式的市場預測(ME)表
- 3個月的分析師支持
目錄
第1章:引言
- 研究假設和市場定義
- 調查範圍
第2章:調查方法
第3章執行摘要
第4章 市場狀況
- 市場概覽
- 市場促進因素
- 擴大下一代自由貿易協定(CPTPP、AfCFTA、DEPA)
- 自2022年起,關稅波動和貿易救濟措施將增加
- 雲端原生海關現代化計畫(英國CDS、加拿大 CARM)
- 全球強制實施電子帳單和電子文檔正在加速數位化進程。
- 與 ESG 相關的產品級可追溯性和範圍 3 碳排放報告。
- 用於原產地認證的代幣化數位產品護照
- 市場限制因素
- 港口和海關系統之間貿易資料標準不一致
- 整個互聯 GTM 堆疊的網路安全和勒索軟體風險增加。
- 保護主義的出口限制和對外國直接投資(FDI)的審查正在增加合規負擔。
- 跨境資料抗量子密碼技術準備工作的延誤
- 價值供應鏈分析
- 監理情勢
- 技術展望
- 波特五力模型
- 其他結構性市場分析
第5章 市場規模與成長預測
- 按服務
- 貿易合規管理
- 報關
- 物流/運輸管理
- 其他(供應鏈視覺性、風險管理等)
- 按組織規模
- 大公司
- 中小企業
- 按最終用戶行業分類
- 製造業
- 零售與電子商務
- 藥品和醫療保健
- 能源公用事業
- 食品/飲料
- 其他行業
- 按地區
- 北美洲
- 美國
- 加拿大
- 墨西哥
- 南美洲
- 巴西
- 秘魯
- 智利
- 阿根廷
- 其他南美國家
- 亞太地區
- 印度
- 中國
- 日本
- 澳洲
- 韓國
- 東南亞(新加坡、馬來西亞、泰國、印尼、越南、菲律賓)
- 其他亞太國家
- 歐洲
- 英國
- 德國
- 法國
- 西班牙
- 義大利
- 比荷盧經濟聯盟(比利時、荷蘭、盧森堡)
- 北歐國家(丹麥、芬蘭、冰島、挪威、瑞典)
- 其他歐洲國家
- 中東和非洲
- 阿拉伯聯合大公國
- 沙烏地阿拉伯
- 南非
- 奈及利亞
- 其他中東和非洲國家
- 北美洲
第6章 競爭情勢
- 市場集中度
- 策略趨勢
- 市佔率分析
- 公司簡介
- Livingston International
- Expeditors International of Washington, Inc.
- Kuehne Nagel
- DHL Group
- DSV
- Ceva Logistics
- Geodis
- CH Robinson Worldwide
- Nippon Express
- Sinotrans
- UPS Supply Chain Solutions
- Kintetsu World Express(KWE)
- GXO Logistics
- BDP International
- SEKO Logistics
- Hellmann Worldwide Logistics
- Dachser
- Fedex
- Rhenus Logistics
- Yusen Logistics(Part of NYK Line)*
第7章 市場機會與未來展望
According to Mordor Intelligence, the global trade management market size is projected to expand from USD 2.71 billion in 2025 and USD 2.84 billion in 2026 to USD 3.43 billion by 2031, registering a CAGR of 3.87% between 2026 and 2031.
The expansion reflects how tariff volatility, mandatory e-documentation, and next-generation free-trade agreements elevate compliance software from a cost center to a supply-chain control tower. This report is Segmented by Services (Trade Compliance Management, Customs Brokerage, and More), by Organization Size (Large Enterprises, Small & Medium Enterprises), by End-User Industry (Manufacturing, Retail & E-Commerce, and More), and by Geography (North America, South America, Asia-Pacific, Europe, Middle East and Africa). The Market Forecasts are Provided in Terms of Value (USD).
Global Trade Management Market Trends and Insights
Proliferation Of Next-Generation FTAs (CPTPP, AfCFTA, DEPA)
Mega-regional agreements reshape duty structures, requiring engines that can test multiple tariff scenarios in real time. RCEP alone is modeled to deliver USD 245 billion in annual income gains by 2030 and create 2.8 million jobs, proving the monetary incentive for automated agreement matching. CPTPP enlargement multiplies the "noodle-bowl" of overlapping preference rules, while AfCFTA's 54-country customs alignment stimulates demand for adaptable platforms across Africa. DEPA pilots paperless trade norms that ripple into wider regulatory blueprints. Japan's rapid spike in RCEP certificates during 2024 validates enterprise urgency for technology that traces component sourcing across multi-tier chains. Collectively, these agreements elevate Global Trade Management market adoption as firms pivot from passive compliance to revenue optimization.
Escalating Tariff & Trade-Remedy Volatility Since 2022
Unpredictable levies now move quicker than product-development cycles. Fifty-seven percent of supply-chain executives ranked changing policies as their top 2024 challenge. Section 301 actions, EU safeguards, and India's sliding duties force companies to model landed-cost swings weekly. Duty-savings scenarios outshine clearance-time benefits, yet both depend on unified data. As multilateral consensus fades, enterprises view Global Trade Management market software less as a cost to avoid fines and more as analytics needed for sourcing shifts.
Fragmented Trade-Data Standards Among Ports & Customs Systems
Despite EDIFACT and WCO data models, port-level deviations force vendors to code hundreds of bespoke adapters. Asia-Pacific Trade Facilitation Report 2024 argues harmonization could shave 13 % off trade costs, yet voluntary uptake slows progress. Vendors create abstraction layers, inflating development budgets and causing lock-in, tempering Global Trade Management market velocity.
Other drivers and restraints analyzed in the detailed report include:
- Cloud-Native Customs Modernization Programs (UK CDS, Canada CARM)
- Global E-Invoicing / E-Document Mandates Accelerating Digitization
- Rising Cyber-Security & Ransomware Risks Across Connected Stacks
For complete list of drivers and restraints, kindly check the Table Of Contents.
Segment Analysis
Trade Compliance Management garnered 39.88 % of the Global Trade Management market share in 2025, confirming its role as baseline functionality for every buyer. Nevertheless, Logistics and Transportation Management is set to outpace all other services at a 5.51 % CAGR through 2031, signaling customer appetite for unified duty, carrier, and milestone control. DHL's Trend Radar cites generative AI and computer vision as edge technologies now embedded in shipment-level compliance workflows. Customs brokerage margins face compression where government portals enable direct filing, driving brokers toward higher-value consultancy.
Secondarily, "Others" services chiefly supply-chain visibility and risk analytics gain traction because real-time geopolitical shifts demand continuous routing recalculations. Integrated dashboards that show tariff swings alongside vessel ETAs accelerate decision timeliness, further merging operational and regulatory data layers. As convergence rises, solution differentiation now tilts toward AI-powered classification engines and out-of-the-box FTA optimizers, nudging legacy standalone offerings down the value ladder within the Global Trade Management market
Geography Analysis
North America generated 37.24 % of 2025 revenue, powered by USMCA stability and deep export-control content libraries. The region's large-enterprise dominance ensures high recurring license values, and Canada's CARM shift prompts a wave of in-place upgrades. Asia-Pacific, however, posts a 6.15 % CAGR on the back of RCEP's operational use and China's AI-driven customs benchmarks. Japan's certificate-issuance boom validates rapid ROI for FTA-aware platforms, underscoring how tariff savings finance software spend.
Europe sustains balanced growth as CBAM and ViDA force companies to overlay carbon metrics and real-time VAT reporting onto customs duties. Scandinavian early adopters pull ESG modules into mainstream tenders, setting a reference design for upcoming UK CBAM rules in 2027.
South America and the Middle East & Africa still trail on infrastructure, yet AfCFTA and modernization funds unlock incremental demand. Overall, regional digital readiness, not trade volume alone, predicts Global Trade Management market penetration.
- Livingston International
- Expeditors International of Washington, Inc.
- Kuehne Nagel
- DHL Group
- DSV
- Ceva Logistics
- Geodis
- C.H. Robinson Worldwide
- Nippon Express
- Sinotrans
- UPS Supply Chain Solutions
- Kintetsu World Express (KWE)
- GXO Logistics
- BDP International
- SEKO Logistics
- Hellmann Worldwide Logistics
- Dachser
- Fedex
- Rhenus Logistics
- Yusen Logistics (Part of NYK Line)*
Additional Benefits:
- The market estimate (ME) sheet in Excel format
- 3 months of analyst support
TABLE OF CONTENTS
1 Introduction
- 1.1 Study Assumptions & Market Definition
- 1.2 Scope of the Study
2 Research Methodology
3 Executive Summary
4 Market Landscape
- 4.1 Market Overview
- 4.2 Market Drivers
- 4.2.1 Proliferation of next-generation FTAs (CPTPP, AfCFTA, DEPA)
- 4.2.2 Escalating tariff & trade-remedy volatility since 2022
- 4.2.3 Cloud-native customs modernisation programmes (UK CDS, Canada CARM)
- 4.2.4 Global e-invoicing / e-document mandates accelerating digitisation
- 4.2.5 ESG-linked product-level traceability & Scope-3 carbon reporting
- 4.2.6 Tokenised Digital Product Passports for origin authentication
- 4.3 Market Restraints
- 4.3.1 Fragmented trade-data standards among ports & customs systems
- 4.3.2 Rising cyber-security & ransomware risks across connected GTM stacks
- 4.3.3 Protectionist export controls & FDI screening intensifying compliance load
- 4.3.4 Lag in quantum-secure cryptography readiness for cross-border data
- 4.4 Value / Supply-Chain Analysis
- 4.5 Regulatory Landscape
- 4.6 Technological Outlook
- 4.7 Porter's Five Forces
- 4.7.1 Threat of New Entrants
- 4.7.2 Bargaining Power of Suppliers
- 4.7.3 Bargaining Power of Buyers
- 4.7.4 Threat of Substitutes
- 4.7.5 Industry Rivalry
- 4.8 Other Structural Market Analysis
5 Market Size & Growth Forecasts (Value)
- 5.1 By Services
- 5.1.1 Trade Compliance Management
- 5.1.2 Customs Brokerage
- 5.1.3 Logistics and Transportation Management
- 5.1.4 Others (Supply Chain Visibility, Risk Management etc)
- 5.2 By Organization Size
- 5.2.1 Large Enterprises
- 5.2.2 Small & Medium Enterprises (SMEs)
- 5.3 By End-User Industry
- 5.3.1 Manufacturing
- 5.3.2 Retail & E-commerce
- 5.3.3 Pharmaceuticals and Healthcare
- 5.3.4 Energy & Utilities
- 5.3.5 Food & Beverage
- 5.3.6 Other Industries
- 5.4 By Geography
- 5.4.1 North America
- 5.4.1.1 United States
- 5.4.1.2 Canada
- 5.4.1.3 Mexico
- 5.4.2 South America
- 5.4.2.1 Brazil
- 5.4.2.2 Peru
- 5.4.2.3 Chile
- 5.4.2.4 Argentina
- 5.4.2.5 Rest of South America
- 5.4.3 Asia-Pacific
- 5.4.3.1 India
- 5.4.3.2 China
- 5.4.3.3 Japan
- 5.4.3.4 Australia
- 5.4.3.5 South Korea
- 5.4.3.6 South East Asia (Singapore, Malaysia, Thailand, Indonesia, Vietnam, and Philippines)
- 5.4.3.7 Rest of Asia-Pacific
- 5.4.4 Europe
- 5.4.4.1 United Kingdom
- 5.4.4.2 Germany
- 5.4.4.3 France
- 5.4.4.4 Spain
- 5.4.4.5 Italy
- 5.4.4.6 BENELUX (Belgium, Netherlands, and Luxembourg)
- 5.4.4.7 NORDICS (Denmark, Finland, Iceland, Norway, and Sweden)
- 5.4.4.8 Rest of Europe
- 5.4.5 Middle East and Africa
- 5.4.5.1 United Arab of Emirates
- 5.4.5.2 Saudi Arabia
- 5.4.5.3 South Africa
- 5.4.5.4 Nigeria
- 5.4.5.5 Rest of Middle East And Africa
- 5.4.1 North America
6 Competitive Landscape
- 6.1 Market Concentration
- 6.2 Strategic Moves
- 6.3 Market Share Analysis
- 6.4 Company Profiles (includes Global level Overview, Market level overview, Core Segments, Financials as available, Strategic Information, Market Rank/Share for key companies, Products & Services, and Recent Developments)
- 6.4.1 Livingston International
- 6.4.2 Expeditors International of Washington, Inc.
- 6.4.3 Kuehne Nagel
- 6.4.4 DHL Group
- 6.4.5 DSV
- 6.4.6 Ceva Logistics
- 6.4.7 Geodis
- 6.4.8 C.H. Robinson Worldwide
- 6.4.9 Nippon Express
- 6.4.10 Sinotrans
- 6.4.11 UPS Supply Chain Solutions
- 6.4.12 Kintetsu World Express (KWE)
- 6.4.13 GXO Logistics
- 6.4.14 BDP International
- 6.4.15 SEKO Logistics
- 6.4.16 Hellmann Worldwide Logistics
- 6.4.17 Dachser
- 6.4.18 Fedex
- 6.4.19 Rhenus Logistics
- 6.4.20 Yusen Logistics (Part of NYK Line)*


