


 |
市場調查報告書
商品編碼
2061723
預製混凝土:市場佔有率分析、產業趨勢與統計、成長預測(2026-2031)Precast Concrete - Market Share Analysis, Industry Trends & Statistics, Growth Forecasts (2026 - 2031) |
||||||
※ 本網頁內容可能與最新版本有所差異。詳細情況請與我們聯繫。
據 Mordor Intelligence 稱,預製混凝土市場預計到 2026 年價值 1,495.2 億美元,高於 2025 年的 1,431.2 億美元,預計到 2031 年將達到 1,860.8 億美元。
預計 2026 年至 2031 年的複合年成長率為 4.47%。
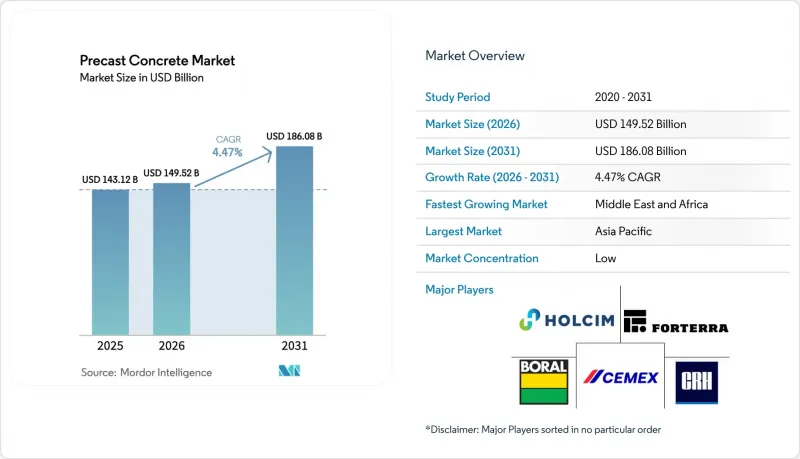
本報告按產品類型(柱樑、牆體護欄、樓板屋頂、管道、路面板及其他)、最終用途行業(住宅、商業、基礎設施、工業和公共設施)以及地區(亞太地區、北美、歐洲、南美以及中東和非洲)進行細分。市場預測以美元計價。
全球預製混凝土市場趨勢及洞察
政府主導的大型企劃儲備
全球基礎設施規劃透過設計標準化和加速材料採購,推動了預製混凝土市場可預測的持續需求。美國1.2兆美元的《基礎設施投資與就業法案》、歐洲「綠色交易」的低碳建築目標以及中國要求30%的新建城市建築採用預製構件施工方法的規定,共同支撐著未來多年的市場需求。塔斯馬尼亞州布里奇沃特大橋的重建計畫表明,與現澆施工方法相比,預製混凝土的工期縮短了40%。大規模採購降低了單位成本,並確保了專案間的品質一致性。擁有區域中心和模組化模板系統的供應商正在搶佔早期階段的套裝保險契約,並鞏固其市場領先優勢。
新興國家的「人人有住宅」政策
經濟適用住宅建設計畫透過將補貼與預製混凝土行業的快速標準化供應掛鉤,推動了預製混凝土的普及應用。印度的「總理住房計畫」(Pradan Mantri Awas Yojana)旨在建造2,000萬套住房,該計畫報告稱,透過使用預製牆體、樓板和樓梯核心筒,施工週期縮短了50%,直接成本降低了15%。 [2] 印尼已在其群島各地部署了可攜式混凝土攪拌站,證明移動式攪拌站可以克服地理分散的問題。可預測的產量使得企業能夠投資建造自動化轉盤生產線,使每小時產量比傳統生產場地提高三倍。拉丁美洲的社會住宅部門也擴大呼籲採用工廠預製板來滿足颶風荷載標準,這表明成本、速度和抗災能力的目標正在趨於一致。
超大尺寸部件的物流成本高昂
運輸長度超過30公尺的梁會使交付構件的成本增加15%至25%,尤其是在距離工廠100公里以上的地區。 [3] 橋樑淨空和重量限制導致需要繞行,從而增加燃油費和許可證費用。都市區堵塞對起重機安裝和道路封閉提出了更嚴格的要求,縮短了可接受的交貨時間,並增加了加班費。在偏遠的施工現場,牽引車輛的成本可能很高,有時會抵消預製混凝土行業工廠生產率提高帶來的收益。供應商正在透過建立衛星堆場和設計可連接的構件來降低風險,但對行動模板和配料設備的資本投資限制了短期內的擴充性。
細分市場分析
柱樑是支撐預製混凝土市場規模的支柱,預計2025年將佔據36.62%的市場。這一強勁的需求主要來自高層建築、橋樑和工業建築,這些建築對承載精度要求極高,需要在工廠進行精確控制的澆築。隨著各國政府收緊周界安全標準以及模組化住宅套件的日益普及,預計到2031年,牆體和護欄的複合年成長率將達到5.07%。由於開放式佈局的偏好,樓板和屋頂受益於大跨度中空板的應用,從而減少了現場支撐時間。管道系統與水利基礎設施資金籌措週期密切相關,而路面板則有助於街道景觀的持續更新。
自動化正在改變每一條產品線。在預製混凝土行業,機器人鋼筋籠可減少 40% 至 60% 的人工成本,雷射投影確保模板的精度,而 3D 列印模板則使建築紋理的客製化更加便捷。整合隔熱材料層和管道空間的牆體和圍護結構正從普通的通用面板演變為承包圍護系統,從而支撐其高階定價。標準化連接器正在加速現場組裝,並將速度優勢直接融入組件設計中。在地震多發地區,需要對延性連接進行詳細設計,這使得產品系列的區域最佳化顯得特別重要。
區域分析
到2025年,亞太地區將佔據預製混凝土市場39.12%的佔有率。其中,中國強制規定所有新建城市計畫必須使用30%的預製構件,而印度則為低收入住宅的建設提供補貼。區域製造商正利用規模經濟和當地水泥供應優勢,推動標準化模板技術出口到越南和菲律賓。日本和韓國在抗震預製框架的研發方面處於領先地位,而澳洲則致力於將高耐久性海洋混凝土混合料應用於沿海基礎設施建設。
預計中東和非洲地區將錄得最高成長率,到2031年複合年成長率將達到4.83%。海灣國家的主權財富基金正在投資智慧城市平台,例如沙烏地阿拉伯的NEOM項目,該項目強制使用工廠預製外牆以提高隔熱效率。卡達世界盃建設項目留下了大量剩餘製造地,這些產能現已重新部署到地鐵和海水淡化項目。模組化學校和醫院正在內羅畢和拉各斯等非洲主要城市進行試點,但由於道路運輸限制和起重機短缺,其短期內難以擴充性。
在北美和歐洲,預製混凝土產業正經歷成熟但又以創新主導的需求趨勢。美國保險公司提供的災害風險折扣促進了颶風易發地區預製混凝土的普及,而加拿大碳排放稅的實施計劃則鼓勵使用低水泥預製混凝土混合料。歐洲的競標規範越來越強調揭露從原料開採到產品交付的整個生產過程中的二氧化碳排放,迫使供應商採用水泥熟料水泥和可再生能源驅動的養護窯。市場准入取決於是否符合不斷發展的EN和ASTM標準,以及根據當地情況制定的環境產品聲明(EPD)。
其他好處:
- Excel格式的市場預測(ME)表
- 3個月的分析師支持
目錄
第1章:引言
- 研究假設和市場定義
- 調查範圍
第2章:調查方法
第3章執行摘要
第4章 市場狀況
- 市場概覽
- 市場促進因素
- 政府主導的大型專案規劃
- 新興經濟體的「人人享有住宅」政策
- 轉移到異地生產的促進因素是技術純熟勞工。
- 將嵌入式碳權貨幣化
- 抗震預製結構的保險費折扣
- 市場限制因素
- 超大尺寸部件的物流成本高昂
- 與自癒式現澆混凝土的競爭
- 區域編碼碎片化
- 價值鏈分析
- 波特五力模型
第5章 市場規模與成長預測
- 依產品類型
- 柱和樑
- 牆壁和屏障
- 地板和屋頂
- 管道
- 鋪路石板
- 其他
- 產業最終用途
- 住宅
- 商業
- 基礎設施
- 工業和公共部門
- 按地區
- 亞太地區
- 中國
- 印度
- 日本
- 韓國
- 馬來西亞
- 泰國
- 印尼
- 越南
- 其他亞太國家
- 北美洲
- 美國
- 加拿大
- 墨西哥
- 歐洲
- 德國
- 英國
- 義大利
- 法國
- 俄羅斯
- 西班牙
- 土耳其
- 北歐國家
- 其他歐洲國家
- 南美洲
- 巴西
- 阿根廷
- 哥倫比亞
- 其他南美國家
- 中東和非洲
- 沙烏地阿拉伯
- 阿拉伯聯合大公國
- 卡達
- 埃及
- 奈及利亞
- 南非
- 其他中東和非洲國家
- 亞太地區
第6章 競爭情勢
- 市場集中度
- 策略趨勢
- 市佔率(%)** / 排名分析
- 公司簡介
- Balfour Beatty
- Boral Ltd.
- Bouygues Construction
- CEMEX SAB de CV
- CRH
- ELO Beton
- Forterra Building Products Limited
- FP McCann
- Gulf Precast
- Holcim
- Larsen & Toubro Limited
- Molins
- Oldcastle Infrastructure Inc.
- Skanska
- The Wells Companies, Inc.
- Tindall Corporation
第7章 市場機會與未來展望
According to Mordor Intelligence, precast concrete market size in 2026 is estimated at USD 149.52 billion, growing from 2025 value of USD 143.12 billion with 2031 projections showing USD 186.08 billion, growing at 4.47% CAGR over 2026-2031.
This report is Segmented by Product Type (Columns and Beams, Walls and Barriers, Floors and Roofs, Pipes, Paving Slabs, Others), End-Use Industry (Residential, Commercial, Infrastructure, Industrial and Institutional), and Geography (Asia-Pacific, North America, Europe, South America, Middle East and Africa). The Market Forecasts are Provided in Terms of Value (USD).
Global Precast Concrete Market Trends and Insights
Government-led Megaproject Pipelines
National infrastructure programs funnel predictable volumes to the precast concrete market by standardizing designs and front-loading component procurement. The USD 1.2 trillion U.S. Infrastructure Investment and Jobs Act, the European Green Deal's low-carbon build targets, and China's mandate that 30% of new urban buildings employ prefabrication collectively underpin a multiyear demand base. Tasmania's Bridgewater Bridge replacement documented a 40% schedule reduction versus cast-in-place options. Scale procurement compresses unit costs and assures cross-project quality consistency. Suppliers with regional hub plants and modular formwork systems capture early-stage package awards, reinforcing first-mover advantages.
Housing-for-All Mandates in Emerging Economies
Affordable-housing blueprints elevate precast adoption by tying subsidy disbursements to rapid, standardized delivery within the precast concrete industry. India's Pradhan Mantri Awas Yojana targets 20 million units and reports 50% faster build cycles plus 15% direct cost savings with precast walls, slabs, and stair cores[2]. Indonesia relocates portable factories across its archipelago, proving that mobile batch plants overcome geographic fragmentation. Predictable volume unlocks investments in automated carousel lines that triple hourly output compared with conventional yards. Latin American social-housing ministries increasingly require factory-molded panels to meet hurricane-load codes, illustrating the alignment between cost, speed, and resilience objectives.
High Logistics Cost of Oversize Elements
Hauling girders longer than 30 meters can add 15-25% to delivered component cost , especially beyond 100 km from the plant[3]. Limited bridge clearances and weight caps force circuitous routes that inflate fuel usage and permit fees. Urban congestion magnifies crane staging and road-closure requirements, compressing allowable delivery windows and raising overtime premiums. Remote project sites endure elevated escort-vehicle expenses, occasionally offsetting factory productivity benefits in the precast concrete industry. Suppliers mitigate exposure by deploying satellite yards or designing splice-ready segments, yet capex for mobile forms and batch setups restrains near-term scalability.
Other drivers and restraints analyzed in the detailed report include:
- Shift to Off-site Manufacturing Amid Skilled-Labor Scarcity
- Embodied-Carbon Credits Monetization
- Competition from Self-Healing In-situ Concretes
For complete list of drivers and restraints, kindly check the Table Of Contents.
Segment Analysis
Columns and beams anchored the precast concrete market size, accounting for 36.62% share in 2025. Robust demand stems from high-rise, bridge, and industrial frameworks where load-bearing precision necessitates controlled factory casting. Walls and barriers are poised to expand at a 5.07% CAGR to 2031 as governments tighten perimeter-security codes and modular housing kits proliferate. Floors and roofs benefit from open-plan preferences, leveraging long-span hollow-core slabs that cut on-site shoring time. Pipe segments track water-infrastructure funding cycles, while paving slabs serve steady streetscape renewal programs.
Automation reshapes all product lines: robotized cages trim labor by 40-60% across the precast concrete industry; laser projection ensures formwork accuracy, and 3D-printed molds facilitate custom architectural textures. Integrated insulation and conduit chases elevate walls and barriers from commodity panels to turnkey envelope systems, supporting premium pricing. Standardized connection hardware accelerates job-site assembly, embedding speed advantages directly into component design. Earthquake zones demand ductile joint details, reinforcing the regional tailoring of product portfolios.
Geography Analysis
Asia-Pacific held a 39.12% share of the precast concrete market in 2025, with China enforcing 30% prefabrication quotas across new urban projects and India subsidizing low-income housing starts. Regional manufacturers capitalize on scale economies and local cement supplies, driving export of standardized formwork technology to Vietnam and the Philippines. Japan and South Korea pioneer seismic-grade precast frames, while Australia integrates high-durability marine mixes for coastal infrastructure.
The Middle East and Africa register the fastest 4.83% CAGR to 2031. Gulf sovereign wealth funds channel capital into smart-city platforms such as Saudi Arabia's NEOM, which specifies factory-finished facades for thermal efficiency. Qatar's World Cup build-out left a legacy of yard capacity now redeployed for metro and desalination projects. African metros like Nairobi and Lagos trial modular schools and hospitals, yet road-haul limits and crane shortages temper immediate scalability.
North America and Europe exhibit mature yet innovation-driven demand profiles within the precast concrete industry. U.S. insurers' resilience discounts spur uptake in hurricane corridors, while Canada's carbon-tax schedule incentivizes low-cement precast mixes. European tender specifications increasingly weight cradle-to-gate CO2 declarations, pushing suppliers to adopt clinker-reduced cements and renewable-energy curing kilns. Market access hinges on meeting evolving EN and ASTM standards alongside locally calibrated environmental product declarations.
- Balfour Beatty
- Boral Ltd.
- Bouygues Construction
- CEMEX S.A.B. de C.V.
- CRH
- ELO Beton
- Forterra Building Products Limited
- FP McCann
- Gulf Precast
- Holcim
- Larsen & Toubro Limited
- Molins
- Oldcastle Infrastructure Inc.
- Skanska
- The Wells Companies, Inc.
- Tindall Corporation
Additional Benefits:
- The market estimate (ME) sheet in Excel format
- 3 months of analyst support
TABLE OF CONTENTS
1 Introduction
- 1.1 Study Assumptions and Market Definition
- 1.2 Scope of the Study
2 Research Methodology
3 Executive Summary
4 Market Landscape
- 4.1 Market Overview
- 4.2 Market Drivers
- 4.2.1 Government-led megaproject pipelines
- 4.2.2 Housing-for-All mandates in emerging economies
- 4.2.3 Shift to off-site manufacturing amid skilled-labor scarcity
- 4.2.4 Embodied-carbon credits monetisation
- 4.2.5 Insurance-premium discounts for resilient precast structures
- 4.3 Market Restraints
- 4.3.1 High logistics cost of oversize elements
- 4.3.2 Competition from self-healing in-situ concretes
- 4.3.3 Regional code fragmentation
- 4.4 Value Chain Analysis
- 4.5 Porter's Five Forces
- 4.5.1 Bargaining Power of Suppliers
- 4.5.2 Bargaining Power of Buyers
- 4.5.3 Threat of New Entrants
- 4.5.4 Threat of Substitutes
- 4.5.5 Degree of Competition
5 Market Size and Growth Forecasts (Value)
- 5.1 By Product Type
- 5.1.1 Columns and Beams
- 5.1.2 Walls and Barriers
- 5.1.3 Floors and Roofs
- 5.1.4 Pipes
- 5.1.5 Paving Slabs
- 5.1.6 Others
- 5.2 By End-use Industry
- 5.2.1 Residential
- 5.2.2 Commercial
- 5.2.3 Infrastructure
- 5.2.4 Industrial and Institutional
- 5.3 By Geography
- 5.3.1 Asia-Pacific
- 5.3.1.1 China
- 5.3.1.2 India
- 5.3.1.3 Japan
- 5.3.1.4 South Korea
- 5.3.1.5 Malaysia
- 5.3.1.6 Thailand
- 5.3.1.7 Indonesia
- 5.3.1.8 Vietnam
- 5.3.1.9 Rest of Asia-Pacific
- 5.3.2 North America
- 5.3.2.1 United States
- 5.3.2.2 Canada
- 5.3.2.3 Mexico
- 5.3.3 Europe
- 5.3.3.1 Germany
- 5.3.3.2 United Kingdom
- 5.3.3.3 Italy
- 5.3.3.4 France
- 5.3.3.5 Russia
- 5.3.3.6 Spain
- 5.3.3.7 Turkey
- 5.3.3.8 Nordic Countries
- 5.3.3.9 Rest of Europe
- 5.3.4 South America
- 5.3.4.1 Brazil
- 5.3.4.2 Argentina
- 5.3.4.3 Colombia
- 5.3.4.4 Rest of South America
- 5.3.5 Middle East and Africa
- 5.3.5.1 Saudi Arabia
- 5.3.5.2 United Arab Emirates
- 5.3.5.3 Qatar
- 5.3.5.4 Egypt
- 5.3.5.5 Nigeria
- 5.3.5.6 South Africa
- 5.3.5.7 Rest of Middle East and Africa
- 5.3.1 Asia-Pacific
6 Competitive Landscape
- 6.1 Market Concentration
- 6.2 Strategic Moves
- 6.3 Market Share (%)**/Ranking Analysis
- 6.4 Company Profiles (includes Global level Overview, Market level overview, Core Segments, Financials as available, Strategic Information, Market Rank/Share for key companies, Products and Services, and Recent Developments)
- 6.4.1 Balfour Beatty
- 6.4.2 Boral Ltd.
- 6.4.3 Bouygues Construction
- 6.4.4 CEMEX S.A.B. de C.V.
- 6.4.5 CRH
- 6.4.6 ELO Beton
- 6.4.7 Forterra Building Products Limited
- 6.4.8 FP McCann
- 6.4.9 Gulf Precast
- 6.4.10 Holcim
- 6.4.11 Larsen & Toubro Limited
- 6.4.12 Molins
- 6.4.13 Oldcastle Infrastructure Inc.
- 6.4.14 Skanska
- 6.4.15 The Wells Companies, Inc.
- 6.4.16 Tindall Corporation
7 Market Opportunities and Future Outlook
- 7.1 White-space and Unmet-need Assessment
 預製混凝土市場:2026-2032年全球市場預測(依產品類型、鋼筋類型、製造流程、結構系統類型及最終用途分類)
 預製混凝土市場預測—全球產品類型、類別、施工方式、組件、最終用戶和地區分析—2034年
 預製混凝土市場規模、佔有率、趨勢和預測:按類型、產品、最終用途和地區分類,2026-2034年
 預製混凝土市場:按產品、應用和地區分類
 2026-2030年全球預製混凝土市場
 全球預製混凝土市場規模、佔有率、趨勢和成長分析報告(2026-2034年)
 2026年全球預製混凝土市場報告日本預製混凝土市場報告:按類型、產品類型、應用和地區分類(2026-2034年)
 全球預製混凝土市場:市場規模、佔有率和趨勢分析(按產品、應用和地區分類),細分市場預測(2026-2033 年)
 預製混凝土擋土牆市場-全球產業規模、佔有率、趨勢、機會和預測(細分、按產品類型、按應用、按材料類型、按地區和競爭情況,2020-2030 年)