


 |
市場調查報告書
商品編碼
2061600
管道完整性管理:市場佔有率分析、行業趨勢和統計數據、成長預測(2026-2031 年)Pipeline Integrity Management - Market Share Analysis, Industry Trends & Statistics, Growth Forecasts (2026 - 2031) |
||||||

※ 本網頁內容可能與最新版本有所差異。詳細情況請與我們聯繫。
根據 Mordor Intelligence 預測,管線完整性管理市場規模將從 2025 年的 108.1 億美元成長到 2026 年的 113.6 億美元,到 2031 年將達到 145.9 億美元,2026 年至 2031 年的複合年成長率為 5.12%。
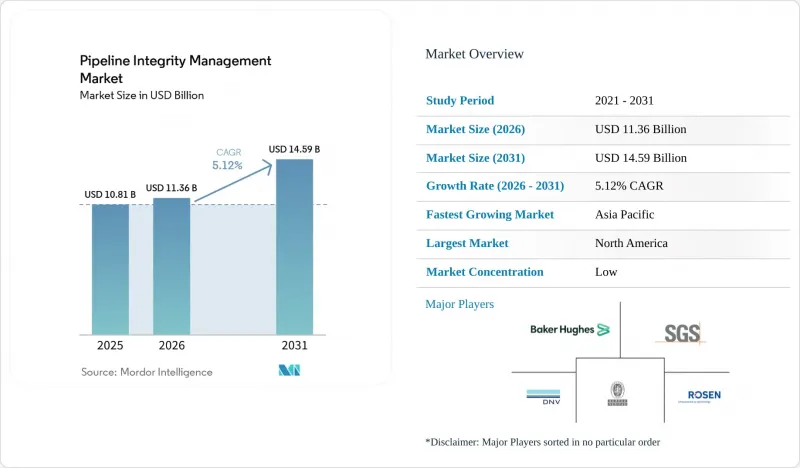
本報告按產品類型(天然氣、液化天然氣、其他)、服務類型(檢驗服務、清潔服務、數位監測和分析等)、階段(新建設管道和運作中/現有管道)、解決方案類型(硬體、軟體、服務)、部署地點(陸上和海上)以及地區(北美、歐洲、亞太地區等)進行分類。
全球管道完整性管理市場趨勢與洞察
經合組織國家老化的輸油管網路正在引發一波維修。
美國在1950年代和1960年代鋪設的250萬英里管道中,超過一半如今已超過設計壽命,這推動了對智慧清管、陰極防蝕升級和即時腐蝕監測的持續需求。類似的維修需求正在蔓延至加拿大和歐洲,這些地區的惡劣氣候和老舊的鋼材等級增加了風險。業者意識到,主動式完整性管理方案的成本遠低於更換管道,更容易獲得監管機構的批准。事故發生後公眾監督力道的加大,更強化了預測性維護的商業價值。這種維修週期為管道完整性管理市場的服務供應商提供了長達數十年的收入來源。
嚴格的審慎監理鼓勵合規投資。
美國管線與危險物質安全管理局 (PHMSA) 2024-2025 年的法規要求擴大甲烷檢測範圍、提高維修標準並增加檢查頻率,迫使業者採用更複雜的評估方法。加拿大的 CSA Z662 標準也反映了這一趨勢,要求制定書面完整性計劃並進行第三方檢驗。合規相關支出如今已成為管線完整性管理市場的堅實基礎,能夠保護服務需求免受商品價格波動的影響。能夠證明其在減少洩漏和降低風險方面卓有成效的供應商,將擁有明顯的競爭優勢。
上游和中游產業資本支出(CAPEX)的週期性
隨著價格走軟,投資將會減少,可選的檢查和數位化升級也將被推遲。由於營運商專注於最低合規要求,管道完整性管理市場的短期收入將會萎縮。提供訂閱式軟體且業務遍及多個行業的供應商將能夠更順利地度過景氣衰退。
細分市場分析
到2025年,天然氣管道將佔銷售額的46.35%,構成管道完整性管理市場的基礎。既定的標準、廣闊的鋪設距離以及定期的清管檢查都支撐著持續的需求。液化天然氣(LNG)相關管道的成長速度最快,複合年成長率(CAGR)為6.29%,主要得益於全球液化和再氣化能力的擴張。低溫環境需要使用特殊的鋼材和隔熱材料,這增加了檢查的複雜性。原油和產品平臺佔據了第二大市場佔有率,面臨嚴格的洩漏預防和特定腐蝕風險的監控。為員工提供交叉培訓以及跨產品類型重複使用數據分析的供應商正在提高效率。
液化天然氣(LNG)的蓬勃發展吸引了許多在低溫技術、爆破前洩漏(LBB)建模和快速蒸氣雲擴散分析方面擁有專業知識的供應商。整合商正在施工過程中嵌入永久性感測器,以支援全生命數位雙胞胎。隨著LNG成為能源轉換組合中不可或缺的一部分,其在管道完整性管理市場的佔有率預計將穩步成長,這將使那些及早建立相關能力的公司受益。
到2025年,檢測服務將佔總收入的39.05%,並將繼續符合全球標準,成為不可或缺的服務。磁通洩漏檢測、超音波和電磁超音波檢測(EMAT)工具是該服務的核心,因為它們能夠在失效發生之前檢測出腐蝕和裂縫。然而,隨著雲端儀錶板將原始數據轉化為可操作的風險評分,數位化監測和分析正以8.07%的複合年成長率成長。營運商正在採用連續監測來推遲成本高昂的全直徑檢測,這推動了對感測器整合和人工智慧模型訓練的需求。
清潔、維修和陰極防蝕方案完善了服務組合,每個方案的費用都隨里程和使用年限而增加。將機械服務與軟體分析相結合的供應商正在贏得更長期的合約。基於結果的定價模式正在加速發展,管道完整性管理市場的費用現在與洩漏率的降低和運作掛鉤。
區域分析
預計到2025年,北美將維持38.85%的收入佔有率,這得益於全球規模最大的老舊管道網路以及美國管道和危險材料安全管理局(PHMSA)的嚴格監管。維修投資主要集中在高解析度裂縫檢測工具、甲烷專用洩漏檢測以及人工智慧驅動的鑽井程序。加拿大在北極氣候條件下也面臨類似的管道老化挑戰,而墨西哥新建的幹線管道從一開始就採用了基準清管和光纖技術。
亞太地區以7.56%的複合年成長率領先,主要得益於中國、印度和東南亞國家天然氣和液化天然氣管網的擴張。計畫業主在FEED(基礎設計)階段就聘請健康設計服務商,以便整合監測系統。國內供應商正與全球專家合作,利用最先進的工具,力求實現在地採購目標。日本和韓國的氫能示範走廊也帶來了更多機會。
在歐洲成熟的輸氣網路中,日益增多的強制性氫氣注入使得材料檢驗和復測變得至關重要。挪威的近海幹線管道需要能夠應付高壓環境的維修系統。在中東,超深水管道和連接藍氫樞紐的二氧化碳管道的完整性管理投資正在穩步推進;而在非洲的新興輸氣網路中,承包的完整性管理方案從一開始就備受青睞。在南美洲,重點放在巴西的鹽鹽層下輸氣管線和阿根廷的頁岩氣出口走廊。這些區域趨勢共同推動了管道完整性管理市場的持續擴張。
其他好處:
- Excel格式的市場預測(ME)表
- 3個月的分析師支持
目錄
第1章:引言
- 研究假設和市場定義
- 調查範圍
第2章:調查方法
第3章執行摘要
第4章 市場狀況
- 市場概覽
- 市場促進因素
- 由於管道網路老化,經合組織國家正在掀起管道維修熱潮。
- 嚴格的衛生法規(PHMSA、CSA Z662)
- 在亞太和中東-非洲地區持續發展長距離天然氣管道。
- 海上超深海計畫(水深 1500 公尺或以上)正在迅速增加。
- 人工智慧驅動的數位雙胞胎可顯著減少檢查的停機時間。
- 新建氫氣和二氧化碳管道需要更高的完整性標準。
- 市場限制因素
- 上游和中游產業資本投資的週期性
- 先進的ILI工具初始成本高昂
- 網路安全風險正在減緩物聯網感測器的普及應用。
- 認證無損檢測技術人員短缺
- 供應鏈分析
- 監理情勢
- 技術展望
- 波特五力模型
- 運作油氣管道擴建前景展望
- 主要中游項目訊息
第5章 市場規模與成長預測
- 依產品類型
- 原油
- 天然氣
- 精煉產品
- LNG
- 按服務類型
- 檢查服務
- 清潔服務
- 維修和翻新服務
- 數位監測與分析
- 陰極防蝕服務
- 按階段
- 新建設
- 運作中的管道/現有設施
- 按解決方案類型
- 硬體(ILI 工具、感測器)
- 軟體(完整性平台)
- 服務(EPC 和 O&M)
- 按部署位置
- 陸上
- 離岸
- 按地區
- 北美洲
- 美國
- 加拿大
- 墨西哥
- 歐洲
- 挪威
- 英國
- 俄羅斯
- 荷蘭
- 德國
- 其他歐洲國家
- 亞太地區
- 中國
- 印度
- 日本
- 韓國
- 東南亞國協
- 澳洲
- 其他亞太國家
- 南美洲
- 巴西
- 阿根廷
- 哥倫比亞
- 其他南美國家
- 中東和非洲
- 沙烏地阿拉伯
- 阿拉伯聯合大公國
- 卡達
- 奈及利亞
- 南非
- 其他中東和非洲國家
- 北美洲
第6章 競爭情勢
- 市場集中度
- 策略趨勢(併購、聯盟、購電協議)
- 市場佔有率分析(主要公司的市場排名和佔有率)
- 公司簡介
- Baker Hughes Company
- SGS SA
- Bureau Veritas SA
- DNV AS
- TD Williamson Inc.
- Emerson Electric Co.
- ROSEN Group
- TUV Rheinland AG
- Intertek Group plc
- Applus+Servicios Tecnologicos
- Quest Integrity Group
- Infosys Ltd.
- EnerMech Ltd.
- MATCOR Inc.
- PwC Asset Integrity Services
- Fluor Corporation
- Wood plc
- Aker Solutions ASA
- TechnipFMC plc
- Oceaneering International Inc.
第7章 市場機會與未來展望
According to Mordor Intelligence, the pipeline integrity management market size is expected to grow from USD 10.81 billion in 2025 to USD 11.36 billion in 2026 and is forecast to reach USD 14.59 billion by 2031 at 5.12% CAGR over 2026-2031.
This report is Segmented by Product Type (Natural Gas, LNG, and More), Service Type (Inspection Services, Cleaning Services, Digital Monitoring and Analytics, and More), Phase (New-Build Pipelines and Operational/Brown-Field Pipelines), Solution Type (Hardware, Software, and Services), Location of Deployment (On-Shore and Off-Shore), and Geography (North America, Europe, Asia-Pacific, and More).
Global Pipeline Integrity Management Market Trends and Insights
Aging Pipeline Networks in OECD Create a Retrofit Wave
More than half of the 2.5 million mi of U.S. pipe installed in the 1950s-1960s now exceeds design life, driving continuous demand for smart pigging, cathodic-protection upgrades, and real-time corrosion monitoring. Similar retrofit needs span Canada and Europe, where harsh climates and legacy steel grades heighten risk. Operators find that proactive integrity programs cost significantly less than replacement and are approved by regulators more quickly. Heightened public scrutiny after incidents strengthens the business case for predictive maintenance. The retrofit cycle sustains a decades-long revenue stream for service providers across the pipeline integrity management market.
Stringent Integrity-Related Regulations Drive Compliance Investment
PHMSA's 2024-2025 rules mandate expanded methane detection, stricter repair criteria, and increased inspection frequency, prompting operators to adopt advanced assessment methods. Canada's CSA Z662 mirrors the trend, requiring documented integrity programs and third-party verification. Compliance spending now forms a solid foundation under the pipeline integrity management market, insulating service demand from fluctuations in commodity prices. Vendors that can demonstrate measurable leak reduction and risk mitigation gains enjoy a clear competitive advantage.
CAPEX Cyclicality of Upstream & Midstream Spending
Investment falls when prices soften, delaying discretionary inspections and digital upgrades. Operators focus on bare-minimum compliance, trimming near-term revenue in the pipeline integrity management market. Vendors with subscription software and multi-sector exposure ride out downturns more smoothly.
Other drivers and restraints analyzed in the detailed report include:
- On-going Build-out of Long-haul Gas Lines in APAC & MEA
- Off-shore Ultra-deepwater Projects Surge Beyond 1,500 Meters
- High Initial Cost of Advanced ILI Tools
For complete list of drivers and restraints, kindly check the Table Of Contents.
Segment Analysis
Natural-gas pipelines captured 46.35% revenue in 2025, anchoring the pipeline integrity management market. Established codes, vast installed mileage, and routine pigging sustain recurring demand. LNG-related lines grow at the fastest rate, with a 6.29% CAGR, as global liquefaction and regasification capacity expands. Cryogenic temperatures necessitate special steel and insulation requirements, thereby increasing inspection complexity. Crude oil and refined products pipelines follow in value, facing strict scrutiny for spill prevention and specialized corrosion threats. Providers able to cross-train crews and reuse data analytics across product categories enhance efficiency.
The LNG boom attracts vendors with expertise in cryogenic technology, leak-before-break modeling, and rapid vapor cloud dispersion analysis. Integrators embed permanent sensors during build-out to support lifetime digital twins. As LNG becomes integral to energy transition portfolios, its share of the pipeline integrity management market size is poised to widen steadily, rewarding early capability builders.
Inspection services generated 39.05% of the revenue in 2025 and remain compulsory under global codes. Magnetic flux leakage, ultrasonics, and EMAT tools detect corrosion and cracks before failure, anchoring the services lineup. Yet, digital monitoring and analytics grow at an 8.07% CAGR as cloud dashboards transform raw signals into actionable risk scores. Operators adopt continuous monitoring to defer costly full-bore inspections, lifting demand for sensor integration and AI model training.
Cleaning, repair, and cathodic-protection programs round out the service mix, each scaling with mileage and age. Providers bundling mechanical services with software analytics secure stickier contracts. The shift toward outcome-based pricing accelerates, tying fees to leak-rate reduction or uptime gains inside the pipeline integrity management market.
Geography Analysis
North America retained 38.85% revenue share in 2025, backed by the world's largest roster of aging lines and rigorous PHMSA oversight. Retrofit spending focuses on high-resolution cracking tools, methane-focused leak-detection, and AI-driven dig programs. Canada faces similar aging challenges in Arctic climates, while Mexico's new trunk lines incorporate baseline smart-pig runs and fiber optics from the outset.
The Asia Pacific region records the fastest 7.56% CAGR as China, India, and Southeast Asian nations expand their gas and LNG grids. Project owners contract integrity design services during FEED to embed monitoring systems. Domestic vendors partner with global specialists to meet local content targets while accessing cutting-edge tools. Hydrogen demonstration corridors in Japan and South Korea further widen the opportunity.
Europe's mature network encounters rising hydrogen-blend mandates, prompting material verification and retesting. Norway's offshore arteries demand hyperbaric repair readiness. The Middle East invests in ultra-deepwater integrity and CO2 pipelines linked to blue hydrogen hubs, whereas Africa's greenfield networks favor turnkey integrity packages from the outset. South America concentrates on Brazil's pre-salt flowlines and Argentina's shale export corridors. These regional dynamics collectively support the durable expansion of the pipeline integrity management market.
- Baker Hughes Company
- SGS SA
- Bureau Veritas SA
- DNV AS
- TD Williamson Inc.
- Emerson Electric Co.
- ROSEN Group
- TUV Rheinland AG
- Intertek Group plc
- Applus+ Servicios Tecnologicos
- Quest Integrity Group
- Infosys Ltd.
- EnerMech Ltd.
- MATCOR Inc.
- PwC Asset Integrity Services
- Fluor Corporation
- Wood plc
- Aker Solutions ASA
- TechnipFMC plc
- Oceaneering International Inc.
Additional Benefits:
- The market estimate (ME) sheet in Excel format
- 3 months of analyst support
TABLE OF CONTENTS
1 Introduction
- 1.1 Study Assumptions & Market Definition
- 1.2 Scope of the Study
2 Research Methodology
3 Executive Summary
4 Market Landscape
- 4.1 Market Overview
- 4.2 Market Drivers
- 4.2.1 Aging pipeline networks in OECD create a retrofit wave
- 4.2.2 Stringent integrity-related regulations (PHMSA, CSA Z662)
- 4.2.3 On-going build-out of long-haul gas lines in APAC & MEA
- 4.2.4 Off-shore ultra-deepwater projects (>1 500 m) surge
- 4.2.5 AI-enabled digital twins slash inspection downtime
- 4.2.6 New hydrogen/CO? pipelines need higher integrity specs
- 4.3 Market Restraints
- 4.3.1 CAPEX cyclicality of upstream & mid-stream spending
- 4.3.2 High initial cost of advanced ILI tools
- 4.3.3 Cyber-security risk slowing IoT sensor rollout
- 4.3.4 Shortage of certified NDE technicians
- 4.4 Supply-Chain Analysis
- 4.5 Regulatory Landscape
- 4.6 Technological Outlook
- 4.7 Porter's Five Forces
- 4.7.1 Bargaining Power of Suppliers
- 4.7.2 Bargaining Power of Buyers
- 4.7.3 Threat of New Entrants
- 4.7.4 Threat of Substitutes
- 4.7.5 Intensity of Rivalry
- 4.8 Oil & Gas Operating Pipeline Length Outlook
- 4.9 Key Midstream Projects Information
5 Market Size & Growth Forecasts
- 5.1 By Product Type
- 5.1.1 Crude Oil
- 5.1.2 Natural Gas
- 5.1.3 Refined Products
- 5.1.4 LNG
- 5.2 By Service Type
- 5.2.1 Inspection Services
- 5.2.2 Cleaning Services
- 5.2.3 Repair and Refurbishment Services
- 5.2.4 Digital Monitoring and Analytics
- 5.2.5 Cathodic-protection Services
- 5.3 By Phase
- 5.3.1 New-build Pipelines
- 5.3.2 Operational/Brown-field Pipelines
- 5.4 By Solution Type
- 5.4.1 Hardware (ILI tools, sensors)
- 5.4.2 Software (Integrity platforms)
- 5.4.3 Services (EPC and O&M)
- 5.5 By Location of Deployment
- 5.5.1 On-shore
- 5.5.2 Off-shore
- 5.6 By Geography
- 5.6.1 North America
- 5.6.1.1 United States
- 5.6.1.2 Canada
- 5.6.1.3 Mexico
- 5.6.2 Europe
- 5.6.2.1 Norway
- 5.6.2.2 United Kingdom
- 5.6.2.3 Russia
- 5.6.2.4 Netherlands
- 5.6.2.5 Germany
- 5.6.2.6 Rest of Europe
- 5.6.3 Asia Pacific
- 5.6.3.1 China
- 5.6.3.2 India
- 5.6.3.3 Japan
- 5.6.3.4 South Korea
- 5.6.3.5 ASEAN Countries
- 5.6.3.6 Australia
- 5.6.3.7 Rest of Asia-Pacific
- 5.6.4 South America
- 5.6.4.1 Brazil
- 5.6.4.2 Argentina
- 5.6.4.3 Colombia
- 5.6.4.4 Rest of South America
- 5.6.5 Middle East and Africa
- 5.6.5.1 Saudi Arabia
- 5.6.5.2 United Arab Emirates
- 5.6.5.3 Qatar
- 5.6.5.4 Nigeria
- 5.6.5.5 South Africa
- 5.6.5.6 Rest of Middle East and Africa
- 5.6.1 North America
6 Competitive Landscape
- 6.1 Market Concentration
- 6.2 Strategic Moves (M&A, Partnerships, PPAs)
- 6.3 Market Share Analysis (Market Rank/Share for key companies)
- 6.4 Company Profiles (includes Global level Overview, Market level overview, Core Segments, Financials as available, Strategic Information, Products & Services, and Recent Developments)
- 6.4.1 Baker Hughes Company
- 6.4.2 SGS SA
- 6.4.3 Bureau Veritas SA
- 6.4.4 DNV AS
- 6.4.5 TD Williamson Inc.
- 6.4.6 Emerson Electric Co.
- 6.4.7 ROSEN Group
- 6.4.8 TUV Rheinland AG
- 6.4.9 Intertek Group plc
- 6.4.10 Applus+ Servicios Tecnologicos
- 6.4.11 Quest Integrity Group
- 6.4.12 Infosys Ltd.
- 6.4.13 EnerMech Ltd.
- 6.4.14 MATCOR Inc.
- 6.4.15 PwC Asset Integrity Services
- 6.4.16 Fluor Corporation
- 6.4.17 Wood plc
- 6.4.18 Aker Solutions ASA
- 6.4.19 TechnipFMC plc
- 6.4.20 Oceaneering International Inc.
7 Market Opportunities & Future Outlook
- 7.1 White-space & Unmet-need Assessment

 管道維護市場:按服務、方法、組件、材料、運輸類型、安裝環境和最終用戶分類-2026-2032年全球市場預測管道管理解決方案市場:按部署模式、組件、組織規模和產業分類-2026年至2032年全球預測
 管道維護管理市場規模、佔有率、趨勢和預測:按行業、服務類型、部署地點和地區分類,2026-2034 年
 2026年全球管道完整性管理市場報告
 管道完整性管理市場-全球產業規模、佔有率、趨勢、機會、預測:按產業、地點、服務類型、地區和競爭對手分類,2021-2031年
 全球管道完整性管理市場,2026-2030年
 管道維護市場規模、佔有率和成長分析(按服務、產品、地區、應用和地理位置分類)-2026-2033年產業預測
 管道完整性管理市場規模、佔有率、趨勢分析報告:按地點、按服務、按地區、按細分市場預測,2025 年至 2030 年
 開發平台(管線)調整性管理市場,規模,佔有率,趨勢,產業分析報告:場所,各類服務,各地區,2025年~2034年的市場預測管道完整性管理市場:2024-2031年全球產業分析、規模、佔有率、成長、趨勢、預測