


 |
市場調查報告書
商品編碼
2061587
蒸氣渦輪:市場佔有率分析、產業趨勢與統計、成長預測(2026-2031)Steam Turbine - Market Share Analysis, Industry Trends & Statistics, Growth Forecasts (2026 - 2031) |
||||||
※ 本網頁內容可能與最新版本有所差異。詳細情況請與我們聯繫。
根據 Mordor Intelligence 預測,蒸氣渦輪市場規模將從 2025 年的 187.4 億美元成長到 2026 年的 193.3 億美元,然後在 2031 年達到 224.8 億美元,2026 年至 2031 年的複合年成長率為 3.07%。
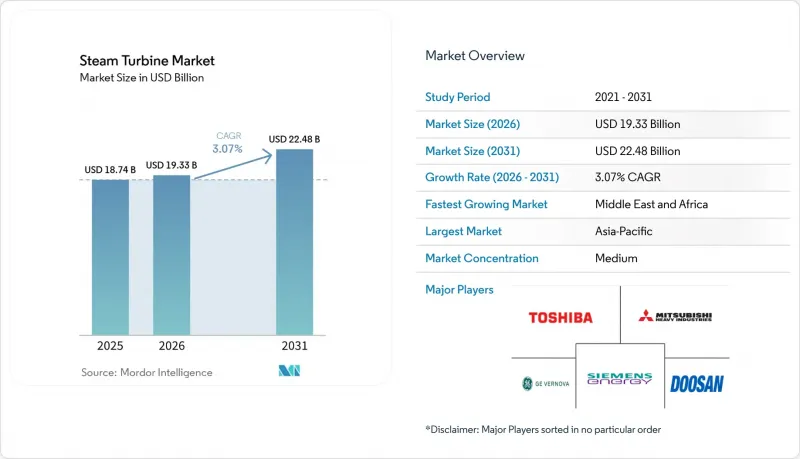
本報告按發電量(低於300兆瓦、300-600兆瓦、高於600兆瓦)、電廠燃料(煤炭、天然氣、核能、生質能/垃圾焚化發電)、終端用戶產業(發電、石油和天然氣、工業及其他)以及地區(北美、歐洲、亞太、南美、中東和非洲)進行細分。市場規模和預測均以美元計價。
全球蒸氣渦輪市場趨勢與洞察
隨著燃煤電廠逐步淘汰,電網對彈性基本負載容量的需求激增。
具備快速啟動和減速能力的蒸氣渦輪被保留下來,作為同步電容器,為風能和太陽能發電佔比已超過40%的電網提供慣性力。美國一些電力公司已經退役了老舊的亞臨界燃煤機組,現在正利用可在30分鐘內完成同步的氫能相容型聯合循環發電機組重建其併網權。這是美國中部地區幾家獨立電網營運商(ISO)在容量競標中明確提出的要求。德國業者已將褐煤電廠的關閉時間推遲到2030年,他們正在訂購單晶矽葉片汽輪機,這些汽輪機每天可運行兩個循環而不會出現蠕變損傷。這些機組將在晚間用電高峰期提供電壓穩定,此時電池的續航時間已超過4小時,抵消了可再生能源因限電而受到的處罰。因此,與傳統設計相比,提供更佳循環性能和綜合慣性組件的蒸氣渦輪市場參與企業,其設備價格溢價高達8%至12%。
利用先進蒸氣渦輪改造老舊聯合循環發電廠
2000年至2010年間安裝的約120吉瓦F級燃氣發電廠已接近設計壽命終點,由此引發了一波改造浪潮,旨在用H級或J級設備替換老舊的蒸氣渦輪。通常情況下,增加500兆瓦的輸出功率可使淨效率提高2-3個百分點,並將資產壽命延長20年。這僅需新建設(待開發區)所需投資的40-50%,且在天然氣價格為每百萬英熱單位4美元的情況下,投資可在不到7年的時間內收回。歐盟的碳排放強度法規鼓勵電力公司選擇維修而非新建設,這樣可以保留現有的電網許可和水權。供應商提供的模組化汽輪機組可安裝在現有基礎上,從而將停機時間從16週縮短至10週,降低了商業電廠的收入損失風險。在英國的多個容量市場競標中,氫氣混燒的接受度上限為 30%(體積比),這已成為強制性競標,進一步刺激了電力改造需求。
公用事業規模太陽能發電+儲能的平準化電成本快速下降
預計2025年,四小時鋰離子儲能系統與太陽能發電結合,其全球加權平均電力成本(LCOE)將達到每兆瓦時56美元,比陽光充足地區的新建聯合循環燃氣發電廠更經濟。由於沙漠和熱帶地區的產能利用率超過30%,電力公司正在逐步取消蒸氣發電契約,轉向可再生能源組合,這可能導致短期內每年約1吉瓦的潛在需求下降。儘管原始設備製造商(OEM)強調輔助服務和快速黑啟動能力帶來的收入,但液流電池和壓縮空氣儲能等長期儲能原型將在2028年後對這一優勢構成威脅。因此,專案開發商現在更加重視對天然氣和煤炭的依賴,將股本提高了200-250個基點。這正在縮小蒸氣渦輪市場的機會窗口。
細分市場分析
2025年,300-600兆瓦級蒸汽渦輪機將佔總銷量的59.8%,凸顯其在聯合循環和超臨界燃煤發電配置領域的領先地位。在該規模下,規模經濟效益與通用變壓器額定值和區域電網標準相符,確保高峰時段的優先輸出。隨著印度、埃及和沙烏地阿拉伯的電力公司最終敲定天然氣和核能基本負載發電計畫的競標,預計到2031年,該等級蒸氣渦輪的市場規模將達到135億美元。效率記錄不斷被刷新。預計到2025年,GE的9HA.02型蒸汽渦輪機的聯合循環淨效率將達到62.5%,而西門子能源的SGT6-9000HL型蒸汽渦輪機已證明其在不降低功率的情況下,能夠使用50%的氫氣進行燃燒。
預計300兆瓦以下機組的複合年成長率將超過整體市場成長率4.8%。這反映了東南亞和拉丁美洲的紙漿、紡織和食品產業叢集向現場汽電共生的產業轉型。 150-250兆瓦的萃取冷凝式機組正日益普及,因為與從電網購電相比,利用製程蒸氣可以將石化利潤率提高300個基點以上。在微型公用事業領域,100兆瓦以下的模組化機組主要服務於礦區和島嶼微電網,這些地區優先考慮的是快速部署而非最高的熱效率。同時,600兆瓦以上的機組市場仍然是一個小眾市場,僅限於印度新建的超臨界燃煤發電廠和一些AP1000核子反應爐項目。該領域面臨日益嚴峻的ESG(環境、社會和治理)挑戰,以及貸款機構投資意願的降低。
區域分析
2025年,亞太地區佔全球銷售額的47.6%,主導中國超臨界火力發電廠升級改造和印度煤核能混合發電專案的購買需求。在東南亞,2025年至2028年間新增15吉瓦熱電汽電共生,這得益於工業擴張和穩定的燃料供應。因此,該地區蒸氣渦輪市場除了大型機組訂單外,中型工業機組訂單也將持續成長。
受沙烏地阿拉伯30吉瓦燃氣獨立發電工程、阿拉伯聯合大公國巴拉卡核電廠全面運作以及埃及核能發電廠計畫的推動,中東和非洲的蒸氣渦輪市場預計將以5.3%的複合年成長率成長。來自傑夫拉和其他傳統天然氣氣田的天然氣供應正在加速聯合循環發電廠的建設,這些電廠可以將核能石油用於出口。同時,埃及和沙烏地阿拉伯對核能發電日益成長的興趣將在未來幾年鞏固對蒸汽渦輪機的需求,預計到2031年,該地區的市場佔有率將從2025年的12%成長至15%。
在北美和歐洲,由於燃煤電廠的逐步淘汰抵消了改造升級和區域供熱系統維修帶來的需求,市場將保持穩定或溫和成長。美國的成長主要得益於快速響應同步發電廠的容量市場獎勵,而歐洲的需求則集中在氫氣相容天然氣田和生質能熱電聯產上。南美市場仍然是一個小眾市場,主要由巴西的甘蔗渣熱電聯產和阿根廷的瓦卡-穆爾塔加斯(vaca-muertagas)開發項目驅動。這些趨勢共同維持了全球蒸氣渦輪市場收入來源的多元化。
其他好處:
- Excel格式的市場預測(ME)表
- 3個月的分析師支持
目錄
第1章:引言
- 研究假設和市場定義
- 調查範圍
第2章:調查方法
第3章執行摘要
第4章 市場狀況
- 市場概覽
- 市場促進因素
- 隨著電網逐步淘汰燃煤電廠,對靈活的基本負載電源的需求激增。
- 利用先進蒸氣渦輪改造老舊聯合循環發電廠
- 東南亞通膨後工業資本投資繁榮
- 升級改造適用於氫能的渦輪機將開啟未來的收入來源。
- 新興市場政府主導的新核能新建設計畫
- 採用抽汽冷凝裝置的脫碳區域供熱系統
- 市場限制因素
- 大型太陽能發電+儲能系統的平準化度電成本大幅下降。
- 由於水資源緊張法規的限制,對主要通道冷卻的許可有所限制。
- EPC執行週期的延長正在推高專案的內部報酬率。
- ESG法規實施後,石化燃料相關資產出現資本外流。
- 供應鏈分析
- 監理情勢
- 技術趨勢(材料、數位雙胞胎、超臨界二氧化碳)
- 波特五力模型
第5章 市場規模與成長預測
- 按產能
- 小於300兆瓦
- 300~600 MW
- 超過600兆瓦
- 植物燃料
- 煤炭
- 天然氣
- 核能
- 生質能/垃圾焚化發電
- 按最終用戶行業分類
- 發電
- 石油和天然氣(上游、中游和下游)
- 工業及其他
- 按地區
- 北美洲
- 美國
- 加拿大
- 墨西哥
- 歐洲
- 德國
- 英國
- 法國
- 義大利
- 北歐國家
- 俄羅斯
- 其他歐洲國家
- 亞太地區
- 中國
- 印度
- 日本
- 韓國
- 東南亞國協
- 其他亞太國家
- 南美洲
- 巴西
- 阿根廷
- 其他南美國家
- 中東和非洲
- 沙烏地阿拉伯
- 阿拉伯聯合大公國
- 南非
- 埃及
- 其他中東和非洲國家
- 北美洲
第6章 競爭情勢
- 市場集中度
- 策略趨勢(併購、聯盟、購電協議)
- 市場佔有率分析(主要公司的市場排名和佔有率)
- 公司簡介
- Siemens Energy AG
- GE Vernova Inc.
- Mitsubishi Heavy Industries Ltd.
- Toshiba Energy Systems & Solutions
- Dongfang Turbine Co. Ltd.
- Doosan Enerbility Co., Ltd.
- Bharat Heavy Electricals Ltd.
- Harbin Electric Corp.
- Ansaldo Energia SpA
- Fuji Electric Co., Ltd.
- Kawasaki Heavy Industries Ltd.
- MAN Energy Solutions SE
- Elliott Group
- Triveni Turbines Ltd.
- WEG SA
- Hitachi-Zosen Corp.(Energy Solutions)
- Shanghai Electric Group Co. Ltd.
- Baker Hughes Co.
- Nanjing Turbine & Electric Machinery Group
- Siemens-Gamesa(Steam generator for hybrid plants)
第7章 市場機會與未來展望
According to Mordor Intelligence, the steam turbine market size is expected to grow from USD 18.74 billion in 2025 to USD 19.33 billion in 2026 and is forecast to reach USD 22.48 billion by 2031 at 3.07% CAGR over 2026-2031.
This report is Segmented by Capacity (Below 300 MW, 300 To 600 MW, and Above 600 MW), Plant Fuel (Coal, Natural Gas, Nuclear, and Biomass/Waste-to-Energy), End-User Industry (Power Generation, Oil and Gas, and Industrial and Other), and Geography (North America, Europe, Asia-Pacific, South America, and Middle East and Africa). The Market Sizes and Forecasts are Provided in Terms of Value (USD).
Global Steam Turbine Market Trends and Insights
Surging Demand for Flexible Baseload Capacity in Coal-Retiring Grids
Steam turbines equipped with fast-start and low-turn-down features are being retained as synchronous condensers to supply inertia in grids where wind and solar penetration already exceeds 40%. U.S. utilities that decommissioned older subcritical coal units are now repowering interconnection rights with hydrogen-ready combined-cycle blocks that synchronize within 30 minutes, a requirement spelled out in several Midcontinent ISO capacity auctions. German operators delaying lignite closures until 2030 are ordering single-crystal bladed turbines that can cycle twice daily without creep damage. These installations provide voltage support during evening demand ramps longer than four-hour battery limits, offsetting curtailment penalties levied on renewables. Consequently, steam turbine market participants offering enhanced cycling capability and synthetic inertia packages are commanding 8% to 12% equipment price premiums over legacy designs.
Repowering of Ageing Combined-Cycle Plants with Advanced Class Steam Turbines
Roughly 120 GW of F-class gas plants installed between 2000 and 2010 are reaching design life, driving a repowering cycle that replaces aging steam trains with H- or J-class equipment. A typical 500 MW uprate boosts net efficiency by 2-3 percentage points and extends asset life 20 years at 40%-50% of greenfield capex, yielding paybacks under seven years at USD 4 per MMBtu gas prices. European Union carbon-intensity rules encourage utilities to retrofit rather than build new, preserving existing grid permits and water rights. Vendors supplying modular turbine trains that fit within existing foundations have shortened outage windows from 16 weeks to 10, reducing lost-revenue risk for merchant plants. Hydrogen co-firing tolerance up to 30% by volume is now a bid prerequisite in several U.K. capacity-market tenders, further stimulating repower demand.
Aggressive LCOE Decline of Utility-Scale Solar-Plus-Storage
Four-hour lithium-ion storage paired with PV reached a global weighted-average levelized cost of USD 56 per MWh in 2025, undercutting new combined-cycle gas in sunny markets. As capacity factors rise beyond 30% in deserts and tropics, utilities are canceling steam contracts in favor of renewable portfolios, trimming near-term addressable demand by almost 1 GW yearly. OEMs emphasize ancillary-service revenue and fast black-start capabilities, but long-duration storage prototypes such as flow batteries and compressed air threaten this advantage after 2028. Consequently, project developers now price gas and coal exposure higher, increasing required equity returns by 200-250 basis points, which compresses the steam turbine market opportunity window.
Other drivers and restraints analyzed in the detailed report include:
- Post-Inflation Industrial CAPEX Boom in South-East Asia
- Hydrogen-Ready Turbine Upgrades Unlocking Future Revenue Streams
- Water-Stress Regulations Curbing Once-Through Cooling Permits
For complete list of drivers and restraints, kindly check the Table Of Contents.
Segment Analysis
The 300 to 600 MW class contributed 59.8% of 2025 revenue, underscoring its dominance within combined-cycle and ultra-supercritical coal configurations. At this level, economies of scale match common transformer ratings and regional grid codes, ensuring dispatch priority during peak hours. The steam turbine market size for this class is forecast to rise to USD 13.5 billion by 2031 as utilities in India, Egypt, and Saudi Arabia finalize tenders for gas and nuclear baseload. Efficiency records continue to fall: GE's 9HA.02 notched 62.5% net combined-cycle efficiency in 2025, while Siemens Energy's SGT6-9000HL demonstrated 50% hydrogen capability without derate.
Below-300 MW units will outpace headline growth at 4.8% CAGR, mirroring an industrial pivot toward on-site cogeneration in Southeast Asia and LatAm pulp, textile, and food clusters. Extraction-condensing variants in the 150-250 MW band are gaining popularity, where process steam drives petrochemical margins upward of 300 basis points compared with grid purchases. At the micro-utility end, <100 MW modular trains address mining camps and island micro-grids that prize fast deployment over top-quartile heat rate. Conversely, the >600 MW bracket remains niche, restricted to new supercritical coal in India and select AP1000 reactor projects, facing stiffer ESG headwinds and limited lender appetite.
Geography Analysis
Asia-Pacific retained 47.6% of 2025 revenue as China's ultra-supercritical upgrades and India's coal-plus-nuclear trajectory dominated procurement. Southeast Asia added 15 GW of cogeneration through 2025-2028, reflecting industrial expansion and favorable fuel availability. As a result, the regional steam turbine market continues to generate large frame orders plus an accelerating volume of mid-sized industrial trains.
The Middle East and Africa steam turbine market is poised to grow at 5.3% CAGR, driven by Saudi Arabia's 30 GW gas-fired independent power projects, the United Arab Emirates' full Barakah ramp-up, and Egypt's nuclear and gas blend. Gas availability from Jafurah and other unconventional fields encourages combined-cycle builds that free oil for export. Concurrently, nuclear ambitions across Egypt and Saudi Arabia lock in multi-year turbine demand, elevating the regional contribution from 12% share in 2025 to an expected 15% by 2031.
North America and Europe experience flat-to-modest expansion as coal exits counterbalance repowering and district-heating retrofits. U.S. growth hinges on capacity-market incentives for fast-start synchronous capacity, while European demand centers on hydrogen-ready gas blocks and biomass CHP. South America remains niche, with Brazil's sugar-bagasse CHP and Argentina's Vaca Muerta gas development representing most activity. Together, these dynamics maintain global diversification of revenue streams within the steam turbine market.
- Siemens Energy AG
- GE Vernova Inc.
- Mitsubishi Heavy Industries Ltd.
- Toshiba Energy Systems & Solutions
- Dongfang Turbine Co. Ltd.
- Doosan Enerbility Co., Ltd.
- Bharat Heavy Electricals Ltd.
- Harbin Electric Corp.
- Ansaldo Energia SpA
- Fuji Electric Co., Ltd.
- Kawasaki Heavy Industries Ltd.
- MAN Energy Solutions SE
- Elliott Group
- Triveni Turbines Ltd.
- WEG SA
- Hitachi-Zosen Corp. (Energy Solutions)
- Shanghai Electric Group Co. Ltd.
- Baker Hughes Co.
- Nanjing Turbine & Electric Machinery Group
- Siemens-Gamesa (Steam generator for hybrid plants)
Additional Benefits:
- The market estimate (ME) sheet in Excel format
- 3 months of analyst support
TABLE OF CONTENTS
1 Introduction
- 1.1 Study Assumptions & Market Definition
- 1.2 Scope of the Study
2 Research Methodology
3 Executive Summary
4 Market Landscape
- 4.1 Market Overview
- 4.2 Market Drivers
- 4.2.1 Surging demand for flexible baseload capacity in coal-retiring grids
- 4.2.2 Repowering of ageing combined-cycle plants with advanced class steam turbines
- 4.2.3 Post-inflation industrial CAPEX boom in South-East Asia
- 4.2.4 Hydrogen-ready turbine upgrades unlocking future revenue streams
- 4.2.5 Government-led nuclear new-build programs in emerging markets
- 4.2.6 Decarbonized district-heating schemes using extraction-condensing units
- 4.3 Market Restraints
- 4.3.1 Aggressive LCOE decline of utility-scale solar-plus-storage
- 4.3.2 Water-stress regulations curbing once-through cooling permits
- 4.3.3 Slow EPC execution cycles inflating project IRRs
- 4.3.4 Financing flight from fossil-linked assets post-ESG mandates
- 4.4 Supply-Chain Analysis
- 4.5 Regulatory Landscape
- 4.6 Technological Outlook (Materials, Digital Twins, Super-critical CO2)
- 4.7 Porter's Five Forces
- 4.7.1 Bargaining Power of Suppliers
- 4.7.2 Bargaining Power of Consumers
- 4.7.3 Threat of New Entrants
- 4.7.4 Threat of Substitutes
- 4.7.5 Intensity of Competitive Rivalry
5 Market Size & Growth Forecasts
- 5.1 By Capacity
- 5.1.1 Below 300 MW
- 5.1.2 300 to 600 MW
- 5.1.3 Above 600 MW
- 5.2 By Plant Fuel
- 5.2.1 Coal
- 5.2.2 Natural Gas
- 5.2.3 Nuclear
- 5.2.4 Biomass/Waste-to-Energy
- 5.3 By End-user Industry
- 5.3.1 Power Generation
- 5.3.2 Oil and Gas (Up-/Mid-/Down-stream)
- 5.3.3 Industrial and Other
- 5.4 By Geography
- 5.4.1 North America
- 5.4.1.1 United States
- 5.4.1.2 Canada
- 5.4.1.3 Mexico
- 5.4.2 Europe
- 5.4.2.1 Germany
- 5.4.2.2 United Kingdom
- 5.4.2.3 France
- 5.4.2.4 Italy
- 5.4.2.5 NORDIC Countries
- 5.4.2.6 Russia
- 5.4.2.7 Rest of Europe
- 5.4.3 Asia-Pacific
- 5.4.3.1 China
- 5.4.3.2 India
- 5.4.3.3 Japan
- 5.4.3.4 South Korea
- 5.4.3.5 ASEAN Countries
- 5.4.3.6 Rest of Asia-Pacific
- 5.4.4 South America
- 5.4.4.1 Brazil
- 5.4.4.2 Argentina
- 5.4.4.3 Rest of South America
- 5.4.5 Middle East and Africa
- 5.4.5.1 Saudi Arabia
- 5.4.5.2 United Arab Emirates
- 5.4.5.3 South Africa
- 5.4.5.4 Egypt
- 5.4.5.5 Rest of Middle East and Africa
- 5.4.1 North America
6 Competitive Landscape
- 6.1 Market Concentration
- 6.2 Strategic Moves (M&A, Partnerships, PPAs)
- 6.3 Market Share Analysis (Market Rank/Share for key companies)
- 6.4 Company Profiles (includes Global level Overview, Market level overview, Core Segments, Financials as available, Strategic Information, Products & Services, and Recent Developments)
- 6.4.1 Siemens Energy AG
- 6.4.2 GE Vernova Inc.
- 6.4.3 Mitsubishi Heavy Industries Ltd.
- 6.4.4 Toshiba Energy Systems & Solutions
- 6.4.5 Dongfang Turbine Co. Ltd.
- 6.4.6 Doosan Enerbility Co., Ltd.
- 6.4.7 Bharat Heavy Electricals Ltd.
- 6.4.8 Harbin Electric Corp.
- 6.4.9 Ansaldo Energia SpA
- 6.4.10 Fuji Electric Co., Ltd.
- 6.4.11 Kawasaki Heavy Industries Ltd.
- 6.4.12 MAN Energy Solutions SE
- 6.4.13 Elliott Group
- 6.4.14 Triveni Turbines Ltd.
- 6.4.15 WEG SA
- 6.4.16 Hitachi-Zosen Corp. (Energy Solutions)
- 6.4.17 Shanghai Electric Group Co. Ltd.
- 6.4.18 Baker Hughes Co.
- 6.4.19 Nanjing Turbine & Electric Machinery Group
- 6.4.20 Siemens-Gamesa (Steam generator for hybrid plants)
7 Market Opportunities & Future Outlook
- 7.1 White-space & Unmet-need Assessment
 全球蒸氣渦輪市場
 蒸汽輪機
蒸汽輪機 蒸氣渦輪服務市場-全球產業規模、佔有率、趨勢、機會、預測:依產能、設計、服務、最終用戶、地區和競爭格局分類,2021-2031年
 工業蒸氣渦輪市場:依燃料類型、配置、運轉模式及應用分類-2026-2032年全球市場預測
 蒸氣渦輪市場報告:按排氣方式、容量、技術、應用和地區分類(2026-2034 年)
 蒸氣渦輪市場:按容量、應用和地區分類
 多級蒸氣渦輪(高達 5000kW)市場規模、佔有率、成長和全球產業分析:按類型、應用和地區分類的見解,以及 2026-2034 年的預測。蒸氣渦輪市場:按類型、級數和應用分類-2026-2032年全球預測
 2026年全球蒸氣渦輪售後市場報告工業蒸氣加濕器市場按產品類型、最終用戶產業、工作壓力、安裝方式和分銷管道分類,全球預測(2026-2032年)