


 |
市場調查報告書
商品編碼
2061502
提高採收率(EOR)市場:市場佔有率分析、產業趨勢與統計、成長預測(2026-2031)Enhanced Oil Recovery (EOR) - Market Share Analysis, Industry Trends & Statistics, Growth Forecasts (2026 - 2031) |
||||||

※ 本網頁內容可能與最新版本有所差異。詳細情況請與我們聯繫。
根據 Mordor Intelligence 預測,提高採收率(EOR) 市場規模將從 2025 年的 487.1 億美元成長到 2026 年的 504.6 億美元,到 2031 年將達到 602.1 億美元,2026 年至 2031 年的複合年成長率為 3.6%。
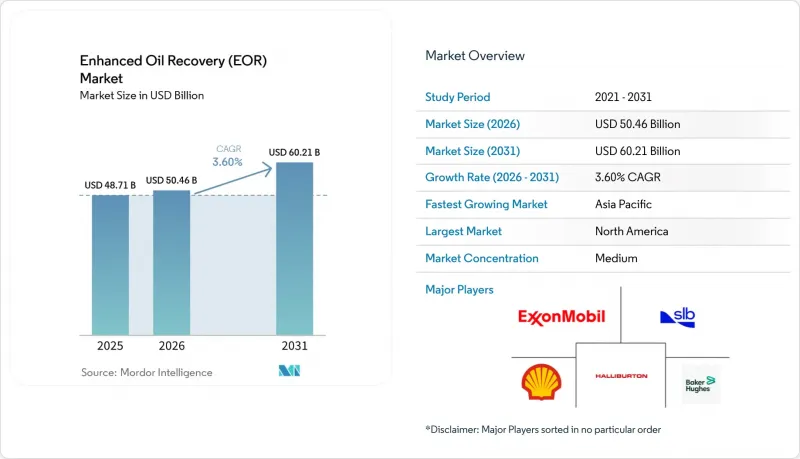
本報告按技術(注氣、注熱、注化學、微生物提高採收率、混合/新興技術)、儲存類型(砂岩、碳酸鹽岩、重油/瀝青、緻密/頁岩)、油田成熟度(成熟油田、現有油田、新油田)、部署地點(陸上/海上)和地區(北美、歐洲、亞太、南美等)進行分類。
全球提高採收率(EOR)市場趨勢與洞察
傳統型蘊藏量的枯竭正在推動三次石油開採。
全球石油產量仍依賴30多年前首次鑽探的儲存,而一級和二級採油技術仍將高達60%的原始石油儲量留在地下。因此,營運商正優先考慮可在現有基礎設施基礎上實施、對地表影響最小的三次採油方法。改良的儲存成像技術能夠識別先前未採油區域,從而透過選擇性注入提高採收率,而無需進行大規模的間歇性鑽井。數位雙胞胎透過在現場實施前模擬流體行為,進一步縮短了試驗誤週期。隨著新發現的減少和開發井向成本更高、尚未開發的地區轉移,提高採收率(EOR)已成為維持提高採收率市場免受原油價格波動影響的一種經濟可行的手段。
政府主導的二氧化碳稅收優惠政策和碳捕獲、利用與封存(CCUS)技術的發展
關鍵地區的生產稅額扣抵和資源稅減免正在縮短二氧化碳注入計畫的投資回收期。美國的45Q稅額扣抵為每一噸永久儲存的二氧化碳產生獨立的收入來源,將遵守排放法規轉化為現金流。沙烏地阿拉伯計劃在朱拜勒建造一個年處理能力達900萬噸的二氧化碳捕集中心,這表明國有企業正在將捕集、運輸和封存整合到一個統一的價值鏈中。財政支持降低了加權平均資本成本,吸引了注重環境、社會和治理(ESG)的投資者進入原油市場,而原油目前已獲得碳中和認證。隨著更多地區引入明確的碳定價機制,提高採收率市場將獲得結構性利好,而非週期性成長。
在價格波動下,熱處理流程的資本支出(Capex)和營運成本(Opex)較高。
由於需要蒸汽產生器、水處理系統和燃料氣管道,熱力採油(EOR)仍然是資本密集技術。原油價格下跌或天然氣價格上漲都會大幅壓縮利潤空間,迫使業者延後維修工程。在缺水地區,用卡車運輸淡水或安裝大規模循環水處理廠的成本會增加營運負擔。新興的地下燃燒技術有望提高效率,但仍需要專業人員和硬體物流。這種成本敏感性導致預算撥款被轉移到天然氣和化學品法規方面,限制了蒸氣主導專案在短期內於提高採收率市場的發展。
細分市場分析
預計到2025年,熱力採油方法將佔總收入的44.85%,凸顯其在加拿大和加州重油油田的穩固地位。儘管業者已將鍋爐維修為使用低碳燃料的燃燒器,但蒸汽注入法(SAGD)和週期性蒸氣增產(CSS)仍能維持穩定的產量水準。以可溶性二氧化碳注入為代表的氣體注入技術是全球成長最快的技術,預計到2031年複合年成長率將達到6.42%。因此,透過氣體注入提高採收率的專案市場規模的成長速度超過了其他任何技術領域。混合製程(交替注入低鹽度水和二氧化碳或聚合物渣)因其結合了注水的清除作用和溶劑可溶性的優勢,在先導計畫中日益受到關注。生物界面活性劑和電磁加熱的實驗室突破前景廣闊,但仍處於實用化前的階段。
在工業用地能確保低成本人為二氧化碳供應的地區,天然氣注入的競爭日益激烈。美國墨西哥灣沿岸的叢集已經開始將煉油廠的廢氣摻入主幹管道,輸送至二疊紀盆地的注入設施;中東的運營商也在利用氨廠和甲醇廠進行類似的操作。在瀝青礦床中,蒸氣注入仍然佔據主導地位,因為儲存黏度仍然是製程選擇的決定性因素。然而,減少範圍1排放的趨勢正促使生產商轉向溶劑輔助蒸氣發生技術,這進一步模糊了提高採收率(EOR)市場中各種技術的界限。
砂岩佔目前產量的46.35%,這得益於其良好的孔隙度和長期以來用於為三次採油階段準備地層的靜水壓注入技術。砂岩在其他提高採收率)市場佔有率中主導主導地位,但傳統型地層正對其構成壓力,其中緻密/頁岩地層的複合年成長率預計將達到7.59%。水平鑽井過程中形成的微裂隙網路可作為界面活性劑和氣渣的通道,即使基質滲透率較低,也能顯著提高產量。碳酸鹽岩的潤濕性存在挑戰,但由於界面活性劑和聚合物混合物以及智慧水處理技術的應用,其採收率正在逐步提高,尤其是在中東的大型油田。
數位岩石分析有助於作業者模擬非均質碳酸鹽岩中的孔隙尺度流動,從而縮短化學配方設計時間。雖然稠油儲存因其高黏度仍需熱力採油,但溶劑-蒸氣混合採油方法可減少高達30%的用水量,進而緩解環境、社會和管治(ESG)壓力。由於地質條件決定了採油方法的選擇,因此提供多技術組合的供應商正在為各類儲存創造更大價值,並增強其在提高採收率市場的競爭力。
區域分析
預計到2025年,北美將引領提高採收率(EOR)市場,佔39.75%的銷售額,主要得益於二疊紀盆地的大規模二氧化碳注入和亞伯達油砂的熱採計畫。聯邦和省級政府的激勵措施,例如稅額扣抵和懷俄明州的資源稅豁免,已顯著降低了專案的損益平衡點。此外,一條長達8,000公里的管道網路將人為產生的二氧化碳輸送到油田入口。埃克森美孚預計2024年的收入將達到337億美元,這表明,從油氣開採到管道運輸的一體化經營模式對於盈利至關重要,即使在市場波動的情況下也是如此。
亞太地區是成長最快的地區,預計到2031年將以7.86%的複合年成長率成長。中國石油在大慶的聚合物注入計畫和中海油在渤海灣的氣體注入試點計畫清楚地展現了該技術的快速應用。泰國國家石油公司(PTTEP)累計2,610億泰銖用於2025年的上游資本支出,其中包括在泰國灣進行混相氣體系統的試點計畫。澳洲達爾文的碳捕獲、利用與封存(CCUS)中心和日本長期進行的近海二氧化碳回注試驗進一步提升了該地區的技術能力。隨著工業脫碳的推進,中國、韓國和印度的氫能相關二氧化碳供應叢集將增強提高採收率市場的成長基礎。
歐洲正保持穩定成長勢頭,以英國和挪威為中心。北海油氣業者正將二氧化碳儲存與遠距離鑽井結合,以開採上層油藏。根據歐盟分類法規,永久性二氧化碳儲存被歸類為永續技術,為特定資產開闢了綠色債券資金籌措管道。在中東,富含天然裂縫的碳酸鹽岩地層正被充分利用。沙烏地阿美朱拜勒樞紐的目標是每年回收900萬噸二氧化碳,其中大部分將用於加瓦爾油田和其他大型油田的混相氣注入。南美洲的成長主要集中在巴西用於鹽鹽層下油藏的FPSO(浮式生產儲卸油船),該FPSO配備了回注迴路;以及委內瑞拉的重質燃料油區塊,該區塊準備在提高採收率市場製裁放鬆後立即引入溶劑蒸氣混合開採方法。
由於區域政策和資源條件的差異,各地採用提高採收率技術的進程有所不同。然而,目前各地區都已將提高採收率技術納入其長期供應計劃,這鞏固了整體提高採收率市場的需求。
其他好處:
- Excel格式的市場預測(ME)表
- 3個月的分析師支持
目錄
第1章:引言
- 市場分析與定義的前提條件
- 分析範圍
第2章 分析方法
第3章執行摘要
第4章 市場狀況
- 市場概覽
- 市場促進因素
- 由於傳統型蘊藏量。
- 政府主導的二氧化碳稅收優惠政策和碳捕獲、利用與封存(CCUS)系統的發展。
- 北美和中東的成熟油田正接近產量遞減曲線。
- 來自新型藍/綠氫計畫的二氧化碳供應
- 透過海洋數位岩石分析降低提高採收率篩檢成本
- 透過低鹽奈米流體混合物降低藥物劑量
- 市場限制因素
- 價格波動導致熱處理製程的資本投入和營運成本高昂
- 用水和排放許可證核准延誤
- 美國試點叢集以外的食品加工產業二氧化碳短缺
- 與環境、社會及治理 (ESG) 相關的貸款機構(不包括石油產量成長項目)
- 供應鏈分析
- 監理情勢
- 技術展望
- 波特五力分析
第5章:預測市場規模與成長率
- 透過技術
- 氣體注入(二氧化碳共注入、氮氣注入、烴類氣體注入)
- 熱注入(蒸氣注入、原位燃燒、週期性蒸氣刺激)
- 化學注入(聚合物驅油、界面活性劑-聚合物(SP)驅油、鹼-界面活性劑-聚合物(ASP)驅油、奈米流體驅油)
- 微生物提高採收率(生物界面活性劑注射、生物聚合物注射)
- 混合和新興技術(低鹽水注入、CO2-WAG、電磁波輔助加熱)
- 依儲存類型
- 砂岩
- 碳酸鹽岩
- 重油和瀝青
- 緻密/頁岩
- 油田成熟度
- 成熟油田
- 現有油田
- 新油田
- 按部署位置
- 陸上
- 離岸
- 按地區
- 北美洲
- 美國
- 加拿大
- 墨西哥
- 歐洲
- 德國
- 英國
- 法國
- 義大利
- 北歐國家
- 俄羅斯
- 其他歐洲國家
- 亞太地區
- 中國
- 印度
- 日本
- 韓國
- 東南亞國協
- 其他亞太國家
- 南美洲
- 巴西
- 阿根廷
- 其他南美國家
- 中東和非洲
- 沙烏地阿拉伯
- 阿拉伯聯合大公國
- 卡達
- 南非
- 埃及
- 其他中東和非洲國家
- 北美洲
第6章 競爭情勢
- 市場集中度
- 策略趨勢(併購、聯盟、購電協議)
- 市場佔有率分析(主要公司的市場排名和佔有率)
- 公司簡介
- Baker Hughes Company
- Schlumberger Ltd.
- Halliburton Company
- Exxon Mobil Corp.
- Shell plc
- BP plc
- TotalEnergies SE
- Chevron Corp.
- Weatherford International plc
- Praxair/Linde plc
- Occidental Petroleum Corp.
- Denbury Inc.
- Cenovus Energy Inc.
- China National Petroleum Corp.(CNPC)
- Sinopec
- Petrobras
- Petronas
- ConocoPhillips
- Eni SpA
- EOG Resources
第7章 市場機會與未來展望
According to Mordor Intelligence, the enhanced oil recovery market size is expected to grow from USD 48.71 billion in 2025 to USD 50.46 billion in 2026 and is forecast to reach USD 60.21 billion by 2031 at 3.6% CAGR over 2026-2031.
This report is Segmented by Technology (Gas Injection, Thermal Injection, Chemical Injection, Microbial EOR, and Hybrid and Emerging), Reservoir Type (Sandstone, Carbonate, Heavy Oil and Bitumen, and Tight/Shale), Field Maturity (Mature Fields, Brownfields, and Greenfields), Location of Deployment (Onshore and Offshore), and Geography (North America, Europe, Asia-Pacific, South America, and More).
Global Enhanced Oil Recovery (EOR) Market Trends and Insights
Depleting Conventional Reserves Pushing Tertiary Recovery
Global production still relies on reservoirs first drilled 30 or more years ago, and primary plus secondary techniques leave as much as 60% of original oil in place. Operators are therefore prioritizing tertiary methods that can be layered onto existing infrastructure with minimal surface disruption. Improved reservoir imaging now pinpoints previously unswept zones, enabling selective injection that boosts recovery without the need for extensive infill drilling. Digital twins further reduce trial-and-error cycles by simulating fluid behaviour before field execution. As discovery volumes shrink and development wells move into more costly frontier acreage, EOR becomes the economically rational route for sustaining supply, insulating the enhanced oil recovery market against crude price swings.
Government-Backed CO2 Tax Incentives & CCUS Build-out
Production tax credits and severance tax reductions in key jurisdictions compress the payback periods for CO2 flood projects. The United States' 45Q credit adds a separate revenue stream for every tonne of CO2 permanently stored, converting emissions compliance into a cash flow. Saudi Arabia's plan for a 9 million tonnes per year capture hub at Jubail demonstrates how state entities are integrating capture, transport, and sequestration into a single, unified value chain. Fiscal support lowers the weighted average cost of capital, drawing ESG-constrained investors into barrels that now qualify as carbon-neutral. As more regions impose explicit carbon prices, the enhanced oil recovery market gains structural tailwinds rather than cyclic boosts.
High Cap-ex & Opex of Thermal Processes Under Price Volatility
Steam generators, water-treatment units, and fuel gas lines make thermal EOR the most capital-intensive option. Margins compress sharply when crude prices dip or natural-gas feedstock rises, causing operators to defer workovers. Regions with water scarcity must pay to truck in freshwater or install large recycling plants, adding operational burden. Emerging down-hole combustion tools promise efficiency gains yet still demand specialised crews and hardware logistics. These cost sensitivities divert budgets toward gas or chemical methods, limiting near-term expansion of steam-dominated projects in the enhanced oil recovery market.
Other drivers and restraints analyzed in the detailed report include:
- Mature Fields in North America & Middle East Nearing Decline Curves
- CO2 Availability via New Blue/Green Hydrogen Projects
- ESG-Linked Lenders Excluding Incremental-Oil Projects
For complete list of drivers and restraints, kindly check the Table Of Contents.
Segment Analysis
Thermal methods contributed 44.85% of 2025 revenue, underscoring their entrenched role in heavy-oil plays across Canada and California. Steam-assisted gravity drainage and cyclic steam stimulation continue to yield predictable barrels, even as operators retrofit boilers with burners that use low-carbon fuels. Gas injection, led by miscible CO2 flooding, is posting the quickest global adoption, with a 6.42% CAGR outlook through 2031. The enhanced oil recovery market size for gas-injection projects is therefore expanding faster than any other technology cohort. Hybrid processes, low-salinity water alternating with CO2 or polymer slugs, are gaining traction in pilots because they combine the sweep of water floods with the miscibility gains of solvents. Laboratory breakthroughs in biosurfactants and electromagnetic heating show promise but remain at pre-commercial stages.
The competitiveness of gas injection rises where industrial hubs guarantee a low-cost anthropogenic CO2 supply. U.S. Gulf-Coast clusters already mix refinery off-gases into trunk lines that feed Permian injectors, while Middle East operators leverage ammonia and methanol plants for the same purpose . Steam remains dominant in bitumen deposits because reservoir viscosity still rules process choice. Nevertheless, the drive to curb scope-1 emissions nudges producers toward solvent-assisted steam generation, further blurring technology boundaries inside the enhanced oil recovery market.
Sandstone delivers 46.35% of current volumes thanks to its favourable porosity and long history of water flooding that preconditions reservoirs for tertiary stages. The enhanced oil recovery market share, led by sandstone, is under pressure from unconventional formations, where tight/shale reservoirs are expected to show a 7.59% CAGR outlook. Micro-fracture networks formed during horizontal drilling serve as pathways for surfactant and gas slugs, facilitating significant incremental recovery despite low matrix permeability. Carbonates pose wettability challenges; nonetheless, surfactant-polymer blends and smart-water techniques are incrementally improving recovery factors, especially in Middle East super-giants.
Digital-rock analytics helps operators model pore-scale flow in heterogenous carbonates, trimming design time for chemical formulations. Heavy-oil reservoirs still require thermal inputs due to their high viscosity, yet solvent-steamed hybrids are reducing water requirements by up to 30%, thereby easing ESG pressures. As geology dictates method selection, suppliers offering multi-technology portfolios capture greater value across reservoir classes, thereby reinforcing their competitive positioning in the enhanced oil recovery market.
Geography Analysis
North America leads the enhanced oil recovery market with a 39.75% revenue share in 2025, generated by large-scale CO2 floods in the Permian Basin and thermal operations in Alberta's oil sands. Federal and state incentives such as the 45Q credit and Wyoming's severance-tax exemption materially lower project breakevens, while an 8,000-km pipeline grid delivers anthropogenic CO2 at the field gate. ExxonMobil's 2024 earnings of USD 33.7 billion underscore the importance of integrated capture-to-pipeline business models in driving profitability, even under volatile market conditions.
The Asia-Pacific region is the fastest-growing, forecasted to grow at an 7.86% CAGR through 2031. PetroChina's polymer-flood programs in Daqing and CNOOC's pilot gas injection in Bohai Bay illustrate rapid technology diffusion. PTTEP earmarked THB 261 billion for 2025 upstream cap-ex, including pilot miscible gas systems in the Gulf of Thailand. Australia's Darwin CCUS hub and Japan's long-running offshore CO2 reinjection trials further expand regional skill sets. As industrial decarbonisation progresses, hydrogen-linked CO2 supply clusters in China, Korea, and India will reinforce growth fundamentals for the enhanced oil recovery market.
Europe maintains steady momentum, anchored by the UK and Norway, where North Sea operators integrate CO2 storage with extended-reach drilling to tap attic oil zones. EU taxonomy rules classify permanent CO2 storage as sustainable, unlocking green bond financing channels for selected assets. The Middle East leverages giant naturally fractured carbonates; Saudi Aramco's Jubail hub targets 9 million tons per year (t/y) capture, much of which will enter miscible-gas floods at Ghawar and other super-giants. South America's growth centres on Brazilian pre-salt FPSOs equipped for reinjection loops and Venezuelan heavy-oil blocks poised for solvent-steam hybrids once sanctions ease in the enhanced oil recovery market.
Together, geography-specific policy and resource conditions shape divergent adoption curves; yet, each region now embeds EOR into its long-term supply planning, thereby cementing demand across the enhanced oil recovery market.
- Baker Hughes Company
- Schlumberger Ltd.
- Halliburton Company
- Exxon Mobil Corp.
- Shell plc
- BP plc
- TotalEnergies SE
- Chevron Corp.
- Weatherford International plc
- Praxair/Linde plc
- Occidental Petroleum Corp.
- Denbury Inc.
- Cenovus Energy Inc.
- China National Petroleum Corp. (CNPC)
- Sinopec
- Petrobras
- Petronas
- ConocoPhillips
- Eni SpA
- EOG Resources
Additional Benefits:
- The market estimate (ME) sheet in Excel format
- 3 months of analyst support
TABLE OF CONTENTS
1 Introduction
- 1.1 Study Assumptions & Market Definition
- 1.2 Scope of the Study
2 Research Methodology
3 Executive Summary
4 Market Landscape
- 4.1 Market Overview
- 4.2 Market Drivers
- 4.2.1 Depleting conventional reserves pushing tertiary recovery
- 4.2.2 Government-backed CO2 tax incentives & CCUS build-out
- 4.2.3 Mature fields in N. America & Middle East nearing decline curves
- 4.2.4 CO? availability via new blue/green hydrogen projects
- 4.2.5 Offshore digital-rock analytics cutting EOR screening cost
- 4.2.6 Low-salinity nanofluid blends lowering chemical dose
- 4.3 Market Restraints
- 4.3.1 High cap-ex & opex of thermal processes under price volatility
- 4.3.2 Water-use & emissions permitting delays
- 4.3.3 Food-grade CO2 shortages outside U.S. pilot clusters
- 4.3.4 ESG-linked lenders excluding incremental-oil projects
- 4.4 Supply-Chain Analysis
- 4.5 Regulatory Landscape
- 4.6 Technological Outlook
- 4.7 Porter's Five Forces
- 4.7.1 Bargaining Power of Suppliers
- 4.7.2 Bargaining Power of Buyers
- 4.7.3 Threat of New Entrants
- 4.7.4 Threat of Substitutes
- 4.7.5 Intensity of Competitive Rivalry
5 Market Size & Growth Forecasts
- 5.1 By Technology
- 5.1.1 Gas Injection (CO2 Miscible Flooding, Nitrogen Injection, Hydrocarbon Gas Injection)
- 5.1.2 Thermal Injection (Steam Flooding, In-situ Combustion, Cyclic Steam Stimulation)
- 5.1.3 Chemical Injection (Polymer Flooding, Surfactant-Polymer (SP), Alkali-Surfactant-Polymer (ASP), Nanofluid EOR)
- 5.1.4 Microbial EOR (Biosurfactant Flooding, Biopolymer Flooding)
- 5.1.5 Hybrid and Emerging (Low-Salinity Waterflooding, CO2-WAG, EM-Assisted Heating)
- 5.2 By Reservoir Type
- 5.2.1 Sandstone
- 5.2.2 Carbonate
- 5.2.3 Heavy Oil and Bitumen
- 5.2.4 Tight/Shale
- 5.3 By Field Maturity
- 5.3.1 Mature Fields
- 5.3.2 Brownfields
- 5.3.3 Greenfields
- 5.4 By Location of Deployment
- 5.4.1 Onshore
- 5.4.2 Offshore
- 5.5 By Geography
- 5.5.1 North America
- 5.5.1.1 United States
- 5.5.1.2 Canada
- 5.5.1.3 Mexico
- 5.5.2 Europe
- 5.5.2.1 Germany
- 5.5.2.2 United Kingdom
- 5.5.2.3 France
- 5.5.2.4 Italy
- 5.5.2.5 NORDIC Countries
- 5.5.2.6 Russia
- 5.5.2.7 Rest of Europe
- 5.5.3 Asia-Pacific
- 5.5.3.1 China
- 5.5.3.2 India
- 5.5.3.3 Japan
- 5.5.3.4 South Korea
- 5.5.3.5 ASEAN Countries
- 5.5.3.6 Rest of Asia-Pacific
- 5.5.4 South America
- 5.5.4.1 Brazil
- 5.5.4.2 Argentina
- 5.5.4.3 Rest of South America
- 5.5.5 Middle East and Africa
- 5.5.5.1 Saudi Arabia
- 5.5.5.2 United Arab Emirates
- 5.5.5.3 Qatar
- 5.5.5.4 South Africa
- 5.5.5.5 Egypt
- 5.5.5.6 Rest of Middle East and Africa
- 5.5.1 North America
6 Competitive Landscape
- 6.1 Market Concentration
- 6.2 Strategic Moves (M&A, Partnerships, PPAs)
- 6.3 Market Share Analysis (Market Rank/Share for key companies)
- 6.4 Company Profiles (includes Global level Overview, Market level overview, Core Segments, Financials as available, Strategic Information, Products & Services, and Recent Developments)
- 6.4.1 Baker Hughes Company
- 6.4.2 Schlumberger Ltd.
- 6.4.3 Halliburton Company
- 6.4.4 Exxon Mobil Corp.
- 6.4.5 Shell plc
- 6.4.6 BP plc
- 6.4.7 TotalEnergies SE
- 6.4.8 Chevron Corp.
- 6.4.9 Weatherford International plc
- 6.4.10 Praxair/Linde plc
- 6.4.11 Occidental Petroleum Corp.
- 6.4.12 Denbury Inc.
- 6.4.13 Cenovus Energy Inc.
- 6.4.14 China National Petroleum Corp. (CNPC)
- 6.4.15 Sinopec
- 6.4.16 Petrobras
- 6.4.17 Petronas
- 6.4.18 ConocoPhillips
- 6.4.19 Eni SpA
- 6.4.20 EOG Resources
7 Market Opportunities & Future Outlook
- 7.1 White-space & Unmet-Need Assessment

 提高石油採收率(EOR)市場規模、佔有率、成長、全球產業分析、區域趨勢及2026年至2034年預測。
 化學提高採收率(EOR)市場-2026-2032年全球市場預測提高採收率市場:依方法、儲存類型、採收機制、應用與部署類型分類-2026-2032年全球市場預測
 利用微生物提高採收率的市場:依注入方法、應用、井位置和地區分類。
 強化石油萃取市場報告:按技術、應用和地區分類(2026-2034 年)全球提高採收率裝置(EOR)市場規模、佔有率、趨勢和成長分析報告(2026-2034)強化石油萃取市場:依技術、應用和地區分類
 氣體注入強化採油市場規模、佔有率和成長分析:按方法、儲存深度、部署策略、應用、最終用戶和地區分類-2026-2033年產業預測
 2026年全球提高石油採收率市場報告
 微生物強化採油市場-全球產業規模、佔有率、趨勢、機會及預測(按類型、機制、細菌注入、地區和競爭格局分類,2021-2031年)