


 |
市場調查報告書
商品編碼
2061497
直驅式風力發電機:市場佔有率分析、行業趨勢和統計數據以及成長預測(2026-2031 年)Direct Drive Wind Turbine - Market Share Analysis, Industry Trends & Statistics, Growth Forecasts (2026 - 2031) |
||||||
※ 本網頁內容可能與最新版本有所差異。詳細情況請與我們聯繫。
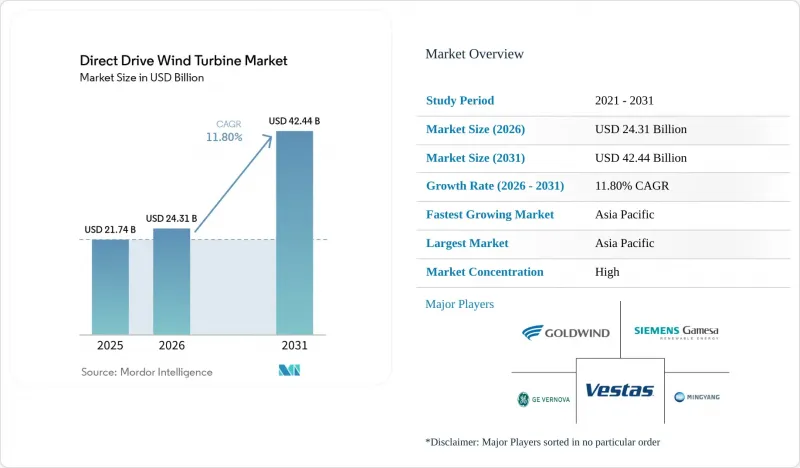
根據 Mordor Intelligence 估計,到 2026 年,直驅風力發電機市場價值將達到 243.1 億美元,從 2025 年的 217.4 億美元成長到 2031 年的 424.4 億美元。
預計 2026 年至 2031 年的複合年成長率為 11.80%。
本報告按輸出功率等級(3MW 以下、3MW-8MW、8MW 以上)、發電機技術(永磁同步和勵磁同步)、安裝類型(陸上、固定式海上、浮體式海上)、應用(公用事業規模風電場和分佈式)以及地區(北美、歐洲、亞太、南美、中東和非洲)進行分類。
全球直驅式風力發電機市場趨勢與洞察
降低4兆瓦以上直驅風力發電機組的平準化電力成本(LCOE)。
預計2024年,風電的平均平準化能源成本(LCOE)將達到0.033美元/度數時,較2010年下降70%。這主要歸功於無齒輪箱設計消除了一個主要的維護成本因素。海上工程從中受益最大,因為齒輪箱的遠端維護成本高且後勤複雜。更大的機艙尺寸即使增加了發電機的質量,也能降低每兆瓦的成本,從而強化了規模降低單位成本的良性循環。浮體式平台由於簡化了傳動系統,減少了在惡劣海洋環境中的檢查頻率,進一步提升了成本節約。隨著電力公司開始將4兆瓦以上的風力渦輪機作為標準配置,直驅風力發電機市場正在建立起結構性的成本優勢。
歐盟、英國和中國的離岸風力發電快速建造目標
歐盟法規的目標是到2030年離岸風力發電裝置容量達到60吉瓦,到2050年達到300吉瓦,中國和英國也制定了類似的宏偉藍圖。目前,已規劃的專案總裝置容量超過400吉瓦,原始設備製造商(OEM)被敦促將直驅系統的額定輸出功率提高到15兆瓦以上,以最大限度地能源回收。到2024年,浮體式海上風電的在建工程規模預計將達到270兆瓦至244吉瓦,其中,適合無變速箱系統的深海域的潛力日益成長。明確的政策方向正在為新電站的資金籌措和多吉瓦級框架合約的簽訂創造條件。
機艙重量的增加將推高陸上運輸現場的物流成本。
一台10兆瓦的直驅式發電機重約300噸,這顯著增加了塔筒鋼材和運輸成本。塔筒部件已佔風機總成本的26%。由於運輸路線的限制,每台2兆瓦的風扇可能需要多達11輛超大型卡車運輸,這可能會使每颱風機的起重機租賃成本增加10萬美元。儘管原始設備製造商(OEM)正在尋求模組化發電機和現場組裝,但這會增加現場品質風險。
細分市場分析
預計3MW至8MW級直驅風力發電機市場將於2025年達到峰值,佔總銷售量的43.25%。這一成長主要得益於陸上風力發電機的日益普及,因為陸上風力發電機的物流管理相對容易。然而,由於固定式和漂浮式浮體式海上電專案預計都將實現較高的產能利用率,預計15MW以上的風力發電機將經歷最快的成長,複合年成長率將達到21.96%。
每兆瓦裝置容量資本支出的下降促使開發商訂購更大功率的風力發電機,但認證延遲仍然是一大障礙。維斯塔斯僅其V236-15.0兆瓦機型就已獲得7吉瓦的確定訂單,顯示市場對巨型機艙充滿信心。然而,沿海船廠的運輸和起重能力仍然是快速擴大產能的障礙。
到2025年,永磁同步發電機組將佔據直驅式風力發電機市場87.90%的佔有率,預計到2031年將以12.45%的複合年成長率成長,因為其高效性和低維護成本的優勢超過了人們對磁體成本的擔憂。由於沒有轉子繞組損耗,永磁同步發電機組能夠實現更高的能量輸出,並更容易滿足不斷變化的併網法規要求。電勵磁式風力發電機組的市佔率正在萎縮,主要用於那些對磁鐵供應穩定性要求高於能源效率的應用情境。
回收技術的進步和替代材料的出現正逐步緩解永磁同步發電機的成本挑戰,並有可能進一步擴大其優勢。電能同步發電機供應商強調設計的柔軟性和無磁供應鏈,但維護的複雜性和較低的產量阻礙了其廣泛應用。儘管從長遠來看,超導技術的研究可能會為這兩個陣營帶來重大變革,但在2030年之前實現商業性化應用似乎不太可能。
區域分析
預計到2025年,亞太地區將佔全球銷售額的48.90%,並將以12.62%的複合年成長率持續成長至2031年。中國大規模離岸風力發電和國內供應鏈的整合,使其成本比西方國家低20-30%。政策的明朗化促進了工廠投資,例如金風科技在巴西新建的工廠,進一步擴大了在拉丁美洲市場的價格優勢。
歐洲排名第二,但在浮體式海上風電和併網應用的技術應用方面處於主導。歐盟的目標和在地採購義務推動了新增發電項目的宣布,例如配備V236-15.0兆瓦風力渦輪機的1吉瓦Inch Cape項目。波蘭、英國和丹麥的原始設備製造商(OEM)的工廠擴建顯示市場需求持續強勁。
在北美,由於美國《通膨抑制法案》的實施,國產零件的採購正在加速推進,這為相關領域注入了強勁動力。 GE Vernova公司超過1吉瓦的改造合約反映了國產直驅引擎艙採購量的增加。同時,中東的主權財富基金和拉丁美洲的開發商正尋求與中國整車製造商合作,以迅速擴大其在當地的生產能力,為未來的銷售帶來地域多元化。
其他好處:
- Excel格式的市場預測(ME)表
- 3個月的分析師支持
目錄
第1章:引言
- 研究假設和市場定義
- 調查範圍
第2章:調查方法
第3章執行摘要
第4章 市場狀況
- 市場概覽
- 市場促進因素
- 降低4MW級DD風力發電機組的平準化電力成本(LCOE)
- 歐盟、英國和中國快速擴張離岸風力發電的目標
- 原始設備製造商越來越傾向於採用簡化的傳動系統(無變速箱)。
- 稀土元素磁鐵回收利用的突破性進展正在降低釹鐵硼磁體的原料成本。
- 高滲透性可再生能源併網逆變器功能的需求
- 市場限制因素
- 機艙重量的增加導致陸上作業的後勤成本上升。
- 世界稀土元素開採和提煉能力短缺
- 下一代DD原型機(功率超過15兆瓦)的認證過程出現延誤。
- 供應鏈分析
- 監理情勢
- 技術展望
- 波特五力模型
第5章 市場規模與成長預測
- 額定功率
- 3兆瓦或以下
- 3 MW~8 MW
- 8 MW~15 MW
- 超過15兆瓦
- 發電機技術
- 永磁同步(PMSG)
- 電勵磁同步發電機(EESG)
- 按安裝類型
- 陸上
- 固定離岸
- 浮體式海上
- 透過使用
- 大型風力發電廠
- 分散式(小於5兆瓦)
- 按地區
- 北美洲
- 美國
- 加拿大
- 墨西哥
- 歐洲
- 德國
- 英國
- 法國
- 西班牙
- 瑞典
- 芬蘭
- 土耳其
- 其他歐洲國家
- 亞太地區
- 中國
- 印度
- 日本
- 韓國
- 澳洲
- 越南
- 其他亞太國家
- 南美洲
- 巴西
- 阿根廷
- 智利
- 其他南美國家
- 中東和非洲
- 沙烏地阿拉伯
- 肯亞
- 南非
- 摩洛哥
- 其他中東和非洲國家
- 北美洲
第6章 競爭情勢
- 市場集中度
- 策略趨勢(併購、聯盟、購電協議)
- 市場佔有率分析(主要公司的市場排名和佔有率)
- 公司簡介
- Vestas Wind Systems A/S
- Goldwind Science & Technology Co. Ltd.
- Siemens Gamesa Renewable Energy SA
- GE Vernova(GE Renewable Energy)
- Envision Energy Ltd.
- Ming Yang Smart Energy Group Ltd.
- Enercon GmbH
- Hitachi Energy Ltd.
- Senvion India
- Lagerwey(Enercon DD platform)
- Toshiba Energy Systems & Solutions
- Hyundai Electric & Energy Systems
- Doosan Enerbility Co. Ltd.
- Shanghai Electric Wind Power Group
- Inox Wind Ltd.
- NSK Ltd.(main bearings)
- SKF AB(drivetrain bearings)
- Moog Inc.(pitch systems)
- Flender GmbH(Winergy converters)
第7章 市場機會與未來展望
According to Mordor Intelligence, the direct drive wind turbine market size in 2026 is estimated at USD 24.31 billion, growing from 2025 value of USD 21.74 billion with 2031 projections showing USD 42.44 billion, growing at 11.80% CAGR over 2026-2031.
This report is Segmented by Power Rating (Up To 3 MW, 3 MW To 8 MW, and More), Generator Technology (Permanent-Magnet Synchronous and Electrically-Excited Synchronous), Installation Type (Onshore, Fixed-Bottom Offshore, and Floating Offshore), Application (Utility-Scale Wind Farms and Distributed), Geography (North America, Europe, Asia-Pacific, South America, and Middle East and Africa).
Global Direct Drive Wind Turbine Market Trends and Insights
Declining Levelized Cost of Electricity (LCOE) for >=4 MW Direct Drive Turbines
Wind LCOE averaged USD 0.033/kWh in 2024, a 70% fall since 2010, with gearbox-free designs removing major maintenance cost centers. Offshore projects gain the most because remote servicing of gearboxes is expensive and logistically complex. Larger nacelles lower cost per MW even as generator mass rises, reinforcing a virtuous cycle where scale reduces unit pricing. Floating platforms amplify these savings because simplified drivetrains cut service visits under harsh marine conditions. As utilities routinely specify turbines exceeding 4 MW, the direct-drive wind turbine market gains structural cost leadership.
Rapid Offshore Wind Build-Out Targets in EU, UK & China
EU legislation aims for 60 GW of offshore capacity by 2030 and 300 GW by 2050, while China and the UK have similarly ambitious roadmaps. Combined pipelines exceed 400 GW, incentivising OEMs to push direct drive ratings beyond 15 MW to maximise energy capture. Floating offshore prospects swell from 270 MW in 2024 to a 244 GW pipeline, expanding deep-water potential that favours gearbox-free systems. Clear policy visibility unlocks capital for new factories and multi-GW frame agreements.
Heavy Nacelle Mass Increases Logistics Costs for Onshore Sites
A 10 MW direct-drive generator weighs around 300 t, which significantly increases tower steel and transport costs; tower components already account for 26% of turbine costs. Route constraints mean up to 11 over-dimensioned truckloads per 2 MW turbine and crane hire that can add USD 100,000 per unit. OEMs pursue modular generators and onsite assembly, though these raise field-quality risks.
Other drivers and restraints analyzed in the detailed report include:
- Rising OEM Preference for Simplified Drivetrains (Gearbox-Free)
- Rare-Earth Magnet Recycling Breakthroughs Lowering NdFeB Input Cost
- Limited Global Rare-Earth Mining & Refining Capacity
For complete list of drivers and restraints, kindly check the Table Of Contents.
Segment Analysis
The direct drive wind turbine market size for the 3 MW-8 MW band was the highest in 2025, accounting for 43.25% of the revenue, driven by widespread onshore adoption where logistics remain manageable. Above 15 MW machines, however, promise the steepest upside with a 21.96% CAGR, leveraged by fixed-bottom and floating offshore projects that reward higher capacity factors.
Falling capital expenditure per installed megawatt motivates developers to order ever-larger turbines, while certification delays act as a gating factor. Vestas' V236-15.0 MW model alone secured 7 GW of firm commitments, illustrating early confidence in ultra-large nacelles. Yet transportation and crane capability in near-shore yards remain barriers for rapid volume scale-up.
Permanent-magnet synchronous units owned 87.90% of the direct drive wind turbine market in 2025, rising on a 12.45% CAGR through 2031 as efficiency and low maintenance trump magnet cost worries. Rotor winding losses are absent, enabling higher energy yield and easier compliance with evolving grid codes. Electrically excited machines occupy a shrinking niche, primarily used where magnet supply security outweighs energy efficiency.
Recycling advances and alternative compounds gradually lessen PMSG cost headwinds, potentially extending dominance. EESG vendors emphasise design flexibility and magnet-free supply chains, but added maintenance complexity and lower output limit uptake. Superconducting research could disrupt both camps long term, yet commercial traction appears unlikely before 2030.
Geography Analysis
Asia-Pacific recorded 48.90% of global revenue in 2025 and is projected to expand at a 12.62% CAGR through 2031. China's large-scale offshore roll-out and domestic supply chain integration underpin regional cost advantages of 20-30% over Western peers. Policy clarity supports factory investments, including Goldwind's new Brazilian plant that extends pricing leverage into Latin America.
Europe ranks second yet leads technology deployment in floating offshore and grid-forming applications. EU targets, along with local content mandates, drive new capacity announcements, such as the 1 GW Inch Cape project equipped with V236-15.0 MW turbines. OEM factory expansions in Poland, the UK, and Denmark highlight sustained demand.
North America gains momentum through the U.S. Inflation Reduction Act, spurring domestic component sourcing. GE Vernova's repower contracts, topping 1 GW, mirror the rising procurement of direct-drive nacelles made in-country. Meanwhile, Middle East sovereign funds and Latin American developers are turning to Chinese OEM partnerships to fast-track local capacity, thereby adding geographic diversity to future sales.
- Vestas Wind Systems A/S
- Goldwind Science & Technology Co. Ltd.
- Siemens Gamesa Renewable Energy S.A.
- GE Vernova (GE Renewable Energy)
- Envision Energy Ltd.
- Ming Yang Smart Energy Group Ltd.
- Enercon GmbH
- Hitachi Energy Ltd.
- Senvion India
- Lagerwey (Enercon DD platform)
- Toshiba Energy Systems & Solutions
- Hyundai Electric & Energy Systems
- Doosan Enerbility Co. Ltd.
- Shanghai Electric Wind Power Group
- Inox Wind Ltd.
- NSK Ltd. (main bearings)
- SKF AB (drivetrain bearings)
- Moog Inc. (pitch systems)
- Flender GmbH (Winergy converters)
Additional Benefits:
- The market estimate (ME) sheet in Excel format
- 3 months of analyst support
TABLE OF CONTENTS
1 Introduction
- 1.1 Study Assumptions & Market Definition
- 1.2 Scope of the Study
2 Research Methodology
3 Executive Summary
4 Market Landscape
- 4.1 Market Overview
- 4.2 Market Drivers
- 4.2.1 Declining Levelized Cost of Electricity (LCOE) for ?4 MW DD turbines
- 4.2.2 Rapid offshore wind build-out targets in EU, UK & China
- 4.2.3 Rising OEM preference for simplified drivetrains (gearbox-free)
- 4.2.4 Rare-earth magnet recycling breakthroughs lowering NdFeB input cost
- 4.2.5 Grid-forming inverter capability demand for high-penetration renewables
- 4.3 Market Restraints
- 4.3.1 Heavy nacelle mass increases logistics costs for onshore sites
- 4.3.2 Limited global rare-earth mining & refining capacity
- 4.3.3 Slow certification cycles for ≥15 MW next-gen DD prototypes
- 4.4 Supply-Chain Analysis
- 4.5 Regulatory Landscape
- 4.6 Technological Outlook
- 4.7 Porter's Five Forces
- 4.7.1 Bargaining Power of Suppliers
- 4.7.2 Bargaining Power of Buyers
- 4.7.3 Threat of New Entrants
- 4.7.4 Threat of Substitutes
- 4.7.5 Intensity of Competitive Rivalry
5 Market Size & Growth Forecasts
- 5.1 By Power Rating
- 5.1.1 Up to 3 MW
- 5.1.2 3 MW to 8 MW
- 5.1.3 8 MW to 15 MW
- 5.1.4 Above 15 MW
- 5.2 By Generator Technology
- 5.2.1 Permanent-Magnet Synchronous (PMSG)
- 5.2.2 Electrically-Excited Synchronous (EESG)
- 5.3 By Installation Type
- 5.3.1 Onshore
- 5.3.2 Fixed-bottom Offshore
- 5.3.3 Floating Offshore
- 5.4 By Application
- 5.4.1 Utility-Scale Wind Farms
- 5.4.2 Distributed (Below 5 MW)
- 5.5 By Geography
- 5.5.1 North America
- 5.5.1.1 United States
- 5.5.1.2 Canada
- 5.5.1.3 Mexico
- 5.5.2 Europe
- 5.5.2.1 Germany
- 5.5.2.2 United Kingdom
- 5.5.2.3 France
- 5.5.2.4 Spain
- 5.5.2.5 Sweden
- 5.5.2.6 Finland
- 5.5.2.7 Turkey
- 5.5.2.8 Rest of Europe
- 5.5.3 Asia Pacific
- 5.5.3.1 China
- 5.5.3.2 India
- 5.5.3.3 Japan
- 5.5.3.4 South Korea
- 5.5.3.5 Australia
- 5.5.3.6 Vietnam
- 5.5.3.7 Rest of Asia Pacific
- 5.5.4 South America
- 5.5.4.1 Brazil
- 5.5.4.2 Argentina
- 5.5.4.3 Chile
- 5.5.4.4 Rest of South America
- 5.5.5 Middle East and Africa
- 5.5.5.1 Saudi Arabia
- 5.5.5.2 Kenya
- 5.5.5.3 South Africa
- 5.5.5.4 Morocco
- 5.5.5.5 Rest of Middle East and Africa
- 5.5.1 North America
6 Competitive Landscape
- 6.1 Market Concentration
- 6.2 Strategic Moves (M&A, Partnerships, PPAs)
- 6.3 Market Share Analysis (Market Rank/Share for key companies)
- 6.4 Company Profiles (includes Global level Overview, Market level overview, Core Segments, Financials as available, Strategic Information, Products & Services, and Recent Developments)
- 6.4.1 Vestas Wind Systems A/S
- 6.4.2 Goldwind Science & Technology Co. Ltd.
- 6.4.3 Siemens Gamesa Renewable Energy S.A.
- 6.4.4 GE Vernova (GE Renewable Energy)
- 6.4.5 Envision Energy Ltd.
- 6.4.6 Ming Yang Smart Energy Group Ltd.
- 6.4.7 Enercon GmbH
- 6.4.8 Hitachi Energy Ltd.
- 6.4.9 Senvion India
- 6.4.10 Lagerwey (Enercon DD platform)
- 6.4.11 Toshiba Energy Systems & Solutions
- 6.4.12 Hyundai Electric & Energy Systems
- 6.4.13 Doosan Enerbility Co. Ltd.
- 6.4.14 Shanghai Electric Wind Power Group
- 6.4.15 Inox Wind Ltd.
- 6.4.16 NSK Ltd. (main bearings)
- 6.4.17 SKF AB (drivetrain bearings)
- 6.4.18 Moog Inc. (pitch systems)
- 6.4.19 Flender GmbH (Winergy converters)
7 Market Opportunities & Future Outlook
- 7.1 White-space & Unmet-Need Assessment


