


 |
市場調查報告書
商品編碼
2044293
再生塑膠:市場佔有率分析、行業趨勢和統計數據、成長預測(2026-2031)Recycled Plastics - Market Share Analysis, Industry Trends & Statistics, Growth Forecasts (2026 - 2031) |
||||||
※ 本網頁內容可能與最新版本有所差異。詳細情況請與我們聯繫。
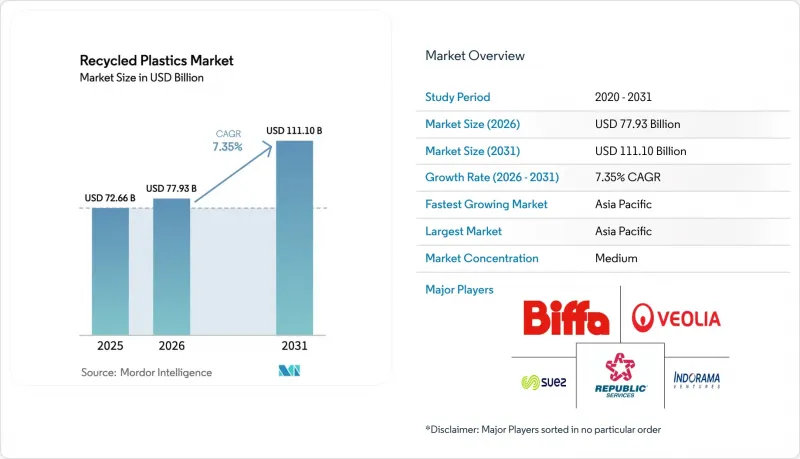
預計到 2025 年,再生塑膠 (rPET) 市場規模將達到 726.6 億美元,到 2026 年將達到 779.3 億美元,到 2031 年將達到 1,111 億美元,2026 年至 2031 年的複合年成長率為 7.35%。
目前,監管壓力是影響供應鏈的主要驅動力,其中以歐盟的《包裝和包裝廢棄物法規》為首,該法規將從2026年起為每類塑膠包裝設定最低再生材料含量標準。在亞太地區,中國各地廢棄物分類項目的推進以及東南亞主要市場生產者延伸責任制(EPR)框架的擴展,推動了需求和產能的成長。以Carbios主導的工廠已實現PET酶分解技術的商業化,並採用長期承購契約,這不僅穩定了回收商的收入,也為其提供了資金籌措,體現了技術的成熟度。在北美,基礎設施建設在美國環保署(EPA)的津貼下穩步推進,但由於回收率和污染程度的差異,食品級產品的市場佔有率目前仍然有限。隨著原始設備製造商(OEM)的專案與循環經濟目標和產品報廢要求接軌,汽車和其他工程應用領域正在快速成長,但在含量法規和品牌目標的限制下,包裝仍然是主要應用領域。
全球再生塑膠市場趨勢及洞察
歐盟的《塑膠包裝和廢棄物法規》(PPWR) 規定,塑膠包裝中必須含有 30% 的再生材料,這將鼓勵閉合迴路投資。
歐盟的《包裝和包裝廢棄物法規》(PPWR)將於2025年2月生效,並於2026年8月開始實施。該法規規定了塑膠包裝的最低再生材料含量標準:食品接觸用PET為30%,其他食品接觸用塑膠為10%,一次性飲料瓶為30%,其他類別為35%,併計劃在2040年進一步提高。這項明確規定為先進的閉合迴路生產能力項目提供了新的資金籌措。其中包括威立雅計劃在什魯斯伯里建設的托盤式PET生產設施,該設施預計年處理能力為8萬噸,並獲得了7,000萬英鎊(約8,890萬美元)的投資。此外,Loop Industries在BASF位於施瓦茨海德的工廠簽署了歐洲首個「無限循環」授權合約。初始許可費為1000萬歐元(1080萬美元),目標是到2030年每年處理7萬噸。在法國等市場,生產者責任費正根據可回收等級進行調整,這進一步強化了單一材料優於多層結構的價格訊號。進口再生材料面臨歐盟食品接觸法規規定的嚴格等效性和合規性要求,促使企業投資於國內可審計的再生材料來源。
原生高密度聚乙烯 (HDPE) 價格已超過每噸 1600 美元,改善了再生聚乙烯 (rPE) 的經濟效益。
由於原生高密度聚苯乙烯(HDPE) 價格居高不下,加工商正在重新考慮在包裝和工業應用中使用再生 HDPE 和低密度聚乙烯 (LDPE),這些應用能夠容忍或受益於消費後再生 (塑膠回收再利用) 材料的添加。法規和含量目標也支撐著飲料和家居用品領域對天然再生 HDPE 的穩定需求。據塑膠回收商協會稱,如果原料品質和終端市場需求保持不變,美國和加拿大的回收商預計每年可額外處理價值 20 億英鎊的廢料。這種過剩產能將使再生塑膠市場能夠在 PCR 經濟效益改善時,透過對原生材料價格的套利,更快地做出反應。原生材料價格持續高企以及政策壓力不斷增加,正推動耐用和半耐用消費品應用中再生塑膠含量的進一步提高。
歐洲rPET薄片的過剩供應給回收商的利潤率帶來了壓力。
歐洲rPET市場供應過剩導致碎片價格下跌,並擠壓回收商的利潤空間,尤其是在品牌需求符合一次性塑膠指令對飲料瓶的最低標準時。庫存積壓和季節性因素會加劇這種壓力,導致品質改善投資延遲和運轉率下降。回收成本和能源價格也影響與原生PET的成本競爭,凸顯了引入並持續執行生產者延伸責任制(EPR)費用的必要性。歐盟食品接觸法規的澄清維持了高品質的標準,但需要額外的文件和流程檢驗。改善押金返還機制的運作並規範規格將有助於穩定再生塑膠市場對更高再生含量產品的需求。
細分市場分析
預計到2025年,聚乙烯將佔29.18%的市場佔有率,這主要得益於高密度聚苯乙烯在硬質包裝領域的應用,以及低密度聚乙烯(LDPE)和線性低密度聚乙烯(LLDPE)在薄膜領域的應用。成熟的回收和再利用基礎設施為此提供了支撐。美國和加拿大的機械回收商也表示,只要包裝品質和下游需求保持穩定,仍有處理更多聚烯的空間。
「其他塑膠」細分市場預計將以9.15%的複合年成長率實現最高成長,主要成長動力來自汽車和電子產業。隨著製造商努力實現嚴格的永續發展目標,對這些再生工程聚合物的需求正在激增。高性能再生ABS、PC和PA具有卓越的機械性能,使其成為複雜耐用製造應用中原生樹脂的理想替代品,同時也是推動全球循環經濟的重要力量。
到2025年,機械回收將佔市場佔有率的70.8%。這反映了清洗、擠出和造粒生產線在包裝、建築和汽車應用領域的日益普及。預計到2031年,透過化學方法回收塑膠的市場規模將以8.71%的複合年成長率成長。這是因為品牌商尋求從混合或受污染的原料流中獲取食品接觸級和高規格聚合物。塑膠塑膠回收再利用協會報告稱,PET、HDPE、PP和薄膜領域存在巨大的未開發產能潛力,前提是原料供應改善且需求穩定。歐盟食品接觸法規的變化更重視去污製程的認證,提高了對品質和可追溯性的要求。這推動了對成熟技術的投資。
先進的加工方法,例如解聚,透過將難以回收的原料轉化為單體和精製聚合物,補充了機械加工,這些單體和精製聚合物可立即用於高附加價值應用。不同行業的應用模式各不相同,包裝品牌優先考慮食品級穩定性,而汽車和電子行業則專注於功能性能標準。標準、認證和生產歷史記錄會影響買家的信心和成本,從而促進合約量的穩定成長。隨著越來越多的商業工廠展現出可靠的生產記錄,化學回收在再生塑膠市場中的作用預計將會擴大,但不會取代龐大的機械回收基礎。
區域分析
預計亞太地區將在2025年以48.7%的市佔率引領全球市場,並在2031年之前維持8.32%的複合年成長率。這主要得益於生產者延伸責任制(EPR)計畫在快速成長的消費市場中的推廣,以及大規模都會地區廢棄物分類的標準化。中國的「零廢棄城市2.0」計畫將在2026年至2030年間擴展至約200個城市,目標是到2027年達到60%的參與率,到2035年實現全面覆蓋,這將有助於提高原料的供應和品質。上海的相關法規提高了居民垃圾分類的合規率和全市的整體回收率,這兩項措施都有助於確保高品質的rPET和聚烯原料的供應。此外,該地區還湧現一些化學回收項目,包括一些旨在處理受污染薄膜和混合塑膠的新設施的試運行。政策、基礎設施和技術的綜合發展預示著亞太地區再生塑膠市場將持續成長。
歐洲正緊隨其後,預計到2025年將佔據顯著的市場佔有率。這是因為《塑膠包裝和容器法規》(PPWR)中關於最低再生材料含量和可回收性的要求,正在推動各成員國進行閉合迴路投資。 《一次性塑膠指令》中關於飲料瓶中rPET含量的目標(到2025年達到25%,到2030年達到30%)持續支撐著對高品質瓶級PCR(消費後再生塑膠)的需求。新項目包括英國的托盤到托盤PET生產線,以及在政府津貼和創新基金支持下對先進解聚技術的投資。價格調整和品牌目標的結合,正在推廣單一材料設計和清晰的標籤,從而提高可回收性。隨著食品接觸應用進口限制的日益嚴格,在可追溯性至關重要的領域,本地供應正獲得優勢。
在北美,聯邦政府正透過專案撥款和擴大各州的生產者責任延伸(EPR)立法來解決基礎設施短缺問題,但回收商反映,目前仍有大量閒置產能,若原料品質提高、需求穩定,這些產能即可運作。加工PET、HDPE、PP和薄膜的機械回收商擁有提升產能的能力,因為品牌規格已標準化,且包裝雜質含量降低。主要樹脂生產商和加工商正在簽訂長期契約,採購高回收率和精煉度的PCR原料,以供應物料平衡的產品線,並滿足食品接觸和高規格應用的需求。隨著這些合約的擴大,將降低迴收商的價格波動風險,並鼓勵對再生塑膠市場的生產線進行新的投資。
其他好處
- Excel格式的市場預測(ME)表
- 3個月的分析師支持
目錄
第1章:引言
- 研究假設和市場定義
- 調查範圍
第2章:調查方法
第3章執行摘要
第4章 市場狀況
- 市場概覽
- 市場促進因素
- 歐盟包裝廢棄物法規(PPWR):強制規定含有 30% 的再生材料。
- 中國「零廢棄城市2.0」的發展正在加速家庭塑膠垃圾的回收。
- 美國環保署 (EPA) 提供的 3.75 億美元津貼將用於回收基礎設施建設,從而創造新的處理能力。
- 酵素基PET分解技術的商業化過程開始。
- 「再生塑膠PPA」是一家為回收商設定價格上限的公司。
- 原生聚合物價格高昂(HDPE 每噸低於 1600 美元),而再生聚乙烯 (rPE) 的獲利能力則有所提高。
- 市場限制因素
- 歐洲rPET薄片的過剩供應給回收商的利潤率帶來了壓力。
- 亞洲與歐盟之間原物料運輸航線的海運保險費和運費不斷上漲。
- 歐盟在化學品回收的物料平衡方面的法律模糊性正在抑制投資。
- 機器人輔助物料回收設施中技術純熟勞工的短缺正在減緩回收率的提高。
- 價值/供應鏈分析
- 監理展望
- 技術展望
- 產業吸引力—五力分析
- 新進入者的威脅
- 買方的議價能力
- 供應商的議價能力
- 替代品的威脅
- 競爭公司之間的競爭
- 地緣政治事件和通膨壓力的影響
第5章 市場規模及成長預測(價值,10億美元)
- 按聚合物類型
- 聚乙烯
- 高密度聚苯乙烯(HDPE)
- 低密度聚乙烯(LDPE/LLDPE)
- 聚對苯二甲酸乙二醇酯(PET)
- 聚丙烯(PP)
- 聚氯乙烯(PVC)
- 聚苯乙烯(PS)
- 其他塑膠(ABS、PC、PA 等)
- 聚乙烯
- 透過回放過程
- 機械回收
- 化學/先進回收(熱解、解聚、溶解)
- 能源回收(將塑膠轉化為燃料)
- 其他(生物學 - 酵素和微生物)
- 按產品形式
- 薄片
- 顆粒/粒狀物
- 粉末
- 其他(切屑、再生料、片材等)
- 最終用途
- 包裝
- 食品級
- 非食品級
- 建築/施工
- 車
- 電氣和電子
- 紡織服裝
- 消費品
- 農業和園藝
- 其他用途(一般製造業、醫療設備等)
- 包裝
- 按地區
- 北美洲
- 美國
- 加拿大
- 北美其他地區
- 南美洲
- 巴西
- 阿根廷
- 南美洲其他地區
- 歐洲
- 德國
- 英國
- 法國
- 義大利
- 西班牙
- 比荷盧經濟聯盟(比利時、荷蘭、盧森堡)
- 北歐國家(丹麥、芬蘭、冰島、挪威、瑞典)
- 其他歐洲國家
- 中東和非洲
- 沙烏地阿拉伯
- 阿拉伯聯合大公國
- 土耳其
- 南非
- 奈及利亞
- 埃及
- 其他中東和非洲國家
- 亞太地區
- 中國
- 印度
- 日本
- 韓國
- 東協(印尼、泰國、菲律賓、馬來西亞、越南)
- 亞太其他地區
- 北美洲
第6章 競爭情勢
- 市場集中度
- 策略性舉措(併購、產能、合資企業)
- 市佔率分析
- 公司簡介
- Veolia
- Indorama Ventures
- Biffa
- Republic Services
- Suez
- KW Plastics
- Plastipak Holdings
- Loop Industries
- MBA Polymers
- Brightmark
- Agilyx
- Waste Management Inc.
- Clean Harbors
- CarbonLite
- Eastman Chemical
- BASF SE
- SABIC
- LyondellBasell
- Covestro
- REMondis
- Custom Polymers
- Green Line Polymers
- Berry Global
- PureCycle Technologies
第7章 市場機會與未來展望
The Recycled Plastics Market size is projected to be USD 72.66 billion in 2025, USD 77.93 billion in 2026, and reach USD 111.10 billion by 2031, growing at a CAGR of 7.35% from 2026 to 2031.
Regulatory pressure is now the primary force shaping supply chains, led by the European Union's Packaging and Packaging Waste Regulation that establishes minimum recycled content thresholds across plastic packaging categories beginning in 2026. Asia-Pacific leads demand and capacity build-out as Extended Producer Responsibility frameworks spread across major Southeast Asian markets alongside China's nationwide expansion of waste-sorting programs. Technology maturation is visible in enzymatic PET depolymerization reaching commercial timelines at Carbios-led facilities and in the use of long-term offtake contracts that stabilize recycler revenue and unlock financing. North America continues to add infrastructure with support from U.S. Environmental Protection Agency grants, though collection and contamination variability limit the share of food-grade output today.Automotive and other engineering uses are fast-growing as OEM programs align with circularity goals and end-of-life requirements, while packaging remains the anchor application under content mandates and brand targets.
Global Recycled Plastics Market Trends and Insights
EU PPWR 30% Recycled-Content Mandate Drives Closed Loop Investment
The European Union's Packaging and Packaging Waste Regulation entered into force on February, 2025, and applies from August, 2026, setting minimum recycled content thresholds for plastic packaging, including 30% for contact-sensitive PET, 10% for other contact-sensitive plastics, 30% for single-use beverage bottles, and 35% for the remaining categories, with further increases through 2040. This clarity has enabled new project financing for advanced closed-loop capacity, including Veolia's commitment to a tray-to-tray PET facility in Shrewsbury with planned throughput of 80,000 tonnes per year, supported by a GBP 70 million investment (USD 88.9 million). Loop Industries also advanced its first European Infinite Loop license at BASF's Schwarzheide site, with an initial license payment of EUR 10 million (USD 10.8 million) and a target of 70,000 metric tons per year by 2030. Producer-responsibility fee modulation based on recyclability grades in markets like France adds further price signals that favor mono-material over multi-layer designs. Imports of recyclate face rigorous equivalence and compliance requirements under EU food-contact regulations, reinforcing investment in domestic, auditable supply.
Sustained Virgin HDPE Prices Above USD 1,600/t Improve rPE Economics
When virgin high-density polyethylene prices remain elevated, converters reconsider recycled HDPE and LDPE for packaging and industrial uses that can tolerate or benefit from PCR content. Mandates and content targets also underpin stable demand for natural rHDPE in beverage and household applications. The Association of Plastic Recyclers reported that reclaimers across the United States and Canada could process nearly 2 billion additional pounds annually if feedstock quality and end-market demand are sustained. This available capacity allows the recycled plastics market to respond faster when virgin price arbitrage improves PCR economics. The combination of sustained virgin price premiums and incremental policy pressure supports higher recycled-content utilization in durable and semi-durable applications.
rPET Flake Oversupply in Europe Compresses Recycler Margins
Periods of oversupply in European rPET markets reduce pricing for flakes and compress margins for recyclers, especially when brand demand tracks the minimum thresholds under the Single-Use Plastics Directive for beverage bottles. Inventory build-ups and seasonality can intensify pressure, which in turn defers investments in quality upgrades and reduces run rates. Collection costs and energy prices also influence cost parity against virgin PET, reinforcing the need for EPR fee signals and consistent enforcement. Clarifications under EU food-contact rules sustain high-quality standards, yet they require additional documentation and process validation. Improved deposit-return performance and harmonized specifications can help stabilize demand at higher recycled-content levels within the recycled plastics market.
Other drivers and restraints analyzed in the detailed report include:
- China Zero-Waste Cities 2.0 Expands Household Plastics Collection Infrastructure
- U.S. EPA USD 375 Million Recycling-Infrastructure Grants Unlock Regional Capacity
- Escalating Marine Insurance & Asia-EU Freight Costs Pressure Feedstock Routes
For complete list of drivers and restraints, kindly check the Table Of Contents.
Segment Analysis
Polyethylene accounted for 29.18% in 2025, led by high-density polyethylene in rigid packaging and low-density or linear low-density polyethylene in film applications, supported by a mature collection and recycling infrastructure. Mechanical reclaimers in the United States and Canada also indicated material headroom to process more polyolefins if bale quality and downstream demand hold steady.
The "Other Plastics" segment is expected to grow at the fastest CAGR at 9.15%, driven primarily by the automotive and electronics sectors. Demand for these recycled engineering polymers is surging as manufacturers strive to meet stringent sustainability targets. High-performance recycled ABS, PC, and PA offer excellent mechanical properties, making them highly viable, eco-friendly substitutes for virgin resins in complex, durable manufacturing applications while advancing global circular economy initiatives.
Mechanical recycling accounted for 70.8% of activity in 2025, reflecting the installed base of washing, extrusion, and pelletizing lines that feed packaging, construction, and automotive applications. The recycled plastics market size for chemical routes is projected to expand at 8.71% CAGR through 2031 as brands seek food-contact and high-spec polymers from mixed or contaminated streams. The Association of Plastic Recyclers has documented significant unused capacity potential across PET, HDPE, PP, and film, contingent on better feedstock supply and consistent demand signals. Food-contact regulation shifts in the European Union place more emphasis on certifying decontamination processes, which raises both quality and traceability requirements that favor investment in proven technologies.
Advanced routes such as depolymerization complement mechanical methods by converting hard-to-recycle streams into monomers or purified polymers ready for high-value applications. Adoption patterns vary by sector, with packaging brands prioritizing food-grade consistency while automotive and electronics focus on functional performance benchmarks. Standards, certifications, and chain-of-custody documentation influence buyer confidence alongside cost, which supports steady growth in contracted volumes. As more commercial plants demonstrate reliable output, chemical recycling's role is expected to grow within the recycled plastics market without displacing mechanical recycling's large base.
The Recycled Plastics Market is Segmented by Polymer Type (Polyethylene, Polyethylene Terephthalate, and Others), by Recycling Process (Mechanical, Chemical/Advanced, and Others), by Product Form (Flakes, Powder, and Others), by End-Use Application (Packaging, Building & Construction, and Others), and by Geography (North America, Europe, Asia-Pacific and More). The Market Forecasts are Provided in Terms of Value (USD).
Geography Analysis
Asia-Pacific led with 48.7% share in 2025 and is projected to grow at 8.32% CAGR through 2031 as EPR programs expand across fast-growing consumer markets and large urban clusters standardize waste sorting. China's Zero-Waste Cities 2.0 is scaling to about 200 cities from 2026 to 2030, targeting 60% participation by 2027 and aiming for comprehensive coverage by 2035, which expands feedstock availability and quality. Shanghai's regulation raised household sorting compliance and improved the city's overall recycling rate, both of which support higher quality rPET and polyolefin streams. Chemical recycling projects are also emerging in the region, including trial operations of new units designed to handle contaminated films and mixed plastics. This mix of policy, infrastructure, and technology signals durable growth for the recycled plastics market in Asia-Pacific.
Europe followed with a significant market share in 2025 as PPWR requirements for minimum recycled content and recyclability stimulate closed-loop investments across Member States. The Single-Use Plastics Directive's 25% rPET target for beverage bottles in 2025 and 30% by 2030 continues to anchor demand for high-quality bottle-grade PCR. New projects include tray-to-tray PET lines in the United Kingdom alongside advanced depolymerization investments supported by state aid and innovation funding. The combination of fee modulation and brand targets encourages mono-material designs and clear labeling that improve recyclability outcomes. As import compliance tightens for food-contact applications, local supply gains an advantage where traceability is critical.
North America is addressing infrastructure gaps through federal program funding and growing state EPR laws while reclaimers report sizable unused capacity that could be activated with better feedstock quality and steady demand. Mechanical recyclers across PET, HDPE, PP, and film have the processing headroom to add output as brand specifications align and bale contamination falls. Large resin producers and converters are signing long-term agreements for advanced recycled and purified PCR feedstocks that supply mass-balance portfolios and enable food-contact or high-spec uses. As these agreements scale, they help reduce the volatility faced by reclaimers and catalyze new investments in lines that serve the recycled plastics market.
- Veolia
- Indorama Ventures
- Biffa
- Republic Services
- Suez
- KW Plastics
- Plastipak Holdings
- Loop Industries
- MBA Polymers
- Brightmark
- Agilyx
- Waste Management Inc.
- Clean Harbors
- CarbonLite
- Eastman Chemical
- BASF SE
- SABIC
- LyondellBasell
- Covestro
- REMondis
- Custom Polymers
- Green Line Polymers
- Berry Global
- PureCycle Technologies
Additional Benefits:
- The market estimate (ME) sheet in Excel format
- 3 months of analyst support
TABLE OF CONTENTS
1 Introduction
- 1.1 Study Assumptions & Market Definition
- 1.2 Scope of the Study
2 Research Methodology
3 Executive Summary
4 Market Landscape
- 4.1 Market Overview
- 4.2 Market Drivers
- 4.2.1 EU Packaging & Packaging-Waste Regulation (PPWR) 30 % recycled-content mandate
- 4.2.2 China's "Zero-Waste Cities 2.0" rollout boosting household plastics collection
- 4.2.3 U.S. EPA USD 375 million Recycling-Infrastructure Grants unlocking new capacity
- 4.2.4 Commercial start-up of enzymatic PET depolymerisation technology
- 4.2.5 Corporate ?recycled-plastic PPAs? providing price floors for recyclers
- 4.2.6 Sustained high virgin-polymer prices (less than USD 1 600/ton HDPE), improving recycled polyethylene (rPE) economics
- 4.3 Market Restraints
- 4.3.1 rPET flake oversupply in Europe compressing recycler margins
- 4.3.2 Escalating marine-insurance & freight costs on Asia-EU feedstock routes
- 4.3.3 EU legal ambiguity on chemical-recycling mass-balance claims cooling investment
- 4.3.4 Skilled-labour shortage for robotics-enabled MRFs delaying yield gains
- 4.4 Value / Supply-Chain Analysis
- 4.5 Regulatory Outlook
- 4.6 Technological Outlook
- 4.7 Industry Attractiveness - Porter?s Five Forces
- 4.7.1 Threat of New Entrants
- 4.7.2 Bargaining Power of Buyers
- 4.7.3 Bargaining Power of Suppliers
- 4.7.4 Threat of Substitutes
- 4.7.5 Intensity of Competitive Rivalry
- 4.8 Impact of Geopolitical Events & Inflationary Pressures
5 Market Size & Growth Forecasts (Value, In USD Billion)
- 5.1 By Polymer Type
- 5.1.1 Polyethylene
- 5.1.1.1 High-Density Polyethylene (HDPE)
- 5.1.1.2 Low/Linear-Low Density Polyethylene (LD/LLDPE)
- 5.1.2 Polyethylene Terephthalate (PET)
- 5.1.3 Polypropylene (PP)
- 5.1.4 Polyvinyl Chloride (PVC)
- 5.1.5 Polystyrene (PS)
- 5.1.6 Other Plastics (ABS, PC, PA, etc.)
- 5.1.1 Polyethylene
- 5.2 By Recycling Process
- 5.2.1 Mechanical Recycling
- 5.2.2 Chemical / Advanced Recycling (Pyrolysis, Depolymerisation, Dissolution)
- 5.2.3 Energy Recovery (Plastic-to-Fuel)
- 5.2.4 Others (Biological - enzymatic/ microbial)
- 5.3 By Product Form
- 5.3.1 Flakes
- 5.3.2 Pellets/ Granules
- 5.3.3 Powder
- 5.3.4 Others (Chips, Regrind, Sheets, etc.)
- 5.4 By End-Use Application
- 5.4.1 Packaging
- 5.4.1.1 Food-Grade
- 5.4.1.2 Non-Food Grade
- 5.4.2 Building & Construction
- 5.4.3 Automotive
- 5.4.4 Electrical & Electronics
- 5.4.5 Textiles & Apparel
- 5.4.6 Consumer Products
- 5.4.7 Agriculture & Horticulture
- 5.4.8 Other Applications (General Manufacturing, Medical Devices, etc.)
- 5.4.1 Packaging
- 5.5 By Geography
- 5.5.1 North America
- 5.5.1.1 United States
- 5.5.1.2 Canada
- 5.5.1.3 Rest of North America
- 5.5.2 South America
- 5.5.2.1 Brazil
- 5.5.2.2 Argentina
- 5.5.2.3 Rest of South America
- 5.5.3 Europe
- 5.5.3.1 Germany
- 5.5.3.2 United Kingdom
- 5.5.3.3 France
- 5.5.3.4 Italy
- 5.5.3.5 Spain
- 5.5.3.6 BENELUX (Belgium, Netherlands, and Luxembourg)
- 5.5.3.7 NORDICS (Denmark, Finland, Iceland, Norway, and Sweden)
- 5.5.3.8 Rest of Europe
- 5.5.4 Middle East and Africa
- 5.5.4.1 Saudi Arabia
- 5.5.4.2 United Arab Emirates
- 5.5.4.3 Turkey
- 5.5.4.4 South Africa
- 5.5.4.5 Nigeria
- 5.5.4.6 Egypt
- 5.5.4.7 Rest of Middle East and Africa
- 5.5.5 Asia-Pacific
- 5.5.5.1 China
- 5.5.5.2 India
- 5.5.5.3 Japan
- 5.5.5.4 South Korea
- 5.5.5.5 ASEAN (Indonesia, Thailand, Philippines, Malaysia, Vietnam)
- 5.5.5.6 Rest of Asia-Pacific
- 5.5.1 North America
6 Competitive Landscape
- 6.1 Market Concentration
- 6.2 Strategic Moves (M&A, Capacity, JVs)
- 6.3 Market Share Analysis
- 6.4 Company Profiles {(includes Global level Overview, Market level overview, Core Segments, Financials as available, Strategic Information, Products & Services, and Recent Developments)}
- 6.4.1 Veolia
- 6.4.2 Indorama Ventures
- 6.4.3 Biffa
- 6.4.4 Republic Services
- 6.4.5 Suez
- 6.4.6 KW Plastics
- 6.4.7 Plastipak Holdings
- 6.4.8 Loop Industries
- 6.4.9 MBA Polymers
- 6.4.10 Brightmark
- 6.4.11 Agilyx
- 6.4.12 Waste Management Inc.
- 6.4.13 Clean Harbors
- 6.4.14 CarbonLite
- 6.4.15 Eastman Chemical
- 6.4.16 BASF SE
- 6.4.17 SABIC
- 6.4.18 LyondellBasell
- 6.4.19 Covestro
- 6.4.20 REMondis
- 6.4.21 Custom Polymers
- 6.4.22 Green Line Polymers
- 6.4.23 Berry Global
- 6.4.24 PureCycle Technologies
7 Market Opportunities & Future Outlook
- 7.1 White-Space & Unmet-Need Assessment
 海洋塑膠回收和升級再造市場預測至2034年-按價值鏈階段、塑膠類型、回收技術、來源、最終用戶和地區分類的全球分析
 再生塑膠市場規模、佔有率和成長分析:按塑膠類型、原料、回收方法、產品形式、應用和地區分類-2026-2033年產業預測
 再生塑膠市場規模、佔有率、趨勢和預測:按塑膠類型、原料、應用和地區分類,2026-2034年
 再生高密度聚乙烯顆粒市場規模、佔有率和成長分析:按原料、顏色規格、加工技術、應用、終端用戶產業、分銷管道和地區分類-2026-2033年產業預測
 再生塑膠市場:依產品類型、原料、最終用途產業和地區分類
 再生塑膠市場:2026-2032年全球市場預測(依產品、回收製程、形態、原料來源及應用分類)
 再生塑膠市場規模、佔有率、成長及全球產業分析:按類型、應用和地區分類的洞察,2026-2034年海洋塑膠升級再造市場預測至2034年-全球原料類型、升級再造製程、產量、價值鏈參與者、最終用戶與區域分析全球再生塑膠市場規模、佔有率、趨勢和成長分析報告(2026-2034)
 2026年全球再生塑膠市場報告