

 |
市場調查報告書
商品編碼
2044248
日本POS終端市場:市佔率分析、產業趨勢與統計及成長預測(2026-2031年)Japan POS Terminals - Market Share Analysis, Industry Trends & Statistics, Growth Forecasts (2026 - 2031) |
||||||
※ 本網頁內容可能與最新版本有所差異。詳細情況請與我們聯繫。
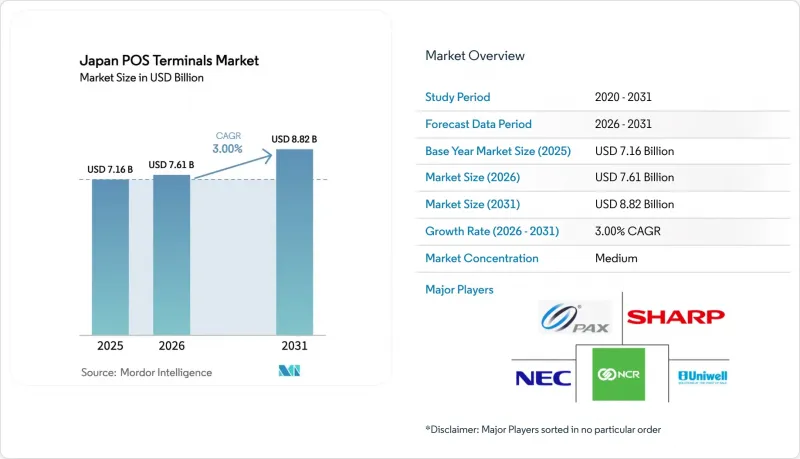
2025年日本POS終端市值為71.6億美元,預計2031年將從2026年的76.1億美元成長到88.2億美元,預測期(2026-2031年)複合年成長率為3%。
預計在政府加大力度支持實現40%現金支付比例、旅遊產業和快餐零售行業對非接觸式支付的偏好日益成長以及供應商在人工智慧驅動的邊緣分析領域不斷努力等因素的推動下,日本POS終端市場將保持強勁成長偏好。 My Number卡的快速普及擴大了使用者群體,並提高了功能需求,促使商家更傾向於選擇整合式身分驗證和支付處理的終端。從2024年下半年開始,半導體供應的穩定將縮短交貨時間,使零售商能夠加快因長期半導體短缺而停滯的升級項目。 5G網路覆蓋範圍的擴大將進一步提升行動POS機的效能,即使在先前服務不足的地區也能實現雲端同步和即時分析。這些相互關聯的因素鞏固了日本POS終端市場的上升趨勢,同時也為硬體和軟體專家提供了差異化的市場進入機會。
日本POS終端市場趨勢與洞察
中小企業行動POS機的普及率迅速提高。
使用行動POS系統的門市數量從2015年的9.9萬家成長到2020年的35萬家,隨著中小企業尋求經濟高效的數位化工具,這一數字持續成長。三井住友信用卡公司的「next stera」藍圖的目標是到2030年部署100萬台設備,凸顯了潛在需求的規模。 SoftPOS是日本首個獲得MPoC認證的系統,由Softspace和GMO Financial Gate合作推出,可將一般智慧型手機轉變為安全的支付終端。由於硬體成本降低、部署時間縮短以及固定終端難以實現的高價值分析功能,企業對行動POS表現出越來越濃厚的興趣。監管領域也出現了類似的趨勢,PCI DSS v4.0建議採用基於雲端的編配,而非本地部署軟體。因此,經濟和合規因素的結合,使得行動POS成為日本不斷成長的POS終端市場的核心。
與「我的號碼」(社會安全號碼)掛鉤的無現金支付獎勵計畫迅速增加
日本內閣府的目標是到2025年實現40%的無現金支付比例,並為能夠驗證「我的號碼」卡的終端提供補貼。醫院也獲得了專門的支持,用於升級老舊的終端,以便將保險數據、身份驗證和支付流程整合到一個螢幕上。便利商店連鎖店也紛紛效仿,維修了數千台收銀機,以支援結帳時的刷卡身份驗證。地方政府正在進行對老年人友善的QR碼宣傳活動,降低使用難度,並推動當地藥局和超市的終端升級。如今,終端的功能正在擴展,包括自動報稅和積分累積,這要求每個設備的處理器、記憶體和加密模組都具備新的功能。因此,日本POS終端市場呈現持續成長的態勢,這主要得益於公共資金支持的現代化改造,而非傳統的消費支出週期。
老年人仍然對現金有很強的依賴。
2023年,日本全國無現金支付率達39.3%,但各年齡層之間的差距依然顯著,老年人普遍不願放棄現金。調查顯示,18至29歲族群的QR碼使用率達35%,遠低於60歲以上。因此,當地零售商不願投資先進終端,擔心未來幾年使用率可能仍然很低。地方政府正在試行QR碼宣傳活動以吸引老年消費者,但效果因地而異。商家透過增加觸控按鍵和大字體顯示器來應對這項挑戰,但這會增加組件成本並壓縮毛利率。因此,儘管整體市場成長得以維持,但日本POS終端市場必須應對根深蒂固的現金文化,這種文化在大都會圈以外的成長勢頭正在減弱。
細分市場分析
2025年,非接觸式支付終端將佔據日本POS終端市場62.38%的佔有率,目前正以4.70%的複合年成長率快速成長,滲透到自動販賣機、公共運輸和快餐店等領域。例如,每年在2萬台ME-20自動販賣機上安裝非接觸式讀卡器,顯示無需大規模更換設備,即可透過韌體升級實現廣泛部署的現代化。一旦初始硬體投資攤銷完畢,商家將體驗到更高的處理能力,從而提高單店交易量。消費者傾向於使用「一觸即付」的方式支付40美元以下的商品,這加速了非接觸式支付的普及。隨著EMV代幣化技術的成熟,非接觸式支付將擴展到中價位商品,削弱現金支付的主導地位。
未來,終端可能會將NFC和相機輸入整合在同一塊基板,從而可能促成QR碼和非接觸式支付的融合。供應商正在整合雙讀卡機和軟體路由功能,以便根據所使用的卡片組織和錢包選擇最佳通訊通道。這種多模態設計使連鎖店能夠在控制資本支出的同時,適應不斷變化的消費者偏好。目前,升級專案的目標是七年的生命週期,因此,韌體的未來相容性是採購決策的關鍵因素。預計到2031年,這些設計選擇將重新平衡非接觸式支付和2D碼支付,從而支撐日本POS終端市場的穩定成長。
其他好處
- Excel格式的市場預測(ME)表
- 3個月的分析師支持
目錄
第1章:引言
- 研究假設和市場定義
- 調查範圍
第2章:調查方法
第3章執行摘要
第4章 市場狀況
- 市場概覽
- 市場促進因素
- 行動POS(m-POS)在中小企業的普及率激增。
- 與「我的號碼」(日本的社會安全和稅務號碼系統)相關的無現金獎勵計劃激增。
- 擴展QR碼互通性(JPQR)框架
- PCI PTS v6.0 合規性截止日期升級週期
- 將POS系統與入境遊客免稅購物平台整合。
- 將人工智慧驅動的損失預防分析整合到POS終端中
- 市場限制因素
- 加強日本國內數據在地化法規
- 老年人仍然強烈偏愛現金。
- 2025年以後半導體供應鏈的波動性
- 全通路銷售點系統總擁有成本不斷上升
- 宏觀經濟因素的影響
- 產業價值鏈分析
- 監管情勢(主要法規和合規標準)
- 技術展望
- 波特五力分析
- 供應商的議價能力
- 買方的議價能力
- 新進入者的威脅
- 替代品的威脅
- 競爭公司之間的競爭
- 投資分析
- 非接觸式支付普及情形分析
- 主要案例研究
第5章 市場規模與成長預測
- 透過付款方式
- 聯繫類型
- 非接觸式
- POS類型
- 固定式POS系統
- 行動/可攜式POS系統
- 按最終用戶行業分類
- 零售
- 飯店業
- 衛生保健
- 運輸/物流
- 其他
第6章 競爭情勢
- 市場集中度
- 策略趨勢
- 市佔率分析
- 公司簡介
- NEC Corporation
- NCR Corporation
- PAX Global Technology Limited
- Sharp Corporation
- Uniwell Corporation
- Fujitsu Limited
- Casio Computer Co., Ltd.
- Samsung Electronics Co., Ltd.
- Ingenico SA
- Vesca Co., Ltd.
- Oracle Corporation
- Toshiba TEC Corporation
- Seiko Epson Corporation
- Panasonic Connect Co., Ltd.
- Hitachi-Omron Terminal Solutions, Corp.
- BBPOS International Limited
- SZZT Electronics Co., Ltd.
- SUNMI Technology Co., Ltd.
- Newland Digital Technology Co., Ltd.
- Clover Network, Inc.(Fiserv subsidiary)
第7章 市場機會與未來展望
The Japan POS Terminals Market size was valued at USD 7.16 billion in 2025 and is estimated to grow from USD 7.61 billion in 2026 to reach USD 8.82 billion by 2031, at a CAGR of 3% during the forecast period (2026-2031).
Heightened government backing for a 40% cashless ratio, rising contactless preference in travel and quick-service retail, and vendor commitments to AI-driven edge analytics combine to keep the growth curve intact. Rapid My-Number card integration widens the user base and deepens functional requirements, prompting merchants to favor terminals that merge identity verification with payment acceptance. Semiconductor supply stabilization since late-2024 shortens delivery lead times, allowing retailers to accelerate upgrade projects that had stalled during the prolonged chip crunch.Advancing 5G coverage further boosts mobile POS performance, enabling cloud synchronization and real-time analytics even in previously underserved areas. These intertwined factors cement the upward trajectory of the Japan POS terminals market while offering differentiated entry points for both hardware and software specialists.
Japan POS Terminals Market Trends and Insights
Boom in Mobile POS Adoption Across SMEs
Mobile POS installations climbed from 99,000 stores in 2015 to 350,000 stores by 2020 and have kept climbing as small and midsize merchants hunt for cost-efficient digital tools. Sumitomo Mitsui Card's "next stera" roadmap seeks 1 million deployments by 2030, highlighting the scale of latent demand. Japan's first MPoC-certified SoftPOS, launched through a Soft Space and GMO Financial Gate alliance, turns standard smartphones into secure payment devices. Merchant appetite is lifted by lower hardware outlays, shorter rollout times, and value-added analytics that fixed terminals struggle to match. Regulatory pressure nudges the same direction because PCI DSS v4.0 encourages cloud orchestration over on-premise software. Together, economics and compliance converge to keep mobile POS at the core of the Japan POS terminals market expansion.
Surge in My-Number Linked Cashless Incentive Programs
The Cabinet Office aims for a 40% cashless ratio by 2025 and channels subsidies toward terminals capable of authenticating My-Number cards. Hospitals receive dedicated support to replace legacy machines so that insurance data, identity checks, and payment flows merge on one screen. Convenience chains mirror the push, retrofitting thousands of lanes to accept card-based identity verification at checkout. Local governments run QR campaigns tailored for seniors, reducing perceived complexity and stimulating terminal upgrades in community pharmacies and local grocers. Functionality now extends to automated tax reporting and loyalty aggregation, placing fresh performance demands on processors, memory, and encryption modules within each device. As a result, the Japan POS terminals market sees a durable boost anchored not in standard consumer spending cycles but in publicly funded modernization.
Persistent Preference for Cash Among Senior Citizens
Japan recorded a 39.3% national cashless ratio in 2023, yet age-based divergence remains sharp as seniors cling to physical money. Surveys show QR uptake running 35% among the 18-29 cohort but lagging by double digits for those above 60. Rural merchants therefore hesitate to invest in advanced terminals when usage could stay low for years. Local authorities test coupon-backed QR campaigns to coax older shoppers, but success varies by prefecture. Vendors compensate by adding tactile keys and large-font screens, driving bill-of-materials costs upward and trimming gross margins. Consequently, while overall growth stays intact, the Japan POS terminals market must negotiate an entrenched cash culture that bleeds momentum outside metropolitan zones.
Other drivers and restraints analyzed in the detailed report include:
- Growing QR-Code Interoperability (JPQR) Framework
- Upgrade Cycle Driven by PCI PTS v6.0 Compliance Deadline
- Intensifying Domestic Data-Localization Regulations
For complete list of drivers and restraints, kindly check the Table Of Contents.
Segment Analysis
Contactless acceptance held a 62.38% share of the Japan POS terminals market in 2025 and is now compounding at a 4.70% CAGR, permeating vending, transit, and quick-serve venues. Initiatives such as the rollout of contactless readers across 20,000 ME-20 vending machines each year display how firmware upgrades can modernize sprawling installed bases without wholesale replacement. Once early hardware investment is amortized, merchants note throughput gains that translate into higher transaction volumes per store. Consumers report a preference for tap-and-go below USD 40, accelerating habit formation. As EMV tokenization matures, contactless also extends into mid-ticket categories, eating into contact dominance.
On the horizon, QR and contactless may converge as terminals juggle NFC and camera inputs on the same board. Vendors integrate dual readers plus software routing that picks the optimal rail depending on card scheme or wallet used. This multi-modal design lets chains hedge against evolving consumer tastes while controlling capital outlays. Because upgrade projects now aim for 7-year lifecycles, forward-compatible firmware proves a decisive purchasing factor. Such design choices will recalibrate the balance between contact and contactless through 2031, supporting steady re-ordering inside the Japan POS terminals market.
The Japan POS Terminals Market Report is Segmented by Mode of Payment Acceptance (Contact-Based, and Contactless), POS Type (Fixed Point-Of-Sale Systems, and Mobile/Portable Point-Of-Sale Systems), End-User Industry (Retail, Hospitality, Healthcare, Transportation and Logistics, and Other End-User Industries). The Market Forecasts are Provided in Terms of Value (USD).
List of Companies Covered in this Report:
- NEC Corporation
- NCR Corporation
- PAX Global Technology Limited
- Sharp Corporation
- Uniwell Corporation
- Fujitsu Limited
- Casio Computer Co., Ltd.
- Samsung Electronics Co., Ltd.
- Ingenico SA
- Vesca Co., Ltd.
- Oracle Corporation
- Toshiba TEC Corporation
- Seiko Epson Corporation
- Panasonic Connect Co., Ltd.
- Hitachi-Omron Terminal Solutions, Corp.
- BBPOS International Limited
- SZZT Electronics Co., Ltd.
- SUNMI Technology Co., Ltd.
- Newland Digital Technology Co., Ltd.
- Clover Network, Inc. (Fiserv subsidiary)
Additional Benefits:
- The market estimate (ME) sheet in Excel format
- 3 months of analyst support
TABLE OF CONTENTS
1 INTRODUCTION
- 1.1 Study Assumptions and Market Definition
- 1.2 Scope of the Study
2 RESEARCH METHODOLOGY
3 EXECUTIVE SUMMARY
4 MARKET LANDSCAPE
- 4.1 Market Overview
- 4.2 Market Drivers
- 4.2.1 Boom in mobile POS (m-POS) adoption across SMEs
- 4.2.2 Surge in "My-Number" linked cashless incentive programs
- 4.2.3 Growing QR-code interoperability (JPQR) framework
- 4.2.4 Upgrade cycle driven by PCI PTS v6.0 compliance deadline
- 4.2.5 Integration of POS with tax-free shopping platforms for inbound tourism
- 4.2.6 AI-driven loss-prevention analytics embedded into POS terminals
- 4.3 Market Restraints
- 4.3.1 Intensifying domestic data-localization regulations
- 4.3.2 Persistent preference for cash among senior citizens
- 4.3.3 Semiconductor supply-chain volatility post-2025
- 4.3.4 Rising total cost of ownership for omni-channel POS
- 4.4 Impact of Macroeconomic Factors
- 4.5 Industry Value Chain Analysis
- 4.6 Regulatory Landscape (Key Regulations and Compliance Standards)
- 4.7 Technological Outlook
- 4.8 Porter's Five Forces Analysis
- 4.8.1 Bargaining Power of Suppliers
- 4.8.2 Bargaining Power of Buyers
- 4.8.3 Threat of New Entrants
- 4.8.4 Threat of Substitutes
- 4.8.5 Intensity of Competitive Rivalry
- 4.9 Investment Analysis
- 4.10 Contactless Payment Adoption Analysis
- 4.11 Major Case Studies
5 MARKET SIZE AND GROWTH FORECASTS (VALUE)
- 5.1 By Mode of Payment Acceptance
- 5.1.1 Contact-based
- 5.1.2 Contactless
- 5.2 By POS Type
- 5.2.1 Fixed Point-of-Sale Systems
- 5.2.2 Mobile / Portable Point-of-Sale Systems
- 5.3 By End-User Industry
- 5.3.1 Retail
- 5.3.2 Hospitality
- 5.3.3 Healthcare
- 5.3.4 Transportation and Logistics
- 5.3.5 Other End-user Industries
6 COMPETITIVE LANDSCAPE
- 6.1 Market Concentration
- 6.2 Strategic Moves
- 6.3 Market Share Analysis
- 6.4 Company Profiles (includes Global level Overview, Market level overview, Core Segments, Financials as available, Strategic Information, Market Rank/Share for key companies, Products and Services, and Recent Developments)
- 6.4.1 NEC Corporation
- 6.4.2 NCR Corporation
- 6.4.3 PAX Global Technology Limited
- 6.4.4 Sharp Corporation
- 6.4.5 Uniwell Corporation
- 6.4.6 Fujitsu Limited
- 6.4.7 Casio Computer Co., Ltd.
- 6.4.8 Samsung Electronics Co., Ltd.
- 6.4.9 Ingenico SA
- 6.4.10 Vesca Co., Ltd.
- 6.4.11 Oracle Corporation
- 6.4.12 Toshiba TEC Corporation
- 6.4.13 Seiko Epson Corporation
- 6.4.14 Panasonic Connect Co., Ltd.
- 6.4.15 Hitachi-Omron Terminal Solutions, Corp.
- 6.4.16 BBPOS International Limited
- 6.4.17 SZZT Electronics Co., Ltd.
- 6.4.18 SUNMI Technology Co., Ltd.
- 6.4.19 Newland Digital Technology Co., Ltd.
- 6.4.20 Clover Network, Inc. (Fiserv subsidiary)
7 MARKET OPPORTUNITIES AND FUTURE OUTLOOK
- 7.1 White-space and Unmet-Need Assessment
 近距離場通訊 (NFC) POS 終端與支付市場-2026-2032 年全球市場預測電子資金轉帳市場:以組成部分、支付方式、交易類型、最終用戶和交易量分類-2026-2032年全球市場預測
 軟POS市場規模、佔有率和成長分析:按組件、支付類型、部署模式、作業系統、企業規模、應用、最終用戶和地區分類-2026-2033年產業預測
 零售POS終端市場-全球產業規模、佔有率、趨勢、機會、預測:按產品、組件、應用、地區和競爭對手分類,2021-2031年
 全球互聯POS終端市場-第九版POS終端市場:按類型、連接方式、部署方式和最終用戶分類-2026-2032年全球市場預測EMV POS終端市場:2026-2032年全球市場預測(依產品類型、連接方式、部署方式、支付方式及最終用戶分類)
 全球零售POS終端市場規模、佔有率、趨勢及成長分析報告(2026-2034年)
 2026年全球銷售點終端市場報告人工智慧終端市場:按組件、組織規模、部署模式、技術、應用和產業分類-2026-2032年全球預測