

 |
市場調查報告書
商品編碼
2044247
NFT遊戲:市場佔有率分析、產業趨勢與統計、成長預測(2026-2031)NFT Gaming - Market Share Analysis, Industry Trends & Statistics, Growth Forecasts (2026 - 2031) |
||||||
※ 本網頁內容可能與最新版本有所差異。詳細情況請與我們聯繫。
NFT 遊戲市場預計將從 2025 年的 5,300 億美元和 2026 年的 6,200 億美元成長到 2031 年的 1.21 兆美元,2026 年至 2031 年的年複合成長率(CAGR)為 14.31%。
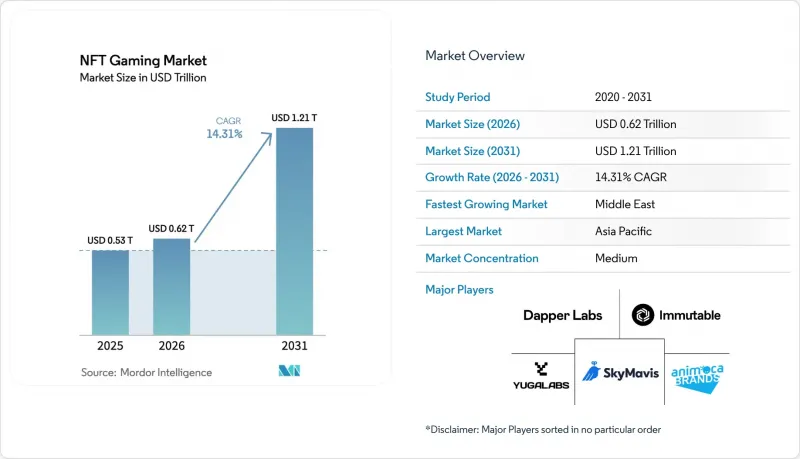
這一快速成長歸功於區塊鏈交易成本的降低、創業融資的增加以及發行商和玩家向共用經濟模式的轉變。二層擴展技術實現了微支付,從而維持了遊戲經濟的流動性,而元宇宙宇宙的穩定發展正在擴大目標用戶群。機構投資者正在支持那些能夠製作AAA級遊戲的開發商,這增強了人們對NFT遊戲市場正進入全面生產階段的信心。最後,亞太地區和中東地區政策的明確化也縮短了先前等待許可指南的開發商的遊戲發佈時間。
全球NFT遊戲市場趨勢及洞察
出版商和玩家向去中心化價值獲取方式的轉變
得益於以智慧合約為基礎的分配機制,如今10%到30%的二次性市場收入會回饋給鑄造或購買資產的玩家,取代了傳統免費遊戲單向的收入模式。 Axie Infinity的用戶在2025年透過轉售版稅獲得了13億美元的收入,即使在價格調整22%之後,數字仍然保持不變。 Wemade旗下支援Wemix 3.0的遊戲,透過採用玩家青睞的70/30分配比例,將其每月有效用戶數提升至420萬。這種設計理念優先考慮用戶留存而非初始獲利,因為玩家可以從中受益。政策制定者尚未明確這些收益是否屬於投資收入,這在歐盟內部造成了一個暫時的灰色地帶。儘管如此,這種機制滿足了人們長期以來對更公平價值分配的需求,隨著發行商追求更高的用戶參與度,它很可能成為行業標準。
與元宇宙的融合將加速其傳播。
像 Decentraland 和 The Sandbox 這樣的持久虛擬世界在 2025 年記錄了 1800 萬個獨立錢包連接,比 2024 年成長了 34%。像阿迪達斯和可口可樂這樣的品牌租戶正在租賃數位房地產,這使得 NFT 的用途超越了單一遊戲。 Yuga Labs 在 2025 年 3 月的「Otherside」發行期間實現了價值 4.2 億美元的土地銷售額,展現了收藏家們對不同 IP 的強大購買力。這種融合正在吸引那些透過品牌活動而非遊戲預告片來發現遊戲的休閒玩家。效能瓶頸依然存在,例如 Decentraland 在高峰活動期間影格速率會降至 20fps 以下,但隨著計劃於 2026 年年中過渡到虛幻引擎 5,處理能力預計將會得到提升。隨著元宇宙每一層的成熟,對可互通的化身、武器和地產的需求將日益成長,這些化身、武器和地產將能夠隨用戶移動,而不僅僅是作為應用程式存在。
數位資產監管方面的不確定性
美國證券交易委員會(SEC)在2025年對NFT遊戲採取了14項執法行動,收取了3.4億美元的和解金,並強制要求遊戲工作室從其行銷資料中刪除與投資相關的措辭。相較之下,歐盟的加密資產市場監管(MiCA)框架提供了一條洗錢防制(AML)審查和創新的許可途徑。韓國透過核准八家區塊鏈遊戲營運商,制定了一套合規藍圖,這些營運商的規則要求使用隔離錢包並為玩家存款購買保險。在日本,允許二級交易的NFT市場目前必須註冊為加密貨幣交易所,這加重了小規模團隊的負擔。在監管嚴格或模糊的地區,服務發布會被推遲,開發成本會被推高,原本應該快速成長的NFT遊戲市場的成長曲線正在放緩。
細分市場分析
到2025年,行動遊戲將佔據NFT遊戲市場46.19%的主導佔有率。智慧型手機的普及以及iOS和Android系統錢包的整合,簡化了用戶獲取流程。雖然玩家通常更喜歡短時遊戲,但像Mirandus這樣的遊戲證明,即使沒有本地加密貨幣錢包,也能實現高清串流媒體播放。每次安裝僅需34美元的低獲客成本,使得行銷預算更加高效,但與PC端相比,解約率更高。
受5G部署的推動,雲端遊戲預計將以15.31%的複合年成長率實現最高成長,5G的部署將延遲降低至20毫秒以下。伺服器端錢包管理對用戶隱藏了區塊鏈的複雜性,使雲端成為注重便利性的傳統遊戲玩家的理想選擇。由於主機平台不願核准NFT遊戲,雲端服務透過提供單次訂閱即可跨裝置暢玩的功能填補了這一空白。終端用戶的硬體需求正在降低,但開發者需要最佳化智慧合約以最大限度地降低伺服器成本,這仍然是2031年之前技術藍圖上的主要挑戰。
到 2025 年,角色扮演遊戲 (RPG) 將佔據 NFT 遊戲市場 38.53% 的佔有率。引人入勝的故事情節鼓勵玩家購買和交易角色 NFT,將平均遊戲長度延長至 47 分鐘。長期的故事發展支持季節性內容的推出,使發行商能夠在不增加代幣供應的情況下實現盈利。此外,這種身臨其境型的遊戲形式非常適合鏈上管治,擁有者可以對任務結果進行投票,從而提高社區參與度。
類比遊戲正以15.84%的複合年成長率快速成長,這得益於城市建造遊戲和農場模擬遊戲中現實世界資產的代幣化。這種被動收入循環吸引了非遊戲玩家,他們將這類遊戲體驗視為一種輕量級的經濟沙盒。 VulcanVerse的玩家可以質押土地NFT來產生資源,從而在熟悉的玩法循環中加入類似DeFi的獎勵。對於設計團隊而言,透過數千筆微交易來維持高水準的經濟平衡是一項挑戰,但回報是能夠獲得一個超越核心RPG粉絲群體的可擴展用戶群。
區域分析
預計到2025年,亞太地區將佔全球收入的41.74%,這主要得益於韓國清晰的授權制度和日本對區塊鏈遊戲營運商的開放態度。由於核准時間可預測,遊戲工作室紛紛率先在這些市場推出服務,使行銷團隊能夠協調全球擴張。儘管中國禁止NFT二級交易迫使「數位收藏品」的規範做出調整,但騰訊憑藉其受監管的「智信鏈」模式已獲得1200萬用戶,這表明NFT遊戲市場能夠適應嚴格的監管環境。
中東是成長最快的地區,預計到2031年複合年成長率將達到15.43%。 2025年,主權財富基金在Web3遊戲基礎建設投資超過10億美元,加速了沙烏地阿拉伯(NEOM)和阿拉伯聯合大公國杜拜多種商品中心的遊戲工作室的建設。 Animoka Brands在阿布達比設立了基地,並與穆巴達拉投資公司合作,使阿拉伯開發者能夠接觸到經驗豐富的發行商。
儘管美國證券交易委員會(SEC)的措施影響了早期代幣發行,北美地區在2025年仍佔總收入的28%。 Epic Games在虛幻引擎中整合的錢包工具包降低了技術門檻,鼓勵傳統工作室在無需建立自有區塊鏈的情況下進行實驗。歐洲地區佔據19%的佔有率,這得益於MiCA,它為工作室提供了一條基於規則的市場准入途徑。南美洲貢獻了7%,利用穩定幣對沖當地通貨膨脹風險;非洲4%的佔有率主要來自奈及利亞和南非,這得益於兩國較高的行動普及率和不斷成長的匯款需求。每個地區都面臨各自的監管和基礎設施障礙,但全球對所有權主導遊戲的需求仍然穩定,這支撐著NFT遊戲產業的整體成長。
其他好處:
- Excel格式的市場預測(ME)表
- 3個月的分析師支持
目錄
第1章:引言
- 研究假設和市場定義
- 調查範圍
第2章:調查方法
第3章執行摘要
第4章 市場狀況
- 市場概覽
- 市場促進因素
- 向去中心化的發布商和玩家以及價值創造過渡。
- 與元宇宙的融合將加速其傳播。
- 創業投資流入區塊鏈遊戲
- 透過「邊玩邊賺(P2E)」模式獲利的趨勢日益成長。
- 透過 Layer 2 擴展降低交易成本
- 一種可互通的NFT標準,能夠實現遊戲間的資源共用。
- 市場限制因素
- 數位資產監管方面的不確定性
- 對工作量證明(PoW)鏈的環境批評
- 代幣通貨膨脹會損害遊戲內的經濟。
- 對於不熟悉加密貨幣的玩家來說,進入門檻很高
- 遊戲中的NFT:模式轉移
- 流行趨勢分析
- 第一代 NFT 標題
- 第二代 NFT 和 P2E 標題
- 第三代NFT+P2E+高畫質圖形
- 第四代NFT + P2E + AAA級遊戲
- 產業價值鏈分析
- 監理情勢
- 技術展望
- 宏觀經濟因素的影響
- 波特五力分析
- 新進入者的威脅
- 買方的議價能力
- 供應商的議價能力
- 替代品的威脅
- 競爭公司之間的競爭
- 投資分析
第5章 市場規模與成長預測
- 按平台
- 手機遊戲
- 電腦遊戲
- 主機遊戲
- 雲端遊戲
- 遊戲類型
- 角色扮演遊戲(RPG)
- 策略
- 模擬
- 運動的
- 其他遊戲類型
- 按收入模式
- 玩遊戲賺錢(P2E)
- 免費暢玩,支援NFT微交易。
- 訂閱 + NFT 權益
- 混合模式
- 透過區塊鏈
- 以太坊
- 幣安智慧鏈
- Polygon
- 其他區塊鏈協議
- 按地區
- 北美洲
- 美國
- 加拿大
- 墨西哥
- 南美洲
- 巴西
- 阿根廷
- 南美洲其他地區
- 歐洲
- 德國
- 法國
- 英國
- 義大利
- 西班牙
- 其他歐洲地區
- 亞太地區
- 中國
- 日本
- 印度
- 韓國
- 澳洲
- 亞太其他地區
- 中東
- 沙烏地阿拉伯
- 阿拉伯聯合大公國
- 土耳其
- 其他中東國家
- 非洲
- 南非
- 埃及
- 奈及利亞
- 其他非洲地區
- 北美洲
第6章 競爭情勢
- 市場集中度
- 策略趨勢
- 市佔率分析
- 公司簡介
- Sky Mavis Pte Ltd
- Immutable Pty Ltd
- Yuga Labs Inc
- Animoca Brands Corporation Ltd
- Dapper Labs Inc
- Gala Games LLC
- Illuvium Labs Ltd
- Mythical Inc
- Wemade Co Ltd
- Netmarble Corporation
- Com2uS Holdings Corporation
- Decentraland Foundation
- Enjin Pte Ltd
- Sorare SAS
- Ubisoft Entertainment SA
- Electronic Arts Inc
- Epic Games Inc
- Splinterlands Inc
- Vulcan Forged Ltd
- Ozone Networks Inc(OpenSea)
第7章 市場機會與未來展望
The NFT gaming market size is projected to expand from USD 0.53 trillion in 2025 and USD 0.62 trillion in 2026 to USD 1.21 trillion by 2031, registering a 14.31% CAGR between 2026 and 2031.
The rapid growth flows from lower blockchain transaction costs, expanding venture funding, and the shift toward shared publisher-player economics. Layer-2 scaling now supports micro-payments that keep game economies fluid, while the steady rollout of metaverse worlds broadens the addressable audience. Institutional investors are backing studios that can deliver AAA-quality play, cementing confidence that the NFT gaming market is entering a production-grade era. Finally, regional policy clarity in Asia-Pacific and the Middle East is shortening time-to-launch for studios that previously waited on licensing guidance.
Global NFT Gaming Market Trends and Insights
Shift To Distributed Publisher-Player Value Capture
Smart-contract splits now route 10%-30% of secondary-market proceeds back to the players who minted or earned the assets, replacing the one-way revenue flow of traditional free-to-play. Axie Infinity users earned USD 1.3 billion from resale royalties in 2025, a figure that still held even after a 22% price correction. Wemade's Wemix 3.0 titles boosted monthly active users to 4.2 million by adopting a player-favoured 70-30 payout. The design philosophy puts retention ahead of upfront monetization because players own the upside. Policymakers have yet to define whether these flows qualify as investment income, creating a temporary gray zone inside the European Union. Even so, the mechanism answers long-standing calls for fairer value distribution and is likely to become standard as publishing houses chase higher engagement scores.
Metaverse Alignment Accelerating Uptake
Persistent virtual worlds such as Decentraland and The Sandbox logged 18 million unique wallet connections in 2025, a 34% rise over 2024. Brand tenants like Adidas and Coca-Cola lease digital real estate, giving NFTs utility that lasts outside a single title. Yuga Labs moved USD 420 million in land sales during the March 2025 Otherside mint, showing the purchasing power of cross-IP collectors. The convergence attracts casual spectators who discover gaming through branded events rather than gameplay trailers. Performance bottlenecks persist, evidenced by sub-20 fps rates during peak Decentraland events, but an Unreal Engine 5 migration scheduled for mid-2026 should lift capacity. As metaverse layers mature, they lock in demand for interoperable avatars, weapons, and real estate that travel with the user rather than the app.
Regulatory Uncertainty Over Digital Assets
The Securities and Exchange Commission pursued 14 enforcement actions against NFT games in 2025, extracting USD 340 million in settlements and forcing studios to strip investment language from marketing materials. By contrast, the European Union's MiCA framework offers a licensing path that balances AML checks with innovation. South Korea approved eight blockchain game operators under rules that mandate segregated wallets and insurance for player deposits, creating a compliance blueprint. Japan now requires NFT marketplaces to register as crypto-asset exchanges if they enable secondary trading, raising overhead for smaller teams. Regions with strict or ambiguous policies impose launch delays, inflating development costs and tempering the NFT gaming market's otherwise steep growth curve.
Other drivers and restraints analyzed in the detailed report include:
- Venture-Capital Funding Inflows to Blockchain Gaming
- Rising Play-To-Earn Monetization Preference
- Environmental Criticism of Proof-Of-Work Chains
For complete list of drivers and restraints, kindly check the Table Of Contents.
Segment Analysis
Mobile Gaming held a dominant 46.19% share of NFT gaming market size in 2025. Widespread smartphone ownership and wallet integrations inside iOS and Android streamline onboarding. Players gravitate to bite-sized sessions, yet titles such as Mirandus prove that high-fidelity streaming is viable without local crypto wallets. Lower acquisition costs, at USD 34 per install, keep marketing budgets efficient, although churn rates are higher than in PC segments.
Cloud Gaming is forecast to post the fastest 15.31% CAGR, powered by 5G rollouts that push latency under 20 milliseconds. Server-side wallet custody hides blockchain complexity from users, positioning cloud as a bridge for traditional gamers who value convenience. As console platforms hesitate to approve NFT games, cloud services fill the gap by offering cross-device play under a single subscription. Hardware requirements drop for end users, but developers must optimize smart contracts to minimize server costs, shaping a technical agenda that dominates roadmaps through 2031.
Role-Playing Games commanded 38.53% of NFT gaming market share in 2025. Narrative depth encourages players to buy and trade character NFTs, extending engagement cycles that average 47 minutes per session. Long story arcs support seasonal drops, letting publishers monetize without inflating token supply. The immersive format also lends itself to on-chain governance, where holders vote on quest outcomes, increasing community stickiness.
Simulation titles are expanding at a 15.84% CAGR as they tokenize real-world assets inside city builders and farm simulators. Passive income loops draw non-gamer demographics who approach the experience as a light economic sandbox. VulcanVerse players can stake land NFTs that yield resources, adding DeFi-like incentives within a familiar gameplay loop. Balancing advanced economies across thousands of micro-transactions stresses design teams, yet the upside is a scalable audience outside the core RPG fan base.
The NFT Gaming Market Report is Segmented by Platform (Mobile Gaming, PC Gaming, Console Gaming, and Cloud Gaming), Game Genre (Role-Playing Games, Strategy, Simulation, Sports, More Game Genres), Revenue Model (Play-To-Earn, Free-To-Play With NFT Micro-Transactions, and More), Blockchain (Ethereum, Binance Smart Chain, Polygon, and More), and Geography. The Market Forecasts are Provided in Terms of Value (USD).
Geography Analysis
Asia-Pacific held 41.74% of 2025 revenue, anchored by South Korea's clear licensing regime and Japan's open stance toward blockchain game operators. Studios launch first in these markets because approval timelines are predictable, letting marketing teams coordinate global rollouts. China's ban on secondary NFT trading forces modified "digital collectible" builds, yet Tencent still attracted 12 million users under the compliant Zhixin Chain model, illustrating that the NFT gaming market can adapt to heavy restrictions.
The Middle East is the fastest-growing region at a 15.43% CAGR through 2031. Sovereign funds placed more than USD 1 billion into Web3 gaming infrastructure during 2025, accelerating studio creation inside Saudi Arabia's NEOM and the UAE's Dubai Multi Commodities Centre. Animoca Brands opened an Abu Dhabi base and partnered with Mubadala, giving Arabic developers access to seasoned publishers.
North America delivered 28% of 2025 sales even as SEC actions shook early token launches. Epic Games' wallet toolkit inside Unreal Engine lowers technical barriers, encouraging traditional studios to experiment without building bespoke chains. Europe, at 19% share, benefits from MiCA, which gives studios a rules-based path to market. South America contributed 7% by leveraging stablecoins that hedge local inflation, while Africa's 4% share came from Nigeria and South Africa where high mobile penetration meets growing remittance use cases. Each territory presents unique regulatory or infrastructure hurdles, yet the global appetite for ownership-driven play remains consistent, supporting a broadly distributed growth story for the NFT gaming industry.
- Sky Mavis Pte Ltd
- Immutable Pty Ltd
- Yuga Labs Inc
- Animoca Brands Corporation Ltd
- Dapper Labs Inc
- Gala Games LLC
- Illuvium Labs Ltd
- Mythical Inc
- Wemade Co Ltd
- Netmarble Corporation
- Com2uS Holdings Corporation
- Decentraland Foundation
- Enjin Pte Ltd
- Sorare SAS
- Ubisoft Entertainment SA
- Electronic Arts Inc
- Epic Games Inc
- Splinterlands Inc
- Vulcan Forged Ltd
- Ozone Networks Inc (OpenSea)
Additional Benefits:
- The market estimate (ME) sheet in Excel format
- 3 months of analyst support
TABLE OF CONTENTS
1 INTRODUCTION
- 1.1 Study Assumptions and Market Definition
- 1.2 Scope of the Study
2 RESEARCH METHODOLOGY
3 EXECUTIVE SUMMARY
4 MARKET LANDSCAPE
- 4.1 Market Overview
- 4.2 Market Drivers
- 4.2.1 Shift to Distributed Publisher-Player Value Capture
- 4.2.2 Metaverse Alignment Accelerating Uptake
- 4.2.3 Venture-Capital Funding Inflows to Blockchain Gaming
- 4.2.4 Rising Play-to-Earn Monetization Preference
- 4.2.5 Layer-2 Scaling Slashing Transaction Costs
- 4.2.6 Interoperable NFT Standards Enabling Cross-Game Assets
- 4.3 Market Restraints
- 4.3.1 Regulatory Uncertainty Over Digital Assets
- 4.3.2 Environmental Criticism of Proof-of-Work Chains
- 4.3.3 Token Inflation Undermining In-Game Economies
- 4.3.4 On-Boarding Friction for Non-Crypto Gamers
- 4.4 NFT in Gaming, A Paradigm Shift
- 4.5 Adoption Trends Analysis
- 4.5.1 First-Generation NFT Titles
- 4.5.2 Second-Generation NFT plus P2E Titles
- 4.5.3 Third-Generation NFT plus P2E plus High-Fidelity Graphics
- 4.5.4 Fourth-Generation NFT plus P2E plus AAA Titles
- 4.6 Industry Value-Chain Analysis
- 4.7 Regulatory Landscape
- 4.8 Technological Outlook
- 4.9 Impact of Macroeconomic Factors
- 4.10 Porter's Five Forces Analysis
- 4.10.1 Threat of New Entrants
- 4.10.2 Bargaining Power of Buyers
- 4.10.3 Bargaining Power of Suppliers
- 4.10.4 Threat of Substitutes
- 4.10.5 Competitive Rivalry
- 4.11 Investment Analysis
5 MARKET SIZE AND GROWTH FORECASTS (VALUE)
- 5.1 By Platform
- 5.1.1 Mobile Gaming
- 5.1.2 PC Gaming
- 5.1.3 Console Gaming
- 5.1.4 Cloud Gaming
- 5.2 By Game Genre
- 5.2.1 Role-Playing Games (RPG)
- 5.2.2 Strategy
- 5.2.3 Simulation
- 5.2.4 Sports
- 5.2.5 Other Game Genres
- 5.3 By Revenue Model
- 5.3.1 Play-to-Earn (P2E)
- 5.3.2 Free-to-Play with NFT Micro-Transactions
- 5.3.3 Subscription plus NFT Perks
- 5.3.4 Hybrid Models
- 5.4 By Blockchain
- 5.4.1 Ethereum
- 5.4.2 Binance Smart Chain
- 5.4.3 Polygon
- 5.4.4 Other Blockchain Protocols
- 5.5 By Geography
- 5.5.1 North America
- 5.5.1.1 United States
- 5.5.1.2 Canada
- 5.5.1.3 Mexico
- 5.5.2 South America
- 5.5.2.1 Brazil
- 5.5.2.2 Argentina
- 5.5.2.3 Rest of South America
- 5.5.3 Europe
- 5.5.3.1 Germany
- 5.5.3.2 France
- 5.5.3.3 United Kingdom
- 5.5.3.4 Italy
- 5.5.3.5 Spain
- 5.5.3.6 Rest of Europe
- 5.5.4 Asia-Pacific
- 5.5.4.1 China
- 5.5.4.2 Japan
- 5.5.4.3 India
- 5.5.4.4 South Korea
- 5.5.4.5 Australia
- 5.5.4.6 Rest of Asia-Pacific
- 5.5.5 Middle East
- 5.5.5.1 Saudi Arabia
- 5.5.5.2 United Arab Emirates
- 5.5.5.3 Turkey
- 5.5.5.4 Rest of Middle East
- 5.5.6 Africa
- 5.5.6.1 South Africa
- 5.5.6.2 Egypt
- 5.5.6.3 Nigeria
- 5.5.6.4 Rest of Africa
- 5.5.1 North America
6 COMPETITIVE LANDSCAPE
- 6.1 Market Concentration
- 6.2 Strategic Moves
- 6.3 Market Share Analysis
- 6.4 Company Profiles (includes Global Level Overview, Market Level Overview, Core Segments, Financials as available, Strategic Information, Market Rank/Share, Products and Services, Recent Developments)
- 6.4.1 Sky Mavis Pte Ltd
- 6.4.2 Immutable Pty Ltd
- 6.4.3 Yuga Labs Inc
- 6.4.4 Animoca Brands Corporation Ltd
- 6.4.5 Dapper Labs Inc
- 6.4.6 Gala Games LLC
- 6.4.7 Illuvium Labs Ltd
- 6.4.8 Mythical Inc
- 6.4.9 Wemade Co Ltd
- 6.4.10 Netmarble Corporation
- 6.4.11 Com2uS Holdings Corporation
- 6.4.12 Decentraland Foundation
- 6.4.13 Enjin Pte Ltd
- 6.4.14 Sorare SAS
- 6.4.15 Ubisoft Entertainment SA
- 6.4.16 Electronic Arts Inc
- 6.4.17 Epic Games Inc
- 6.4.18 Splinterlands Inc
- 6.4.19 Vulcan Forged Ltd
- 6.4.20 Ozone Networks Inc (OpenSea)
7 MARKET OPPORTUNITIES AND FUTURE OUTLOOK
- 7.1 White-Space and Unmet-Need Assessment
 2026年元宇宙非同質化代幣(NFT)全球市場報告
 非同質化代幣(NFT) 市場:2026-2032 年全球市場預測(依資產類型、市場類型、定價模式、買家類型、媒體類型和銷售管道)2026年元宇宙全球NFT市場報告2026年NFT遊戲全球市場報告2026年全球非同質化代幣(NFT)和機器人個性商店市場報告2026年全球基於區塊鏈的XR資產市場報告
 2026-2030年全球非同質化代幣(NFT)市場
 NFT市場分析及至2035年預測:按類型、產品、服務、技術、組件、應用、最終用戶、部署類型和解決方案分類非同質化代幣(NFT) 市場分析及至 2035 年預測:按類型、產品類型、服務、技術、組件、應用、最終用戶和部署類型分類
 全球非同質化代幣(NFT) 市場預測至 2034 年:按類型、區塊鏈平台、市場類型、應用、最終用戶和地區分類