


 |
市場調查報告書
商品編碼
2044227
物聯網設備:市場佔有率分析、產業趨勢與統計、成長預測(2026-2031)IoT Devices - Market Share Analysis, Industry Trends & Statistics, Growth Forecasts (2026 - 2031) |
||||||

※ 本網頁內容可能與最新版本有所差異。詳細情況請與我們聯繫。
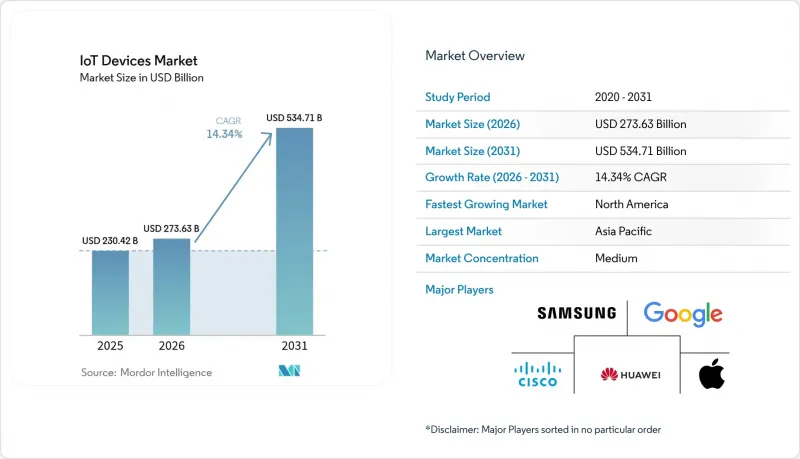
預計物聯網設備市場將從 2025 年的 2,304.2 億美元成長到 2026 年的 2,736.3 億美元,到 2031 年達到 5,347.1 億美元,2026 年至 2031 年的複合年成長率為 14.34%。
隨著企業開始部署融合邊緣智慧、低功耗廣域通訊和雲端協作的互通設備,相關技術的普及速度正在加快。美國聯邦和歐洲遠端患者監護報銷制度的改革推動了醫療硬體訂單的成長,而北美、歐盟和中國的車聯網(V2X)法規則推動了新型車輛的大規模互聯。此外,各國關於資料居住的主權法規也推動了對配備神經網路引擎的微控制器的需求,因為機器學習推理現在可以在設備的晶片上進行。同時,亞洲低功耗廣域網路(LPWAN)頻段的統一性降低了漫遊費用,並使物流公司能夠跨國追蹤資產。這些變化正在推動消費、工業和基礎設施領域的出貨量實現兩位數的成長。
全球物聯網設備市場趨勢及洞察
5G 和 LPWAN 的部署正在加速物聯網設備的大規模出貨。
到2025年,RedCap 5G網路已在27個國家推出,提供適中的頻寬,適用於攝影機、穿戴式裝置和工業感測器,且電力消耗遠低於增強型行動寬頻。通訊業者提供的資料方案低於每台設備每年2美元,使得全國範圍的部署經濟有效率。 LoRaWAN和NB-IoT同步發展,尤其是在印度和巴西,隨著公共產業電錶,預計到2025年出貨量將超過1.8億台。東協地區900MHz頻段的統一性使得物流業者能夠在多個國家/地區使用單一硬體設計。這些進步將降低連接成本,消除漫遊障礙,並支援需要數十億個低吞吐量連接的長尾應用場景。
邊緣人工智慧矽成本的降低將擴展工業IoT的視覺功能。
2025年,配備板載神經網路引擎的微控制器成本將低於每百萬台3美元。這將使製造商無需將圖像發送到雲端即可為攝影機添加即時缺陷檢測功能。汽車零件供應商已在其噴漆生產線上部署了這些系統,在德國和日本的工廠中,缺陷率降低了高達18%。本地推理也符合歐洲資料主權法規,並保持低於10毫秒的延遲,這是安全關鍵任務所需的閾值。供應商目前正在將硬體加密功能整合到其神經網路引擎中,以幫助工廠滿足IEC 62443網路安全標準。半導體價格的下降、監管壓力和安全功能的增強正在推動視覺感測器在工廠車間的快速普及。
韌體更新生態系統碎片化正在造成網路安全風險。
約 40% 的已部署物聯網控制器缺乏可靠的無線更新途徑,導致已知漏洞數月未修補。 2025 年,美國網路安全和基礎設施安全局 (CISA) 發布了 18 項針對工業設備的安全建議,迫使設備所有者承擔昂貴的現場維護費用來安裝修補程式。專有引導程式和相互競爭的更新協議使得企業無法實施統一的修補程式工作流程。為此,網路保險公司已採取措施,除非企業證明其按季度進行更新,否則將保費提高 15% 至 25%。缺乏通用標準(例如汽車行業的 UNECE WP.29),導致企業不斷累積技術債務,最終迫使其進行代價高昂的維修或提前更換設備。
細分市場分析
預計2026年至2031年間,智慧農業將以14.39%的複合年成長率成長,其成長主要得益於精準灌溉等應用,尤其是在加州中央谷地和印度旁遮普邦等缺水地區,以及牲畜健康監測等領域。智慧家庭物聯網設備市場預計到2025年將達到30.82%的佔有率,但由於北美和西歐的家庭普及率已超過三分之一,其成長速度正在放緩。
受美國保險報銷改革的推動,醫療物聯網正在加速發展,預計2025年將佔所有應用程式的18%。連線健診設備正逐漸成為新的收入來源,FDA核准較去年同期成長40%,產品上市週期也正在縮短。雖然聯網汽車的部署正按V2X(車聯網)的時間表推進,但仍面臨漫長的型號認證週期,導致收入累計延遲。工業IoT仍是企業面臨的最大機遇,先導工廠透過部署振動和溫度感測器,可將停機時間減少高達30%。
智慧音箱和顯示器在2025年佔據了物聯網設備市場26.61%的佔有率,但由於更換週期延長至四年,其成長速度正在放緩。受歐洲和加州相關法規的推動,連接型家電預計到2031年將以14.43%的年均成長率成長,這些法規要求冷藏庫和恆溫器即時報告用電量。
穿戴式裝置保持著兩位數的成長,其中脈搏血氧計和心房顫動檢測功能在獲得美國食品藥物管理局 (FDA)核准後,預計將納入健康儲蓄帳戶 (HSA) 的報銷範圍。工業感測器的平均售價最高,這反映了其堅固的機殼和防爆認證。倫敦和巴黎強制要求即時共享位置資訊以執行停車規定後,用於滑板車和電動自行車的 GPS 追蹤器越來越受歡迎。
區域分析
預計2026年至2031年間,北美地區的年均成長率將達到14.62%,超過其他地區。美國農業法案津貼8億美元用於感測器驅動的灌溉系統,而V2X(車聯網)強制規定要求汽車製造商在2027年前整合互聯功能。德克薩斯州和安大略省的電力公司在2025年安裝了1,200萬個智慧電錶,以適應分時電價。在墨西哥,工廠正在部署預測性維護感測器以滿足出口品質標準,從而推動了當地對高性能工業模組的需求。
預計到2025年,亞太地區將佔據41.72%的市場佔有率,這主要得益於中國智慧城市建設的採購需求、印度強制部署測量設備以及東南亞國協的工廠自動化。該地區的供應商已交付4.5億個模組,建造了強大的本地生態系統。日本和韓國分別部署了超過50個企業級5G網路,為需要亞毫秒延遲的半導體和汽車工廠提供服務。
在歐洲,綠色新政強制要求部署連網恆溫器、人體感應器和智慧充電器,進一步推動了物聯網的普及。德國、法國和義大利正在重工業領域部署預測性維護設備,以減少停機時間。在中東,物聯網正被應用於NEOM等大型企劃中,從一開始就整合了自動駕駛汽車和無人機物流。非洲的物聯網應用仍處於起步階段,南非和奈及利亞正在實施智慧電錶和農業試驗計畫。在南美洲,衛星物聯網的應用正在擴展,用於監測偏遠農田的牲畜和穀倉。
其他好處:
- Excel格式的市場預測(ME)表
- 3個月的分析師支持
目錄
第1章:引言
- 研究假設和市場定義
- 調查範圍
第2章:調查方法
第3章執行摘要
第4章 市場狀況
- 市場概覽
- 市場促進因素
- 5G 和 LPWAN 的部署正在加速大規模物聯網設備的出貨。
- 邊緣人工智慧半導體成本的下降將促進具備視覺功能的工業IoT的擴展。
- 支援遠端患者監護設備的報銷政策
- V2X法規將加速聯網汽車硬體的普及。
- 支援 Sub-UDS1 的安全微控制器的 AI 原生晶片
- 強制安裝智慧電錶正在推動互聯能源設備的發展。
- 市場限制因素
- 韌體更新生態系統碎片化會帶來網路風險
- 超低功耗微控制器半導體的供應波動
- 缺乏能源採集標準阻礙了無電池感測器的廣泛應用。
- 不符合型式認證標準的灰色市場LPWAN模組。
- 價值鏈分析
- 監理展望
- 技術展望
- 波特五力模型
- 供應商的議價能力
- 買方的議價能力
- 新進入者的威脅
- 替代品的威脅
- 競爭公司之間的競爭
- 技術概述
- 物聯網的演進
- 顛覆性技術促進了廣泛應用
- 物聯網設備的關鍵元件
- 投資分析
第5章 市場規模與成長預測
- 透過使用
- 互聯智慧家居
- 醫療物聯網
- 聯網汽車
- 智慧城市
- 工業IoT
- 個人物聯網
- 智慧農業
- 其他用途
- 按設備類別
- 智慧音箱和顯示器
- 穿戴式裝置(手錶、腕帶、耳機類裝置)
- 連接型家電
- 智慧型能源及公用設施設備(電錶、恆溫器)
- 工業感測器和執行器
- 連網攝影機和安防設備
- 微移動追蹤器
- 自生成式環境感測器
- 透過連接技術
- WPAN(藍牙、Zigbee、Z-Wave)
- WLAN(Wi-Fi 4/5/6/6E/7)
- LPWAN(NB-IoT、LTE-M、LoRa、Sigfox)
- 蜂窩網路(4G、5G、C-V2X)
- 衛星物聯網
- 混合多頻段模組
- 透過電源
- 電池供電
- 能源採集
- 商用電源
- 按地區
- 北美洲
- 美國
- 加拿大
- 墨西哥
- 南美洲
- 巴西
- 阿根廷
- 南美洲其他地區
- 歐洲
- 德國
- 英國
- 法國
- 義大利
- 其他歐洲地區
- 亞太地區
- 中國
- 日本
- 印度
- 韓國
- 亞太其他地區
- 中東
- 沙烏地阿拉伯
- 阿拉伯聯合大公國
- 其他中東國家
- 非洲
- 南非
- 奈及利亞
- 其他非洲地區
- 北美洲
第6章 競爭情勢
- 市場集中度
- 策略趨勢
- 市佔率分析
- 公司簡介
- Apple Inc.
- Samsung Electronics Co. Ltd.
- Amazon.com Inc.
- Alphabet Inc.(Google)
- Xiaomi Corp.
- Cisco Systems Inc.
- Huawei Technologies Co. Ltd.
- Microsoft Corp.
- Intel Corp.
- Honeywell International Inc.
- Siemens AG
- LG Electronics Inc.
- Sony Group Corp.
- Robert Bosch GmbH
- Schneider Electric SE
- Signify NV(Philips)
- Arm Ltd.
- Qualcomm Inc.
- NXP Semiconductors NV
- Dell Technologies Inc.
- Ericsson AB
- Quectel Wireless Solutions Co. Ltd.
- Telit Cinterion
- Particle Industries Inc.
第7章 市場機會與未來展望
The IoT devices market size is expected to increase from USD 230.42 billion in 2025 to USD 273.63 billion in 2026 and reach USD 534.71 billion by 2031, growing at a CAGR of 14.34% over 2026-2031. Adoption is rising because enterprises now deploy interoperable device fleets that combine edge intelligence, low-power wide-area connectivity, and cloud orchestration. Federal and European reimbursement reforms for remote patient monitoring are stimulating medical hardware orders, while vehicle-to-everything regulations in North America, the European Union, and China are embedding connectivity into new vehicles at scale. Sovereign data-residency rules are also pushing machine-learning inference onto device silicon, lifting demand for microcontrollers that include neural engines. At the same time, spectrum alignment for LPWAN in Asia is cutting roaming fees and enabling logistics firms to track assets across borders. These shifts are translating into double-digit shipment growth across consumer, industrial, and infrastructure verticals.
Global IoT Devices Market Trends and Insights
5G and LPWAN Roll-Outs Accelerating Massive-IoT Shipments
RedCap 5G networks launched in 27 countries during 2025, offering mid-tier bandwidth that fits cameras, wearables, and industrial sensors without the high energy draw of enhanced mobile broadband. Operators priced annual data plans below USD 2 per device, making nationwide deployments economical. Parallel growth in LoRaWAN and NB-IoT, especially in India and Brazil where utilities replaced legacy meters, boosted unit volumes past 180 million in 2025. Harmonized 900 MHz spectrum in ASEAN now lets logistics providers use one hardware design across multiple countries. These developments lower connectivity costs, remove roaming barriers, and unlock long-tail use cases that require billions of low-throughput links.
Edge-AI Silicon Cost Decline Expanding Vision-Enabled Industrial IoT
Microcontrollers with on-board neural engines fell below USD 3 at million-unit scale in 2025, allowing manufacturers to add real-time defect detection to cameras without sending images to the cloud. Automotive suppliers deployed these systems on paint lines and reduced scrap rates by up to 18% in German and Japanese plants. Local inference also satisfies European data-sovereignty rules and keeps latency under 10 milliseconds, a threshold required for safety-critical tasks. Vendors now bundle hardware encryption with neural engines, helping factories meet IEC 62443 cybersecurity benchmarks. Lower silicon prices, regulatory pressure, and security features are driving rapid penetration of vision-enabled sensors on the factory floor.
Fragmented Firmware-Update Ecosystems Creating Cyber-Risk
Around 40% of installed IoT controllers lack reliable over-the-air update paths, keeping known vulnerabilities unpatched for months. In 2025 CISA published 18 advisories targeting industrial gear whose owners faced expensive on-site visits to install fixes. Proprietary bootloaders and competing update protocols block enterprises from adopting a single patch workflow. Cyber-insurance providers reacted by raising premiums 15-25% unless quarterly updates are proven. Without a universal standard akin to automotive UNECE WP.29, firms accrue technical debt that eventually forces costly retrofits or early device replacement.
Other drivers and restraints analyzed in the detailed report include:
- Reimbursement Policies Boosting Remote-Patient Monitoring Devices
- V2X Regulations Catalyzing Connected-Car Hardware Installations
- Semiconductor Supply Volatility for Ultra-Low-Power MCUs
For complete list of drivers and restraints, kindly check the Table Of Contents.
Segment Analysis
Smart Agriculture is set to rise at a 14.39% CAGR during 2026-2031 on the back of precision irrigation and livestock-health monitors in water-stressed zones such as California's Central Valley and India's Punjab. The IoT devices market size for smart-home applications climbed to 30.82% share in 2025, but growth is slowing because household penetration now exceeds one-third in North America and Western Europe.
Medical IoT accelerated after U.S. reimbursement reforms, taking 18% of the application pie in 2025. FDA approvals rose 40% year over year, shortening product launch cycles and making connected health gear a rising revenue source. Connected-car deployments track V2X deadlines yet still face long homologation cycles that defer revenue recognition. Industrial IoT remains the largest enterprise opportunity, as vibration and thermal sensors cut downtime by up to 30% in pilot plants.
Smart Speakers and Displays delivered 26.61% of IoT devices market share in 2025, but replacement windows have extended to four years, slowing further gains. Connected Consumer Appliances are forecast to grow at 14.43% through 2031 because European and Californian rules now oblige refrigerators and thermostats to report real-time power use.
Wearables sustain double-digit expansion as pulse-oximetry and atrial-fibrillation detection receive FDA clearance, positioning devices for health savings account reimbursement. Industrial sensors post the highest average selling price, reflecting ruggedized enclosures and explosion-proof certifications. GPS trackers for scooters and e-bikes are scaling after London and Paris mandated live-location feeds to enforce parking rules.
The IoT Devices Market Report is Segmented by Application Type (Connected and Smart Home, Medical IoT, Connected Car, Smart Cities, Industrial IoT, and More), Device Category (Smart Speakers and Displays, Wearables, Connected Consumer Appliances, and More), Connectivity Technology (WPAN, WLAN, and More), Power Source (Battery-Powered and More) and Geography. The Market Forecasts are Provided in Terms of Value (USD).
Geography Analysis
North America is projected to grow at 14.62% between 2026 and 2031, outpacing other regions. U.S. Farm Bill grants worth USD 800 million fund sensor-driven irrigation, and V2X mandates compel automakers to add connectivity by 2027. Utilities in Texas and Ontario installed 12 million smart meters in 2025 to support time-of-use tariffs. Mexico's factories are adding predictive-maintenance sensors to meet export quality standards, driving local demand for rugged industrial modules.
Asia-Pacific held 41.72% share in 2025, fueled by China's smart-city procurements, India's metering mandates, and factory automation in ASEAN. Domestic suppliers shipped 450 million modules, giving the region strong local ecosystems. Japan and South Korea rolled out more than 50 enterprise 5G networks each to service semiconductor and automotive plants that need sub-millisecond latency.
Europe continues to scale IoT under the Green Deal, mandating connected thermostats, occupancy sensors, and smart chargers. Germany, France, and Italy are adding predictive-maintenance devices in heavy industries to curb downtime. The Middle East is using IoT in megaprojects such as NEOM, where autonomous vehicles and drone logistics are embedded from day one. Africa remains early stage, with pilot smart-meter and agriculture programs in South Africa and Nigeria. South America is expanding satellite IoT to monitor cattle and grain silos across remote farmland.
List of Companies Covered in this Report:
- Apple Inc.
- Samsung Electronics Co. Ltd.
- Amazon.com Inc.
- Alphabet Inc. (Google)
- Xiaomi Corp.
- Cisco Systems Inc.
- Huawei Technologies Co. Ltd.
- Microsoft Corp.
- Intel Corp.
- Honeywell International Inc.
- Siemens AG
- LG Electronics Inc.
- Sony Group Corp.
- Robert Bosch GmbH
- Schneider Electric SE
- Signify N.V. (Philips)
- Arm Ltd.
- Qualcomm Inc.
- NXP Semiconductors N.V.
- Dell Technologies Inc.
- Ericsson AB
- Quectel Wireless Solutions Co. Ltd.
- Telit Cinterion
- Particle Industries Inc.
Additional Benefits:
- The market estimate (ME) sheet in Excel format
- 3 months of analyst support
TABLE OF CONTENTS
1 INTRODUCTION
- 1.1 Study Assumptions and Market Definition
- 1.2 Scope of the Study
2 RESEARCH METHODOLOGY
3 EXECUTIVE SUMMARY
4 MARKET LANDSCAPE
- 4.1 Market Overview
- 4.2 Market Drivers
- 4.2.1 5G and LPWAN Roll-Outs Accelerating Massive-IoT Shipments
- 4.2.2 Edge-AI Silicon Cost Decline Expanding Vision-Enabled Industrial IoT
- 4.2.3 Reimbursement Policies Boosting Remote-Patient Monitoring Devices
- 4.2.4 V2X Regulations Catalyzing Connected-Car Hardware Installations
- 4.2.5 Ai-Native Chiplets Enabling Sub-UDS1 Secure Micro-Controllers
- 4.2.6 Smart-Meter Mandates Driving Connected-Energy Devices
- 4.3 Market Restraints
- 4.3.1 Fragmented Firmware-Update Ecosystems Creating Cyber-Risk
- 4.3.2 Semiconductor Supply Volatility For Ultra-Low-Power MCUs
- 4.3.3 Absence Of Energy-Harvesting Standards Hindering Battery-Less Sensors
- 4.3.4 Grey-Market LPWAN Modules Undermining Type-Approval Compliance
- 4.4 Value Chain Analysis
- 4.5 Regulatory Outlook
- 4.6 Technological Outlook
- 4.7 Porter's Five Forces
- 4.7.1 Bargaining Power of Suppliers
- 4.7.2 Bargaining Power of Buyers
- 4.7.3 Threat of New Entrants
- 4.7.4 Threat of Substitutes
- 4.7.5 Intensity of Competitive Rivalry
- 4.8 Technology Snapshot
- 4.8.1 Evolution of IoT
- 4.8.2 Disruptive Technologies Enabling Adoption
- 4.8.3 Major IoT Device Components
- 4.9 Investment Analysis
5 MARKET SIZE AND GROWTH FORECASTS (VALUE)
- 5.1 By Application
- 5.1.1 Connected and Smart Home
- 5.1.2 Medical IoT
- 5.1.3 Connected Car
- 5.1.4 Smart Cities
- 5.1.5 Industrial IoT
- 5.1.6 Personal IoT
- 5.1.7 Smart Agriculture
- 5.1.8 Other Applications
- 5.2 By Device Category
- 5.2.1 Smart Speakers and Displays
- 5.2.2 Wearables (Watches, Bands, Hearables)
- 5.2.3 Connected Consumer Appliances
- 5.2.4 Smart Energy and Utility Devices (Meters, Thermostats)
- 5.2.5 Industrial Sensors and Actuators
- 5.2.6 Connected Cameras and Security Devices
- 5.2.7 Micro-mobility Trackers
- 5.2.8 Self-powered Environmental Sensors
- 5.3 By Connectivity Technology
- 5.3.1 WPAN (Bluetooth, Zigbee, Z-Wave)
- 5.3.2 WLAN (Wi-Fi 4/5/6/6E/7)
- 5.3.3 LPWAN (NB-IoT, LTE-M, LoRa, Sigfox)
- 5.3.4 Cellular (4G, 5G, C-V2X)
- 5.3.5 Satellite IoT
- 5.3.6 Hybrid Multi-band Modules
- 5.4 By Power Source
- 5.4.1 Battery-powered
- 5.4.2 Energy-harvested
- 5.4.3 Mains-powered
- 5.5 By Geography
- 5.5.1 North America
- 5.5.1.1 United States
- 5.5.1.2 Canada
- 5.5.1.3 Mexico
- 5.5.2 South America
- 5.5.2.1 Brazil
- 5.5.2.2 Argentina
- 5.5.2.3 Rest of South America
- 5.5.3 Europe
- 5.5.3.1 Germany
- 5.5.3.2 United Kingdom
- 5.5.3.3 France
- 5.5.3.4 Italy
- 5.5.3.5 Rest of Europe
- 5.5.4 Asia Pacific
- 5.5.4.1 China
- 5.5.4.2 Japan
- 5.5.4.3 India
- 5.5.4.4 South Korea
- 5.5.4.5 Rest of Asia Pacific
- 5.5.5 Middle East
- 5.5.5.1 Saudi Arabia
- 5.5.5.2 United Arab Emirates
- 5.5.5.3 Rest of Middle East
- 5.5.6 Africa
- 5.5.6.1 South Africa
- 5.5.6.2 Nigeria
- 5.5.6.3 Rest of Africa
- 5.5.1 North America
6 COMPETITIVE LANDSCAPE
- 6.1 Market Concentration
- 6.2 Strategic Moves
- 6.3 Market Share Analysis
- 6.4 Company Profiles (includes Global level Overview, Market level overview, Core Segments, Financials as available, Strategic Information, Market Rank/Share for key companies, Products and Services, and Recent Developments)
- 6.4.1 Apple Inc.
- 6.4.2 Samsung Electronics Co. Ltd.
- 6.4.3 Amazon.com Inc.
- 6.4.4 Alphabet Inc. (Google)
- 6.4.5 Xiaomi Corp.
- 6.4.6 Cisco Systems Inc.
- 6.4.7 Huawei Technologies Co. Ltd.
- 6.4.8 Microsoft Corp.
- 6.4.9 Intel Corp.
- 6.4.10 Honeywell International Inc.
- 6.4.11 Siemens AG
- 6.4.12 LG Electronics Inc.
- 6.4.13 Sony Group Corp.
- 6.4.14 Robert Bosch GmbH
- 6.4.15 Schneider Electric SE
- 6.4.16 Signify N.V. (Philips)
- 6.4.17 Arm Ltd.
- 6.4.18 Qualcomm Inc.
- 6.4.19 NXP Semiconductors N.V.
- 6.4.20 Dell Technologies Inc.
- 6.4.21 Ericsson AB
- 6.4.22 Quectel Wireless Solutions Co. Ltd.
- 6.4.23 Telit Cinterion
- 6.4.24 Particle Industries Inc.
7 MARKET OPPORTUNITIES AND FUTURE OUTLOOK
- 7.1 White-space and Unmet-Need Assessment

 物聯網設備管理市場 - 全球市場預測(2026-2032年)
 ThinkTracker市場規模、佔有率和成長分析:按產品類型、連接方式、應用、最終用戶、部署模式和地區分類-2026-2033年產業預測
 員工培訓身分驗證:市場佔有率分析、產業趨勢與統計、成長預測(2026-2031)
 物聯網設備市場:按應用、連接方式和地區分類
 2026年全球植入式設備管理市場報告物聯網設備管理市場:按組件、部署模式、連接方式、應用程式和最終用戶產業分類-2026-2032年全球市場預測2026年全球物聯網閘道器設備市場報告2026年全球員工入職軟體市場報告
 物聯網設備管理市場:面向消費者、企業、工業和政府物聯網設備的配置、管理、監控、維護和分析(2026-2030)飯店自助入住/退房終端市場:按組件、服務類型、終端類型、整合程度、價格範圍、運作模式、部署類型、應用、最終用戶和組織規模分類-全球預測,2026-2032年