

 |
市場調查報告書
商品編碼
2044222
寶特瓶:市佔率分析、產業趨勢與統計、成長預測(2026-2031年)PET Bottles - Market Share Analysis, Industry Trends & Statistics, Growth Forecasts (2026 - 2031) |
||||||
※ 本網頁內容可能與最新版本有所差異。詳細情況請與我們聯繫。
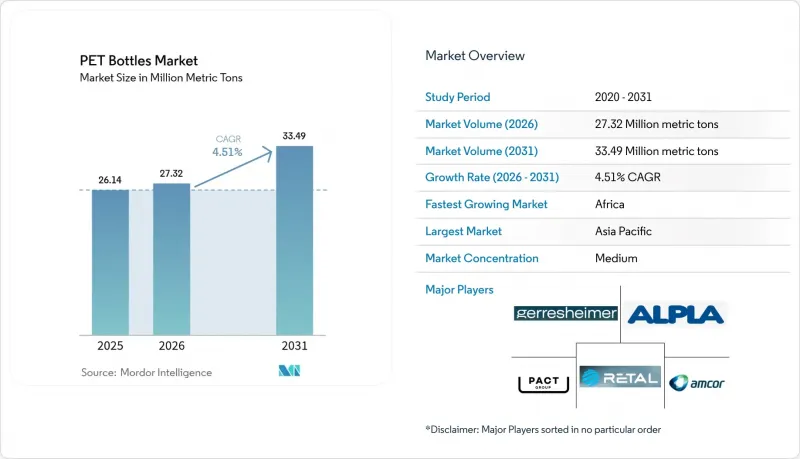
預計到 2025 年, 寶特瓶市場將達到 2,614 萬噸,到 2026 年將增加至 2,732 萬噸,到 2031 年將達到 3,349 萬噸,2026 年至 2031 年的複合年成長率為 4.51%。
需求趨勢反映了三個結構性因素。首先,品牌主導的輕量化設計既能減少溫室氣體排放,也能降低每次填充成本。其次,全部區域法規使得使用再生材料商業性必要。第三,數位水印技術提高了食品級rPET的產量,並確保了供應的標準化。儘管飲料業仍然是寶特瓶市場的主要驅動力,但隨著PET因其抗衝擊性、透明度和符合FDA法規等優點而取代玻璃,食品藥物管理局和個人護理行業預計將迎來顯著成長。在高階水和能量飲料市場,PET與鋁和玻璃的競爭日益激烈,但在大規模生產的瓶裝水和碳酸飲料市場,PET仍保持成本優勢。從區域來看,亞太地區擁有規模化供應和價格競爭力,北美和歐洲正在推動監管創新,而隨著都市化的推進和低溫運輸範圍的擴大,非洲正在崛起成為成長最快的需求中心。
全球寶特瓶市場趨勢與洞察
輕量化包裝的採用率不斷提高
設計革新已成為永久性解決方案,因為即使減輕一克重量也能減少樹脂用量、運輸排放和生產者延伸責任(EPR)成本。新型瓶坯形狀能更均勻分散應力,即使材料減少15%,瓶子仍能承受頂部負荷。設備供應商提供吹塑輔助演算法,可即時繪製壁厚圖,防止熱填充過程中瓶身崩壞。輕量化解決方案現在允許使用高達25%的rPET而不會產生霧狀,從而更容易滿足再生材料含量標準。隨著零售商實施與重量直接掛鉤的環保定價,輕量化已成為投資藍圖的核心支柱,因為加工商可以預期獲得即時的投資回報。因此,透過將永續性和成本降低整合到一項工作中, 寶特瓶市場正在加速在飲料、個人護理和家用清潔劑用品行業的應用。
全球瓶裝水消費量激增
隨著消費者將瓶裝水與健康、便利性和口味中性聯繫起來,瓶裝水的銷售量持續超越軟性飲料。在印度、中國和印度尼西亞,瓶裝水的銷售量實現了兩位數的成長,因為都市區家庭對自來水的品質缺乏信任,並尋求便於攜帶的瓶裝水以方便長途通勤。在美國,一次性寶特瓶仍佔據該品類約70%的佔有率,預計到2024年將增加164億加侖。中東地區的旅遊需求和乾旱氣候推動了全年需求的激增,刺激了產能擴張計畫。預計到2030年,非洲的都市化將超過60%,這將提高瓶裝水在基礎建設投資落後、無法提供安全自來水的地區的滲透率。雖然鋁製容器在高階氣泡水市場佔有率不斷上升,但由於PET在透明度、安全性和物流成本方面具有更優的平衡性,它仍然是大規模生產、低利潤率瓶裝水的主要容器選擇。
加強對一次性塑膠的環境監測
非政府組織正在加強宣傳活動,強調海洋垃圾與一次性容器之間的聯繫,敦促零售商試行建造灌裝站並整合包裝形式。雖然PET材質在加拿大2024年針對某些商品的禁令中被豁免,但這項豁免的前提是其回收率要高。歐洲的雜貨店正在貨架上添加“環保評分”,優先選擇可重複使用的包裝和高PCR(再生塑膠)含量的產品,並對落後的品牌進行處罰。在加州,針對違規行為的分級定價結構正在將收費壓力轉移到缺乏完善rPET(再生PET)供應鏈的加工商(製造商)。因此,公眾輿論正在影響採購、貨架空間甚至授權發放,使得永續性證明成為寶特瓶市場銷售的核心前提。
細分市場分析
預計到2025年,飲料將佔PET瓶需求的63.23%,鞏固在寶特瓶市場的核心地位。對超快速填充技術的持續投資,以及積極的減重措施和對繫繩式瓶蓋法規的遵守,正在增強PET在瓶裝水和碳酸飲料領域的成本和性能優勢。透明度和設計靈活性提升了品牌價值,而運輸過程中的低排放則促進了零售商的採用。在電子商務飲料銷售不斷成長的地區,PET的高裝載效率進一步增強了其物流優勢。儘管碳酸水產業對鋁的需求日益成長,但消費飲料的銷售量保持穩定,從而支撐了整個加工網路的整體工廠運轉率。
儘管製藥業的絕對噸位較小,但預計其成長速度將最快,到2031年複合年成長率將達到5.34%。注射用生物製藥、止咳糖漿和營養飲料正從玻璃瓶轉向PET瓶,以防止破損並減輕運輸重量。 Geresheimer公司符合FDA標準的低價值靜脈注射用rPET管瓶表明,即使是回收材料也能滿足嚴格的提取標準,從而進入高利潤領域。由於醫藥級rPET原料供應有限,供應仍受到限制,導致其價格與原生PET相比有兩位數的差異。然而,預計化學回收項目將在預測期內增加符合標準的樹脂供應,使寶特瓶市場能夠進一步滲透到醫療保健領域。
預計到2025年,拉伸吹塑成型將佔據寶特瓶市場78.12%的市佔率。這是因為射出成型瓶坯能夠實現大量的型腔,並達到每小時4萬瓶以上的產量,這對於水和碳酸飲料生產線至關重要。輕量化的努力主要集中在重新設計瓶坯,以在保持頂部承載強度的同時減輕重量,並可在不影響性能的前提下添加高達25%的再生PET(rPET)。透過將吹塑成型、貼標和填充整合到單一的整體式生產線中,原始設備製造商(OEM)正在減少因設備變更和工廠面積增加而導致的停機時間。
熱成型市場正以4.71%的複合年成長率快速成長。這是因為個人護理和食品品牌正在尋求具有卓越觸感壓紋和厚壁的寬口瓶,以提升其高階展示效果。此工藝可形成可容納大型不乾膠標籤和套模裝飾的平板,進一步增強品牌差異化。雖然熱成型的生產週期比拉伸吹塑成型慢,但新型伺服驅動分度器的出現正在縮小這一差距,使熱成型在中等產量化妝品和堅果醬的生產中具有商業性可行性。射出成型仍然是瓶坯供應的關鍵,但擠出吹塑成型正被應用於清潔劑和汽車潤滑油等領域,這些領域對阻隔性的要求較低,成本是主要考慮因素。這些技術的共存反映了寶特瓶市場規格的多樣性。
《寶特瓶市場報告》按終端用戶行業(飲料、食品等)、技術(拉伸吹塑成型、射出成型等)、瓶子容量(小於500毫升等)、樹脂類型(原生PET、再生PET)和地區進行細分。市場預測以數量(百萬噸)為單位。
區域分析
到2025年,亞太地區將佔全球總量的39.21%。這主要得益於中國出口導向加工企業的發展以及印度中產階級消費的激增。中國工廠以具有全球競爭力的成本履行與跨國飲料製造商的契約,同時,隨著都市區生活方式趨向即飲飲料,國內需求也在加速成長。印度的瓶裝水市場蓬勃發展,這得益於人們對食品安全的關注以及便利商店網路的擴張。此外,印度政府的塑膠廢棄物管理法規正逐步接近歐洲的回收率標準,從而刺激了對本地再生PET(rPET)的投資。日本嚴格的食品衛生法規推動了用於藥品和機能飲料的高階PET的需求。在韓國,押金制度的引入使回收率超過了85%。儘管對廢棄物包運輸的限制帶來了供應風險,但中國和日本不斷擴大的化學回收能力旨在緩解原料供應壓力,並穩定全部區域的寶特瓶市場。
預計2026年至2031年間,非洲將成為成長最快的地區,複合年成長率(CAGR)達5.12%。肯亞新建的PET工廠部分運作太陽能供電,涵蓋了從內羅畢到達累斯薩拉姆的走廊區域,並成為東非擴張的樞紐。南非的PETCO框架計畫在2024年將回收率提高到65%,從而實現國內rPET供應,並降低生產商受外匯波動的影響。在奈及利亞、加納和象牙海岸共和國,跨國飲料公司正在建造新的填充生產線,以滿足不斷成長的都市區消費需求。不穩定的電網和有限的低溫運輸基礎設施仍然是障礙,但模組化工廠設計和備用發電機正在減少運作。在中東,瓶裝水的需求全年都很強勁,沙烏地阿拉伯的「2030願景」正在鼓勵投資本地生產以替代進口。土耳其扮演橋樑樞紐的角色,利用有利的貿易協定和接近性石化工業區的地理優勢,向歐洲和海灣合作理事會(GCC)出口預成型件。
在北美和歐洲,監管變革正在進行,重塑價值鏈。德國98%的回收率是產業標桿,法國計畫中的押金制度也藉鏡了類似的機制。加州的SB 54法案對再生材料含量設定了分級最低標準,迫使加工商共同投資建造洗滌生產線並簽訂長期rPET合約。雖然PET不受加拿大一次性塑膠禁令的限制,但政策制定者已表示,如果回收率停滯不前,他們準備重新審視相關標準。在南美洲,趨勢則更為多元。巴西一體化的石化產業以具競爭力的價格供應原生PET,而宏觀經濟波動則抑制了阿根廷的資本投資。墨西哥正在崛起為近岸外包中心,在其加工出口區(maquiladoras)擴大瓶坯產能,以滿足美國飲料品牌對更低關稅和更短前置作業時間的需求。這些區域趨勢結合起來,形成了地理上分散的寶特瓶市場,在成熟的法規結構和高成長的新興經濟體之間取得了平衡。
其他好處:
- Excel格式的市場預測(ME)表
- 3個月的分析師支持
目錄
第1章:引言
- 研究假設和市場定義
- 調查範圍
第2章:調查方法
第3章執行摘要
第4章 市場狀況
- 市場概覽
- 市場促進因素
- 輕量化包裝的採用率不斷提高
- 全球瓶裝水消費量激增。
- 透過政策主導促進閉合迴路回收基礎建設
- 「HolyGrail 2.0」數位浮水印技術提高了食品級材料的分類率。
- 人工智慧驅動的熱填充阻隔添加劑在rPET高階飲料的應用
- 飲料灌裝廠現場瓶對瓶微型回收系統
- 市場限制因素
- 加強對一次性塑膠的環境監測
- 人們越來越傾向於選擇鋁和玻璃等替代品
- 符合FDA標準的低靜脈注射rPET(用於製藥瓶)供不應求
- 可回收包裝運輸的貨運限制正在減少rPET的供應。
- 產業價值/價值鏈分析
- 監理情勢
- 技術展望
- 波特五力分析
- 供應商的議價能力
- 買方的議價能力
- 新進入者的威脅
- 替代品的威脅
- 競爭公司之間的競爭
- 價格分析
- 宏觀經濟因素對市場的影響
- 評估地緣政治趨勢對產業的影響
第5章 市場規模與成長預測
- 最終用戶
- 飲料
- 瓶裝水
- 碳酸飲料
- 果汁
- 能量飲料
- 其他飲料
- 食物
- 個人護理
- 居家照護
- 製藥
- 其他最終用戶字段
- 飲料
- 透過技術
- 拉伸吹塑成型
- 射出成型
- 擠出吹塑成型
- 熱成型
- 按瓶子容量
- 少於500毫升
- 501 mL-1 L
- 1.01 L-2 L
- 2升或更多
- 依樹脂類型
- 處女寵物
- 再生PET(rPET)
- 按地區
- 北美洲
- 美國
- 加拿大
- 墨西哥
- 南美洲
- 巴西
- 阿根廷
- 南美洲其他地區
- 歐洲
- 英國
- 德國
- 法國
- 西班牙
- 義大利
- 其他歐洲地區
- 亞太地區
- 中國
- 印度
- 日本
- 澳洲
- 韓國
- 亞太其他地區
- 中東
- 沙烏地阿拉伯
- 阿拉伯聯合大公國
- 土耳其
- 其他中東國家
- 非洲
- 南非
- 肯亞
- 其他非洲地區
- 北美洲
第6章 競爭情勢
- 市場集中度
- 策略趨勢
- 市佔率分析
- 公司簡介
- Amcor plc
- ALPLA Werke Alwin Lehner GmbH & Co KG
- Gerresheimer AG
- PACT Group Holdings Ltd.
- Retal Industries Ltd.
- Resilux NV
- Greiner Packaging International GmbH
- Plastipak Holdings Inc.
- Graham Packaging Company LP
- Alpha Packaging LLC
- Manjushree Technopack Ltd.
- Silgan Plastics LLC(Silgan Holdings Inc.)
- Nampak Ltd.
- Altium Packaging LLC
- Apex Plastics(Plastic Industries, Inc.)
- Zhejiang Xinlei Packaging Co., Ltd.
- Shenzhen Zhenghao Plastic & Mold Co., Ltd.
- Comar LLC
- Container Corp. of Canada Ltd.
- Berry Global Group Inc.
第7章 市場機會與未來展望
The pet bottles market size reached 26.14 million metric tons in 2025, is expected to increase to 27.32 million metric tons in 2026 and reach 33.49 million metric tons by 2031, growing at a CAGR of 4.51% from 2026 to 2031.
Demand progression reflects three structural forces: first, brand-led lightweighting that lowers cost per fill while cutting greenhouse-gas emissions, second, region-wide mandates that make recycled content commercially indispensable, and third, digital watermarking that lifts food-grade rPET yield and secures compliant supply. Beverage lines remain the backbone of the pet bottles market, yet pharmaceuticals and personal care deliver outsized growth because shatter resistance, clarity, and FDA compliance help PET displace glass. Competitive tension from aluminum and glass is gathering pace in premium water and energy drinks, still PET keeps its cost advantage in high-volume packaged water and carbonated soft drinks. Geographically, Asia-Pacific supplies scale and price competitiveness, North America and Europe anchor regulatory innovation, and Africa emerges as the fastest-growing demand center as urbanization broadens cold-chain access.
Global PET Bottles Market Trends and Insights
Increasing Adoption of Lightweight Packaging
Design revision has become a permanent lever because every gram eliminated reduces resin input, freight emissions, and extended producer responsibility fees. New preform geometries distribute stress uniformly, letting bottles withstand top-load forces even after a 15% material cut. Equipment suppliers offer blow-assist algorithms that map wall thickness in real time, preventing panel collapse during hot-fill. Lightweight solutions now incorporate up to 25% rPET without hazing, easing compliance with recycled-content quotas. As retailers introduce eco-modulated fees tied directly to weight, converters see immediate payback, making lightweighting a core pillar of investment road maps. The pet bottles market therefore embeds sustainability and cost savings in a single initiative, accelerating adoption across beverages, personal care, and household cleaners.
Surging Bottled Water Consumption Worldwide
Packaged hydration continues to outpace soft drinks as consumers associate bottled water with wellness, convenience, and flavor neutrality. India, China, and Indonesia are logging double-digit unit growth because urban households distrust tap quality and seek portable formats during lengthy commutes. The United States added 16.4 billion gallons in 2024, keeping single-serve PET at roughly 70% of category volume. Middle East tourism and an arid climate produce year-round demand spikes that reinforce capacity expansion plans. Africa's rising urbanization rate is expected to exceed 60% by 2030, amplifying packaged water penetration where safe municipal supply lags infrastructure investment. Although aluminum alternatives win share in boutique sparkling segments, PET remains the vessel of choice for bulk, low-margin water because it balances clarity, safety, and logistical economy.
Escalating Environmental Scrutiny of Single-Use Plastics
Non-governmental organizations intensify campaigns that link marine debris to single-use containers, motivating retailers to test refill stations and concentrate formats. Canada's 2024 ban on certain items excluded PET, yet the exemption is contingent on proven high recycling performance. European grocers add on-shelf eco-scores that favor reusable or high-PCR packages, nudging laggard brands into penalty zones. California's framework assigns escalating fees for non-compliance, transferring margin pressure to converters without robust rPET pipelines. Public perception therefore shapes procurement, shelf space, and even licensing, making sustainability credentials a core sales prerequisite within the pet bottles market.
Other drivers and restraints analyzed in the detailed report include:
- Policy-Led Push for Closed-Loop Recycling Infrastructure
- HolyGrail 2.0 Digital Watermarking Boosting Food-Grade Sorting Yield
- Gowing Preference for Aluminum and Glass Substitutes
For complete list of drivers and restraints, kindly check the Table Of Contents.
Segment Analysis
Beverages supplied 63.23% of 2025 demand, affirming their anchor status for the pet bottles market. Continuous investment in ultra-high-speed filling, coupled with aggressive lightweighting and tethered-closure compliance, fortifies PET's cost and performance edge in packaged water and carbonated soft drinks. Transparency and design freedom support brand equity, and lower transport emissions reinforce retailer acceptance. In regions where e-commerce beverages expand, PET's high stacking efficiency further solidifies its logistical advantage. Despite rising aluminum interest in sparkling water, mass-market beverages preserve volume stability, sustaining baseline plant utilization across converter networks.
Pharmaceuticals, although smaller in absolute tonnage, clock the fastest growth at a 5.34% CAGR to 2031. Injectable biologics, cough syrups, and nutraceutical beverages transition from glass to PET for shatter safety and lower shipping weight. Gerresheimer's FDA-compliant low-IV rPET vials demonstrate that recycled material can meet stringent extractables limits, unlocking premium margin segments. Supply remains constrained by limited pharmaceutical-grade rPET feedstock, pushing price spreads over virgin PET into double digits. However, chemical recycling projects promise increased availability of compliant resin during the forecast window, allowing the pet bottles market to deepen penetration within health care.
Stretch blow molding held 78.12% share of the 2025 pet bottles market size because injection-molded preforms enable high cavity counts and 40 000-plus bottle per hour outputs, critical for water and soda lines. Lightweighting advances focus on preform redesign that maintains top-load strength while curbing gram weight, integrating up to 25% rPET without performance loss. OEMs bundle blow, label, and fill into single monoblocs that reduce changeover downtime and factory footprint.
Thermoforming advances at 4.71% CAGR thanks to personal care and food brands pursuing wide-mouth jars with tactile embossing and thick walls for premium shelf appeal. The process shapes flat panels that accommodate large adhesive labels or in-mold decoration, enhancing brand differentiation. Although cycle times lag stretch blow molding, new servo-driven indexers narrow the gap, making thermoforming commercially viable for mid-volume cosmetics and nut-butter runs. Injection molding remains indispensable for preform supply, while extrusion blow molding serves detergents and automotive fluids where barrier needs are modest and cost sensitivity is paramount. The coexistence of technologies mirrors the diverse specification landscape of the pet bottles market.
The PET Bottles Market Report is Segmented by End-User Vertical (Beverages, Food, and More), Technology (Stretch Blow Molding, Injection Molding, and More), Bottle Capacity (Less Than 500 ML and More), Resin Type (Virgin PET, and Recycled PET), and Geography. The Market Forecasts are Provided in Terms of Volume (Million Metric Tons).
Geography Analysis
Asia-Pacific accounted for 39.21% of global volume in 2025, driven by China's export-oriented converters and India's middle-class consumption surge. Chinese plants serve multinational beverage contracts at globally competitive cost, and domestic demand accelerates as urban lifestyles favor ready-to-drink formats. India's packaged water boom rides on safety concerns and expanding convenience-store networks, while government plastic-waste rules begin to mirror European recycled-content thresholds, stimulating local rPET investment. Japan's rigorous Food Sanitation Act supports premium PET for pharma and functional drinks, and South Korea posts collection rates above 85% due to deposit incentives. Freight restrictions on waste bales pose supply risks, yet rising chemical recycling capacity in China and Japan aims to relieve feedstock pressure and stabilize the pet bottles market across the region.
Africa is forecast to be the fastest-growing territory at a 5.12% CAGR from 2026 to 2031. Kenya's new PET plant, powered partly by solar, anchors East African expansion, serving a corridor from Nairobi to Dar es Salaam. South Africa's PETCO framework raised collection to 65% in 2024, enabling domestic rPET supply that insulates producers from foreign exchange swings. Nigeria, Ghana, and Cote d'Ivoire attract beverage multinationals establishing greenfield filling lines to meet rising urban consumption. Inconsistent electricity grids and limited cold-chain infrastructure remain hurdles, yet modular plant designs and backup generators mitigate downtime. The Middle East sustains year-round bottled water demand, with Saudi Arabia's Vision 2030 channeling investment into local manufacturing to displace imports. Turkey functions as a bridge hub, exporting preforms to both Europe and the Gulf Cooperation Council, benefiting from favorable trade agreements and petrochemical proximity.
North America and Europe navigate regulatory transitions that redefine value chains. Germany's 98% collection sets the benchmark, and France's upcoming deposit scheme is modeled on identical architecture. California's SB 54 imposes graduated recycled-content floors, compelling converters to co-invest in wash lines or secure long-term rPET contracts. Canada's single-use plastics ban exempts PET, yet policymakers signal willingness to revisit criteria if recovery rates stall. South America shows divergent momentum: Brazil's integrated petrochemical sector supplies virgin PET competitively, while Argentina's macroeconomic volatility dampens capital spending. Mexico emerges as a nearshoring hub, expanding maquiladora preform capacity to serve U.S. beverage brands seeking tariff relief and shorter lead times. Collectively, these regional dynamics ensure the pet bottles market remains geographically diversified, balancing mature regulatory frameworks with high-growth emerging economies.
- Amcor plc
- ALPLA Werke Alwin Lehner GmbH & Co KG
- Gerresheimer AG
- PACT Group Holdings Ltd.
- Retal Industries Ltd.
- Resilux NV
- Greiner Packaging International GmbH
- Plastipak Holdings Inc.
- Graham Packaging Company LP
- Alpha Packaging LLC
- Manjushree Technopack Ltd.
- Silgan Plastics LLC (Silgan Holdings Inc.)
- Nampak Ltd.
- Altium Packaging LLC
- Apex Plastics (Plastic Industries, Inc.)
- Zhejiang Xinlei Packaging Co., Ltd.
- Shenzhen Zhenghao Plastic & Mold Co., Ltd.
- Comar LLC
- Container Corp. of Canada Ltd.
- Berry Global Group Inc.
Additional Benefits:
- The market estimate (ME) sheet in Excel format
- 3 months of analyst support
TABLE OF CONTENTS
1 INTRODUCTION
- 1.1 Study Assumptions and Market Definition
- 1.2 Scope of the Study
2 RESEARCH METHODOLOGY
3 EXECUTIVE SUMMARY
4 MARKET LANDSCAPE
- 4.1 Market Overview
- 4.2 Market Drivers
- 4.2.1 Increasing Adoption of Lightweight Packaging
- 4.2.2 Surging Bottled Water Consumption Worldwide
- 4.2.3 Policy-Led Push for Closed-Loop Recycling Infrastructure
- 4.2.4 HolyGrail 2.0 Digital Watermarking Boosting Food-Grade Sorting Yield
- 4.2.5 Deployment of AI-Driven Hot-Fill Barrier Additives for rPET Premium Drinks
- 4.2.6 Onsite Bottle-to-Bottle Micro Recycling Units at Beverage Filling Plants
- 4.3 Market Restraints
- 4.3.1 Escalating Environmental Scrutiny of Single-Use Plastics
- 4.3.2 Growing Preference for Aluminum and Glass Substitutes
- 4.3.3 Shortage of FDA-Compliant Low-IV rPET for Pharmaceutical Bottles
- 4.3.4 Freight Restrictions on Returnable Bale Flows Reducing rPET Supply
- 4.4 Industry Value / Supply-Chain Analysis
- 4.5 Regulatory Landscape
- 4.6 Technological Outlook
- 4.7 Porter's Five Forces Analysis
- 4.7.1 Bargaining Power of Suppliers
- 4.7.2 Bargaining Power of Buyers
- 4.7.3 Threat of New Entrants
- 4.7.4 Threat of Substitutes
- 4.7.5 Intensity of Competitive Rivalry
- 4.8 Pricing Analysis
- 4.9 Impact of Macroeconomic Factors on the Market
- 4.10 Assessment of the Impact of Geopolitical Developments on the Industry
5 MARKET SIZE AND GROWTH FORECASTS (VOLUME)
- 5.1 By End-user Vertical
- 5.1.1 Beverages
- 5.1.1.1 Packaged Water
- 5.1.1.2 Carbonated Soft Drinks
- 5.1.1.3 Fruit Juice
- 5.1.1.4 Energy Drinks
- 5.1.1.5 Other Beverages
- 5.1.2 Food
- 5.1.3 Personal Care
- 5.1.4 Household Care
- 5.1.5 Pharmaceuticals
- 5.1.6 Other End-user Verticals
- 5.1.1 Beverages
- 5.2 By Technology
- 5.2.1 Stretch Blow Molding
- 5.2.2 Injection Molding
- 5.2.3 Extrusion Blow Molding
- 5.2.4 Thermoforming
- 5.3 By Bottle Capacity
- 5.3.1 Less than 500 mL
- 5.3.2 501 mL - 1 L
- 5.3.3 1.01 L - 2 L
- 5.3.4 More than 2 L
- 5.4 By Resin Type
- 5.4.1 Virgin PET
- 5.4.2 Recycled PET (rPET)
- 5.5 By Geography
- 5.5.1 North America
- 5.5.1.1 United States
- 5.5.1.2 Canada
- 5.5.1.3 Mexico
- 5.5.2 South America
- 5.5.2.1 Brazil
- 5.5.2.2 Argentina
- 5.5.2.3 Rest of South America
- 5.5.3 Europe
- 5.5.3.1 United Kingdom
- 5.5.3.2 Germany
- 5.5.3.3 France
- 5.5.3.4 Spain
- 5.5.3.5 Italy
- 5.5.3.6 Rest of Europe
- 5.5.4 Asia-Pacific
- 5.5.4.1 China
- 5.5.4.2 India
- 5.5.4.3 Japan
- 5.5.4.4 Australia
- 5.5.4.5 South Korea
- 5.5.4.6 Rest of Asia-Pacific
- 5.5.5 Middle East
- 5.5.5.1 Saudi Arabia
- 5.5.5.2 United Arab Emirates
- 5.5.5.3 Turkey
- 5.5.5.4 Rest of Middle East
- 5.5.6 Africa
- 5.5.6.1 South Africa
- 5.5.6.2 Kenya
- 5.5.6.3 Rest of Africa
- 5.5.1 North America
6 COMPETITIVE LANDSCAPE
- 6.1 Market Concentration
- 6.2 Strategic Moves
- 6.3 Market Share Analysis
- 6.4 Company Profiles (includes Global Level Overview, Market Level Overview, Core Segments, Financials as available, Strategic Information, Market Rank/Share, Products and Services, Recent Developments)
- 6.4.1 Amcor plc
- 6.4.2 ALPLA Werke Alwin Lehner GmbH & Co KG
- 6.4.3 Gerresheimer AG
- 6.4.4 PACT Group Holdings Ltd.
- 6.4.5 Retal Industries Ltd.
- 6.4.6 Resilux NV
- 6.4.7 Greiner Packaging International GmbH
- 6.4.8 Plastipak Holdings Inc.
- 6.4.9 Graham Packaging Company LP
- 6.4.10 Alpha Packaging LLC
- 6.4.11 Manjushree Technopack Ltd.
- 6.4.12 Silgan Plastics LLC (Silgan Holdings Inc.)
- 6.4.13 Nampak Ltd.
- 6.4.14 Altium Packaging LLC
- 6.4.15 Apex Plastics (Plastic Industries, Inc.)
- 6.4.16 Zhejiang Xinlei Packaging Co., Ltd.
- 6.4.17 Shenzhen Zhenghao Plastic & Mold Co., Ltd.
- 6.4.18 Comar LLC
- 6.4.19 Container Corp. of Canada Ltd.
- 6.4.20 Berry Global Group Inc.
7 MARKET OPPORTUNITIES AND FUTURE OUTLOOK
- 7.1 White-space and Unmet-need Assessment
 寶特瓶市場:2026-2032年全球市場預測(依瓶型、產能、製造流程、終端用戶產業及通路分類)
 寶特瓶市場報告:按產能、通路、顏色、技術、應用和地區分類(2026-2034年)寶特瓶無菌灌裝線市場:依技術類型、產能、滅菌方式、應用、最終用戶分類,全球預測(2026-2032年)
 全球寶特瓶市場規模、佔有率、趨勢和成長分析報告(2026-2034年)
 多層寶特瓶:全球市佔率及排名、總收入及需求預測(2025-2031年)
 PET 瓶市場機會、成長動力、產業趨勢分析及 2025 - 2034 年預測
 無菌寶特瓶填充線市場報告:趨勢、預測與競爭分析(至2031年)
 寶特瓶市場:按容量類型、顏色類型、應用和地區分類
 寶特瓶全球市場(2024-2028)
 全球寶特瓶市場