


 |
市場調查報告書
商品編碼
2044175
超融合融合式基礎架構:市場佔有率分析、產業趨勢與統計、成長預測(2026-2031)Hyper-Converged Infrastructure - Market Share Analysis, Industry Trends & Statistics, Growth Forecasts (2026 - 2031) |
||||||
※ 本網頁內容可能與最新版本有所差異。詳細情況請與我們聯繫。
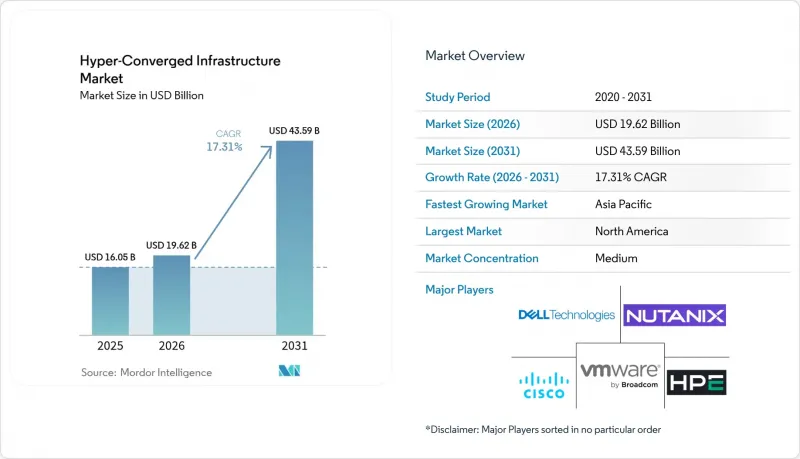
預計超融合融合式基礎架構市場將從 2025 年的 160.5 億美元成長到 2026 年的 196.2 億美元,到 2031 年達到 435.9 億美元,2026 年至 2031 年的複合年成長率為 17.31%。
博通公司決定在2024年逐步淘汰VMware永久許可證,這項舉措在20年後徹底改變了虛擬化的經濟格局,引發了自x86伺服器整合以來最大規模的平台遷移浪潮,促使企業負責人加快了更新換代週期。政府主導的人工智慧應用指令、零售業的邊緣部署以及RISC-V設備的興起,都讓Nutanix、微軟Azure Stack HCI和Scale Computing等公司佔據了優勢,因為新參與企業的競爭不再僅僅集中在硬體規模上,而是更多地依賴開放原始碼的柔軟性。買家將軟體定義儲存、Kubernetes編配以及NVMe的效能密度視為決定性的差異化因素,尤其是在電價和電網延遲限制電力預算的情況下。所有這些因素共同作用,使得敏捷型供應商能夠擴大市場佔有率,而現有的三級供應商則會萎縮,轉而守住對價格敏感的細分市場。
全球超融合融合式基礎架構市場趨勢及洞察
資料中心整合浪潮
金融服務、醫療保健和政府機構正在將其分散式三層架構整合為整合節點,從而節省占地面積並顯著降低冷卻成本。據 Nutanix 稱,85% 的 VMware 客戶在考慮替代方案時提到了鎖定風險和價格不可預測性,其中 48% 的客戶計劃在 2024 年開始概念驗證(PoC)。摩根大通已於 2025 年前將其 1200 個分店遷移到 Azure Stack HCI,每年節省 1,800 萬美元的維護成本。梅奧診所將其電子健康記錄遷移到 Nutanix 後,在 15 個園區實現了 99.99% 的運轉率,並將災害復原硬體減少了 60%。受監管行業的更新周期通常為三到五年,因此一旦遷移開始,超融合融合式基礎架構市場將擁有長期發展前景。
雲端原生工作負載的採用率正在激增。
容器化應用程式已佔企業新增工作負載的 90%,98% 的企業正在以混合模式執行 Kubernetes。戴爾的 VxRail 8.0 整合了 Red Hat OpenShift,無需外部陣列即可為有狀態容器提供持久儲存。微軟已將 Azure Arc管治擴展到 Azure Stack HCI,讓管理員能夠跨數千個邊緣叢集應用統一策略。多叢集生命週期管理帶來的維運負擔使得承包節點更具吸引力,尤其是在 85% 的 GenAI 試點企業尋求以近乎零延遲的本地 LLM 推理來存取向量資料庫的情況下。因此,超融合融合式基礎架構市場正成為雲端原生工作負載的預設基礎,這些工作負載由於資料主權或效能限制而無法部署在公有區域。
高階工作負載中節點級可擴展性的局限性
大多數超融合平台將叢集限制在 64 台主機以內,每台主機最多 200 個虛擬機,因此限制了它們在人工智慧訓練、高效能運算或多Petabyte級資料庫的適用性。 VMware vSAN、Dell VxRail 和 Nutanix 也為了保持元資料一致性而施加了類似的限制。因此,克利夫蘭診所為其 8 Petabyte電子病歷 (EHR) 環境選擇了組合式基礎架構基礎設施。 NVIDIA DGX 級叢集在數百個 GPU 的全歸約運算方面仍然具有優勢,而且在支援 CXL 的記憶體架構成熟之前,融合式基礎架構基礎設施在高階市場的佔有率可能仍然有限。
細分市場分析
預計到 2025 年,硬體將佔超融合融合式基礎架構市場的 58.84%,而軟體領域預計到 2031 年將以 18.21% 的複合年成長率成長。與 Nutanix 的「GPT-in-a-Box II」和微軟的「Azure Arc」的整合,體現了市場對能夠將工作負載與專有虛擬機器管理程式解耦的承包編配堆疊的需求。容器儲存介面 (CSI) 的採用正在加速從以陣列為中心的設計向軟體的轉變,使開發人員能夠將儲存視為程式碼。
儘管硬體對於採用多年折舊免稅額計畫的現有部署仍然至關重要,但設備銷售構成比正逐漸轉向以軟體訂閱為主的循環模式。服務正在填補這一空白。遷移工具、人工智慧模型最佳化和合規性審計等服務價格較高,在不增加資本預算的情況下提高了平均交易額。隨著買家尋求在本地環境中實現類似雲端的柔軟性,與軟體訂閱相關的超融合融合式基礎架構市場將繼續以超過整體市場成長率的速度擴張。
到2025年,專業服務將佔總收入的64.98%。然而,託管服務以17.88%的複合年成長率成長,顯示中小企業越來越傾向於計量收費的營運模式。這一趨勢凸顯了市場對能夠滿足中小企業營運需求的靈活可擴展解決方案的日益成長的需求。 HPE的GreenLake在2024會計年度第四季實現了16億美元的卓越銷售額,其中超融合節點佔比高達35%。這項業績反映了隨著企業最佳化其IT環境,超融合融合式基礎架構解決方案的採用率正在不斷提高。
託管服務供應商提供一系列服務,包括修補程式管理、容量遙測和災害復原,定價從每個節點每月 500 美元到 2000 美元不等。這種方法將不可預測的資本支出 (CAPEX) 轉化為穩定的營運支出 (OPEX),從而幫助企業提高財務的可預測性和可管理性。擁有 260 個分店的 Royal Farms 成功取消了對現場技術人員的需求,每年節省成本 180 萬美元。此案例研究清楚地展示了託管服務對於分散式營運企業的成本節約潛力。隨著遠端管理 API 的成熟,超融合融合式基礎架構(HCX) 領域的關注點正在轉變。該行業正從僅依賴一次性設備銷售的毛利轉向持續穩定的收入,這一轉變顯著提升了供應商的估值倍數。這種轉變不僅提高了供應商收入的穩定性,也符合客戶尋求長期價值和支援的不斷變化的需求。
區域分析
到2025年,北美將佔全球整體收入的39.93%。這主要得益於美國聯邦政府的零信任政策以及超超大規模資料中心業者中心(例如Verizon營運的1000個低延遲站點)的建設。這些政策和資料中心的建設顯著提升了北美在融合式基礎架構市場的領先地位。同時,加拿大嚴格的資料管治法律迫使銀行和醫院在本地管理工作負載,儘管這些工作負載是在雲端原生治理框架下運作的。在這種法規環境下,儘管借貸成本不斷上升,但各組織仍將合規性和營運效率放在首位,因此對超融合融合式基礎架構解決方案的需求依然強勁。
亞太地區正處於上升趨勢,年複合成長率高達18.69%。這項成長主要得益於中國致力於發展本土虛擬化技術堆疊、印度大力推動核心通訊網路現代化以及日本透過私有5G網路實現工廠自動化。尤其值得一提的是,華為的「FusionCube」在中國國家級專案中處於領先地位,彰顯了該公司的市場主導地位。同樣,印度Reliance Jio在1萬座通訊塔部署Nutanix系統,也體現了印度對擴展通訊基礎設施的重視。此外,豐田在組裝廠部署富士通的PRIMEFLEX系統,凸顯了日本致力於利用先進技術實現工業自動化。該地區多元化的多廠商環境不僅加速了創新,也提高了廠商轉換的門檻,從而創造了競爭激烈且充滿活力的市場環境。
在歐洲,包括法蘭克福、倫敦、阿姆斯特丹、巴黎和都柏林在內的FLAP-D大都會圈面臨長達7-10年的電網等待期。這項挑戰促使買家轉向更節能的ARM和RISC-V節點,並促進資料中心託管合作,以緩解能源緊張。德國憑藉其強大的汽車人工智慧舉措,佔該地區支出的28%,展現了其在先進技術應用方面的領先地位。同時,法國正利用核能基本負載電力吸引自主雲工作負載,鞏固在市場中的重要地位。北歐地區憑藉其在水力發電和余熱利用方面的努力,吸引了超大規模企業的關注,但不斷飆升的成本仍然使該地區超融合融合式基礎架構市場的複合年成長率下降了0.7%。這些因素共同塑造了歐洲市場的動態,為相關人員帶來了機會和挑戰。
其他好處:
- Excel格式的市場預測(ME)表
- 3個月的分析師支持
目錄
第1章:引言
- 研究假設和市場定義
- 調查範圍
第2章:調查方法
第3章執行摘要
第4章 市場狀況
- 市場概覽
- 市場促進因素
- 資料中心整合浪潮
- 雲端原生工作負載的採用率正在激增。
- 與傳統的三層架構相比,總擁有成本降低
- 電信和零售業對邊緣運算的採用。
- 基於 RISC-V 和 ARM 的超融合基礎架構設備
- 新興非洲市場對模組化資料中心的需求
- 市場限制因素
- 高階工作負載中每個節點可擴展性的局限性
- 企業買家對供應商鎖定問題的擔憂
- 與客製化ASIC相關的供應鏈風險
- 歐洲資料中心電力成本飆升
- 產業價值鏈分析
- 監理情勢
- 技術展望
- 波特五力分析
- 買方的議價能力
- 供應商的議價能力
- 新進入者的威脅
- 替代品的威脅
- 競爭公司之間的競爭
第5章 市場規模與成長預測
- 按組件
- 硬體
- 軟體
- 服務
- 按服務
- 專家
- 管理
- 按組織規模
- 大公司
- 小型企業
- 按最終用戶行業分類
- 資訊科技/通訊
- BFSI
- 衛生保健
- 零售
- 政府/國防
- 其他終端用戶產業
- 按地區
- 北美洲
- 美國
- 加拿大
- 墨西哥
- 南美洲
- 巴西
- 阿根廷
- 南美洲其他地區
- 歐洲
- 德國
- 英國
- 法國
- 義大利
- 西班牙
- 其他歐洲地區
- 亞太地區
- 中國
- 印度
- 日本
- 韓國
- 澳洲和紐西蘭
- 亞太其他地區
- 中東
- 沙烏地阿拉伯
- 阿拉伯聯合大公國
- 土耳其
- 其他中東國家
- 非洲
- 南非
- 奈及利亞
- 埃及
- 其他非洲地區
- 北美洲
第6章 競爭情勢
- 市場集中度
- 策略趨勢
- 市佔率分析
- 公司簡介
- Nutanix Inc.
- Dell Technologies Inc.
- VMware Inc.
- Hewlett Packard Enterprise Development LP
- Cisco Systems Inc.
- Microsoft Corporation
- Huawei Technologies Co. Ltd.
- IBM Corporation
- NetApp Inc.
- Lenovo Group Limited
- Fujitsu Limited
- Hitachi Vantara LLC
- NEC Corporation
- Super Micro Computer Inc.
- Scale Computing Inc.
- StarWind Software Inc.
- DataCore Software Corporation
- Maxta Inc.
- Pivot3 Inc.
- Sangfor Technologies Inc.
第7章 市場機會與未來展望
The hyper-converged infrastructure market size is expected to increase from USD 16.05 billion in 2025 to USD 19.62 billion in 2026 and reach USD 43.59 billion by 2031, growing at a CAGR of 17.31% over 2026-2031.
Enterprise buyers are accelerating refresh cycles because Broadcom's 2024 decision to retire VMware perpetual licenses upended twenty years of virtualization economics and triggered the largest platform-migration wave since x86 server consolidation began. Sovereign-AI mandates, retail edge roll-outs, and the arrival of RISC-V appliances have drawn new entrants that compete on open-source flexibility rather than raw hardware scale, tilting advantage toward Nutanix, Microsoft Azure Stack HCI, and Scale Computing. Buyers view software-defined storage, Kubernetes-native orchestration, and NVMe performance density as decisive differentiators, especially where electricity prices or grid queues cap power budgets. Taken together, these conditions position agile vendors to enlarge share while incumbent three-tier suppliers defend shrinking, price-sensitive niches.
Global Hyper-Converged Infrastructure Market Trends and Insights
Data-center Consolidation Wave
Financial-services, healthcare, and government agencies are collapsing scattered three-tier stacks into converged nodes to reclaim floor space and slash cooling overhead. Nutanix disclosed that 85% of VMware customers assessing alternatives cited lock-in risk and unpredictable pricing, prompting 48% to launch proofs of concept during 2024. JPMorgan Chase migrated 1,200 branches to Azure Stack HCI in 2025, cutting annual maintenance by USD 18 million. Mayo Clinic achieved 99.99% uptime across 15 campuses after shifting electronic health records to Nutanix, reducing disaster-recovery hardware 60%. Because refresh windows in regulated industries run three to five years, the hyper-converged infrastructure market enjoys durable visibility once conversions begin.
Surging Cloud-native Workload Adoption
Containerised applications already represent 90% of new enterprise workloads, with 98% of organizations running Kubernetes in hybrid mode. Dell's VxRail 8.0 embeds Red Hat OpenShift, enabling persistent storage for stateful containers without external arrays. Microsoft extended Azure Arc governance to Azure Stack HCI, letting administrators impose uniform policy across thousands of edge clusters. The operational burden of multicluster lifecycle management makes turnkey nodes attractive, especially where 85% of enterprises piloting GenAI demand on-prem LLM inference with near-zero latency to vector databases. Consequently, the hyper-converged infrastructure market is becoming the default substrate for cloud-native workloads that cannot reside in public regions because of data-sovereignty or performance constraints.
Per-node Scalability Ceiling for High-end Workloads
Most hyper-converged platforms cap clusters at 64 hosts and 200 VMs per host, limiting suitability for AI training, HPC, or multi-petabyte databases. VMware vSAN, Dell VxRail, and Nutanix enforce similar boundaries to maintain metadata consistency. Cleveland Clinic therefore selected composable infrastructure for its 8-petabyte EHR footprint. All-reduce operations across hundreds of GPUs still favour NVIDIA DGX-class clusters, curbing high-end share for the hyper-converged infrastructure market until CXL-enabled memory fabrics mature.
Other drivers and restraints analyzed in the detailed report include:
- Lower TCO Versus Legacy Three-tier Architecture
- Edge Computing Roll-outs in Telco and Retail
- Vendor Lock-in Concerns for Enterprise Buyers
For complete list of drivers and restraints, kindly check the Table Of Contents.
Segment Analysis
The software category is expanding at an 18.21% CAGR through 2031, even though hardware still held 58.84% of the hyper-converged infrastructure market share in 2025. Nutanix's GPT-in-a-Box II and Microsoft's Azure Arc integration exemplify demand for turnkey orchestration stacks that decouple workloads from proprietary hypervisors. Container Storage Interface adoption lets developers treat storage as code, accelerating software substitution for array-centric designs.
Hardware remains essential for latent installed bases executing multi-year depreciation schedules, yet appliance revenue is gradually ceding mix toward recurring software subscriptions. Services bridge the gap; migration tooling, AI model optimization, and compliance audits command premium rates that elevate average deal value without inflating capital budgets. As buyers pursue cloud-like flexibility on-prem, the hyper-converged infrastructure market size attached to software subscriptions will continue compounding above overall growth.
In 2025, professional services accounted for 64.98% of total revenue. However, managed services are on the rise, boasting a 17.88% CAGR, underscoring the growing preference of SMBs for pay-as-you-go operations. This trend highlights the increasing demand for flexible and scalable solutions that align with the operational needs of small and medium-sized businesses. HPE's GreenLake achieved a notable USD 1.6 billion in revenue for Q4 FY2024, with hyper-converged nodes contributing to 35% of this figure. This performance reflects the growing adoption of hyper-converged infrastructure solutions as businesses seek to optimize their IT environments.
Managed-service providers offer a suite of services, including patching, capacity telemetry, and disaster recovery, charging between USD 500 to 2,000 monthly per node. This approach transforms unpredictable capital expenditures into consistent operational expenses, providing businesses with greater financial predictability and control. Royal Farms, with its deployment across 260 stores, successfully eliminated the need for on-site technicians, resulting in annual savings of USD 1.8 million. This case study exemplifies the cost-saving potential of managed services for enterprises with distributed operations. With the maturation of remote management APIs, the hyper-converged infrastructure sector is shifting its focus. Instead of relying solely on one-time appliance gross margins, the industry is now leaning towards annuity revenue, a move that significantly boosts vendor valuation multiples. This transition not only enhances revenue stability for vendors but also aligns with the evolving needs of customers seeking long-term value and support.
The Hyper-Converged Infrastructure Market Report is Segmented by Component (Hardware, Software, and Services), Service (Professional, and Managed), Organization Size (Large Enterprise, and Small and Medium Enterprise), End-User Industry (IT and Telecommunication, BFSI, Healthcare, Retail, Government and Defence, and More), and Geography. The Market Forecasts are Provided in Terms of Value (USD).
Geography Analysis
In 2025, North America accounted for 39.93% of global revenue, driven by U.S. federal zero-trust mandates and the establishment of hyperscaler edge hubs, with Verizon operating 1,000 low-latency sites. These mandates and hubs have significantly contributed to the region's dominance in the hyper-converged infrastructure market. Meanwhile, Canada's stringent data-sovereignty laws compel banks and hospitals to manage workloads on-premises, albeit under cloud-native governance frameworks. This regulatory environment has led to a sustained premium demand for hyper-converged infrastructure solutions, even in the face of rising borrowing costs, as organizations prioritize compliance and operational efficiency.
Asia-Pacific is on an upward trajectory, boasting an 18.69% CAGR. The region's growth is fueled by China's focus on developing indigenous virtualization stacks, India's efforts to modernize its telecommunications cores, and Japan's initiatives to automate factories through private 5G networks. Notably, Huawei's FusionCube is at the forefront of Chinese state projects, showcasing its dominance in the market. Similarly, Reliance Jio has expanded Nutanix across 10,000 towers, demonstrating India's commitment to scaling its telecommunications infrastructure. Additionally, Toyota has integrated Fujitsu's PRIMEFLEX into its assembly plants, highlighting Japan's focus on leveraging advanced technologies for industrial automation. This diverse multi-vendor landscape in the region not only accelerates innovation but also heightens the barriers to switching vendors, creating a competitive and dynamic market environment.
Europe grapples with 7-10 year grid queues in its FLAP-D metropolitan areas, which include Frankfurt, London, Amsterdam, Paris, and Dublin. This challenge is steering buyers towards more power-efficient ARM or RISC-V nodes and fostering co-location partnerships to mitigate energy constraints. Germany, driven by its robust automotive AI initiatives, represents 28% of the region's spending, underscoring its leadership in adopting advanced technologies. France, on the other hand, is capitalizing on its nuclear baseload energy to attract sovereign-cloud workloads, positioning itself as a key player in the market. While Nordic regions are drawing hyperscale attention with hydro and waste-heat recycling initiatives, rising tariffs are still curbing the hyper-converged infrastructure market's CAGR in the continent by 0.7%. These factors collectively shape Europe's market dynamics, presenting both opportunities and challenges for stakeholders.
- Nutanix Inc.
- Dell Technologies Inc.
- VMware Inc.
- Hewlett Packard Enterprise Development LP
- Cisco Systems Inc.
- Microsoft Corporation
- Huawei Technologies Co. Ltd.
- IBM Corporation
- NetApp Inc.
- Lenovo Group Limited
- Fujitsu Limited
- Hitachi Vantara LLC
- NEC Corporation
- Super Micro Computer Inc.
- Scale Computing Inc.
- StarWind Software Inc.
- DataCore Software Corporation
- Maxta Inc.
- Pivot3 Inc.
- Sangfor Technologies Inc.
Additional Benefits:
- The market estimate (ME) sheet in Excel format
- 3 months of analyst support
TABLE OF CONTENTS
1 INTRODUCTION
- 1.1 Study Assumptions and Market Definition
- 1.2 Scope of the Study
2 RESEARCH METHODOLOGY
3 EXECUTIVE SUMMARY
4 MARKET LANDSCAPE
- 4.1 Market Overview
- 4.2 Market Drivers
- 4.2.1 Data-center Consolidation Wave
- 4.2.2 Surging Cloud-native Workload Adoption
- 4.2.3 Lower TCO Versus Legacy Three-tier Architecture
- 4.2.4 Edge Computing Roll-outs in Telco and Retail
- 4.2.5 RISC-V and ARM Based HCI Appliances
- 4.2.6 Modular Data-center Demand in Emerging Africa
- 4.3 Market Restraints
- 4.3.1 Per-node Scalability Ceiling for High-end Workloads
- 4.3.2 Vendor Lock-in Concerns for Enterprise Buyers
- 4.3.3 Supply Chain Risk Around Custom ASICs
- 4.3.4 Escalating Datacenter Power Tariffs in Europe
- 4.4 Industry Value-Chain Analysis
- 4.5 Regulatory Landscape
- 4.6 Technological Outlook
- 4.7 Porter's Five Forces Analysis
- 4.7.1 Bargaining Power of Buyers
- 4.7.2 Bargaining Power of Suppliers
- 4.7.3 Threat of New Entrants
- 4.7.4 Threat of Substitutes
- 4.7.5 Competitive Rivalry
5 MARKET SIZE AND GROWTH FORECASTS (VALUE)
- 5.1 By Component
- 5.1.1 Hardware
- 5.1.2 Software
- 5.1.3 Services
- 5.2 By Service
- 5.2.1 Professional
- 5.2.2 Managed
- 5.3 By Organization Size
- 5.3.1 Large Enterprise
- 5.3.2 Small and Medium Enterprise
- 5.4 By End-user Industry
- 5.4.1 IT and Telecommunication
- 5.4.2 BFSI
- 5.4.3 Healthcare
- 5.4.4 Retail
- 5.4.5 Government and Defence
- 5.4.6 Rest of End-user Industry
- 5.5 By Geography
- 5.5.1 North America
- 5.5.1.1 United States
- 5.5.1.2 Canada
- 5.5.1.3 Mexico
- 5.5.2 South America
- 5.5.2.1 Brazil
- 5.5.2.2 Argentina
- 5.5.2.3 Rest of South America
- 5.5.3 Europe
- 5.5.3.1 Germany
- 5.5.3.2 United Kingdom
- 5.5.3.3 France
- 5.5.3.4 Italy
- 5.5.3.5 Spain
- 5.5.3.6 Rest of Europe
- 5.5.4 Asia-Pacific
- 5.5.4.1 China
- 5.5.4.2 India
- 5.5.4.3 Japan
- 5.5.4.4 South Korea
- 5.5.4.5 Australia and New Zealand
- 5.5.4.6 Rest of Asia-Pacific
- 5.5.5 Middle East
- 5.5.5.1 Saudi Arabia
- 5.5.5.2 United Arab Emirates
- 5.5.5.3 Turkey
- 5.5.5.4 Rest of Middle East
- 5.5.6 Africa
- 5.5.6.1 South Africa
- 5.5.6.2 Nigeria
- 5.5.6.3 Egypt
- 5.5.6.4 Rest of Africa
- 5.5.1 North America
6 COMPETITIVE LANDSCAPE
- 6.1 Market Concentration
- 6.2 Strategic Moves
- 6.3 Market Share Analysis
- 6.4 Company Profiles (includes Global Level Overview, Market Level Overview, Core Segments, Financials as available, Strategic Information, Market Rank/Share, Products and Services, Recent Developments)
- 6.4.1 Nutanix Inc.
- 6.4.2 Dell Technologies Inc.
- 6.4.3 VMware Inc.
- 6.4.4 Hewlett Packard Enterprise Development LP
- 6.4.5 Cisco Systems Inc.
- 6.4.6 Microsoft Corporation
- 6.4.7 Huawei Technologies Co. Ltd.
- 6.4.8 IBM Corporation
- 6.4.9 NetApp Inc.
- 6.4.10 Lenovo Group Limited
- 6.4.11 Fujitsu Limited
- 6.4.12 Hitachi Vantara LLC
- 6.4.13 NEC Corporation
- 6.4.14 Super Micro Computer Inc.
- 6.4.15 Scale Computing Inc.
- 6.4.16 StarWind Software Inc.
- 6.4.17 DataCore Software Corporation
- 6.4.18 Maxta Inc.
- 6.4.19 Pivot3 Inc.
- 6.4.20 Sangfor Technologies Inc.
7 MARKET OPPORTUNITIES AND FUTURE OUTLOOK
- 7.1 White-Space and Unmet-Need Assessment
 2026-2030年全球融合式基礎架構(HCI)市場
 超融合融合式基礎架構市場:按組件、部署類型、組織規模、產業和最終用戶分類-2026-2032年全球市場預測
 超融合融合式基礎架構市場-全球產業規模、佔有率、趨勢、機會、預測:按組件、應用、產業垂直領域、地區和競爭對手分類,2021-2031年
 融合式基礎架構市場規模、佔有率、趨勢和預測:按組件、應用、最終用戶和地區分類,2026-2034 年
 2026年全球融合式基礎架構(HCI)解決方案市場報告2026年融合式基礎架構全球市場報告
 超融合融合式基礎架構市場:市場規模、佔有率、成長率、全球產業分析、按類型、應用和地區分類的分析以及未來預測(2026-2034 年)
 融合式基礎架構市場分析及預測(至2035年):按類型、產品類型、服務、技術、組件、應用、部署類型、最終用戶和模組分類日本超融合基礎設施市場報告(按組件、應用、最終用途和地區分類,2026-2034 年)
 超融合融合式基礎架構市場規模、佔有率和成長分析(按組件、應用、最終用戶、組織規模、公司和地區分類)—2026-2033年產業預測