


 |
市場調查報告書
商品編碼
2044156
應用安全:市場佔有率分析、產業趨勢與統計、成長預測(2026-2031)Application Security - Market Share Analysis, Industry Trends & Statistics, Growth Forecasts (2026 - 2031) |
||||||

※ 本網頁內容可能與最新版本有所差異。詳細情況請與我們聯繫。
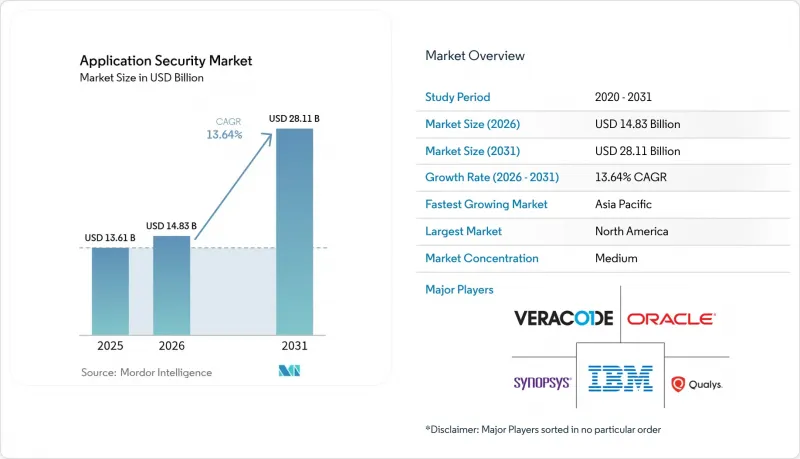
應用安全市場預計將從 2025 年的 136.1 億美元成長到 2026 年的 148.3 億美元,到 2031 年達到 281.1 億美元,2026 年至 2031 年的複合年成長率為 13.64%。
目前,持續整合 (CI) 管線在每次提交程式碼時都會進行程式碼掃描,相關工具的使用範圍正在開發、測試和生產層不斷擴展。美國監管機構預測,到 2025 年,42% 的網路安全事件將與不安全的介面有關,因此,企業正在轉向 API 感知測試。諸如 2025 年 3 月強制全面符合 PCI-DSS 4.0 標準等截止日期正在縮短採購週期,並加速軟體配置分析和運行時保護的普及。同時,隨著企業尋求偵測運作中邏輯中的缺陷,動態和互動式測試套件正在取代獨立的靜態分析工具。尤其值得一提的是,大型平台供應商收購 API、容器和供應鏈等領域的專業公司等併購事件正在改變競爭格局,並推動捆綁式 DevSecOps 套件的擴展。
全球應用安全市場趨勢與洞察
基於網路、行動裝置和 API 的攻擊日益增多且手段日益複雜。
攻擊者正日益利用各種漏洞繞過邊界防禦,例如身份驗證不完善的 API 端點、存在缺陷的物件級權限管理以及過度的資料外洩。這些漏洞在 2024 年 OWASP API 安全 Top 10 報告中都有重點提及。 2025 年,金融服務公司遭遇的 API 濫用試驗激增 67%,攻擊者利用行動銀行應用程式中檢驗的輸入參數進行攻擊。因此,各公司正在實施動態互動式測試,在運行的應用程式中重現惡意負載,並結合即時閘道器來檢查每個請求。行動軟體也面臨類似的審查,監管機構現在強制要求使用生物識別和加密小型資料庫,迫使敏捷團隊在每個迭代周期中安排安全掃描。資料外洩和帳戶盜用等迫在眉睫的業務風險正在推動整個應用安全市場的新支出。
DevSecOps 工具鏈的快速普及
根據 GitLab 的一項全球調查,整合到持續整合 (CI) 和持續交付 (CD) 管道中的自動化安全掃描,將漏洞檢測的平均時間從 2023 年的 21 天縮短至 2025 年的 4 天。 Kubernetes叢集現在配備了策略引擎,可以阻止存在嚴重缺陷的容器,確保在程式碼合併之前在上游工程進行修復。雲端供應商提供的原生儀表板不僅突出顯示基礎架構配置錯誤,還突出顯示應用程式層漏洞,使開發人員能夠在熟悉的主機上獲得端到端的風險概覽。然而,平均每個組織已經運行了七種不同的掃描器,導致警報疲勞和整合開銷。供應商正在透過整合編配平台來應對這些挑戰。總而言之,將安全控制直接整合到開發人員的工作流程中,可以擴展可用機會,並推動整個應用安全市場許可數量的成長。
總擁有成本 (TCO) 高且工具複雜
根據美國國家網路安全協會 (NCSA) 的一項調查,到 2025 年,62% 的中小企業 (SME) 將成本列為採用自動化測試的最大障礙。除了授權費用外,團隊還必須分配有限的工程師來配置掃描規則、將輸出結果整合到工單管理系統中,並對成千上萬的偵測結果進行優先排序。在主要城市,執行這些任務的工程師年收入可超過 12 萬美元。遷移到計量型平台可能需要 12 到 18 個月,這會擾亂發布週期,並促使一些公司推遲現代化改造。按需付費的雲端收費系統會導致預算波動,進一步加劇融資有限的組織的規劃難度。因此,潛在買家,尤其是中小企業,可能會推遲全面採用自動化測試,這可能會減緩整個應用程式安全市場的短期成長。
細分市場分析
預計到 2025 年,解決方案業務板塊將佔總收入的 61.48%,這凸顯了市場對能夠與原始碼控制和持續整合流程無縫整合的平台的強勁需求。服務業務板塊正以 13.67% 的複合年成長率成長,因為各組織正透過穿透測試、警報分類和開發人員技能發展外包給全球顧問公司來緩解內部人才短缺的問題。專家顧問負責處理複雜的基於使用者的許可談判、規則集配置,並提供可審計的證據,使產品團隊能夠專注於快速發布新功能。
託管服務將自動化掃描與全天候人工檢驗相結合,優先考慮可利用的漏洞而非理論上的漏洞。這種模式深受支付處理商和醫療保健系統的青睞,因為它們都受到嚴格的資料外洩通知法律的約束。供應商透過將諮詢服務納入企業契約,模糊了軟體和服務之間的界限,從而將客戶綁定到長期協議中。這種整合正在加速應用安全市場對事件回應和培訓等附加服務的採用,而平台支出則保持穩定。
預計到 2025 年,雲端部署將佔總收入的 57.81%,並將在 2031 年前以 13.77% 的複合年成長率持續成長,這主要得益於亞馬遜、微軟和谷歌將掃描器整合到開發者主機中。程式碼編輯器內提供的即時回饋無需切換上下文,從而可以實現持續掃描,同時其付費使用制具有成本效益,非常適合新創公司和小規模團隊。
對於運行空氣間隙環境(禁止外部程式碼處理)的銀行和國防機構而言,本地部署解決方案仍然至關重要。混合模式正在興起,在這種模式下,高度敏感的模組部署在防火牆後的容器化測試引擎中,而不太關鍵的微服務則運行在公共雲端上。供應商現在為這兩種模式提供相同的功能集,使客戶能夠逐步過渡,而不會中斷其工具。隨著監管資料主權條款日益嚴格,靈活的部署選項仍然是應用安全市場中重要的競爭優勢。
應用安全市場按組件(解決方案和服務)、部署模式(雲端和本地部署)、組織規模(中小企業和大型企業)、安全測試類型(靜態應用安全測試 (SAST)、動態應用安全測試 (DAST) 等)、最終用戶行業(銀行、金融服務和保險 (BFSI)、醫療保健、零售和電子商務等)以及地區進行細分。市場預測以美元 (USD) 為單位。
區域分析
預計到2025年,北美將佔全球收入的40.91%,這主要得益於第14028號行政命令,該命令強制要求供應商在聯邦採購中提交軟體材料清單(BOM)。美國網路安全和基礎設施安全局(CISA)於2024年發布了安全軟體標準,實際上將應用程式安全措施作為公共部門合約的強制性要求。創業投資不斷刺激新創企業的誕生,加劇了老牌公司與新興開放原始碼參與企業之間的競爭,同時也推動了功能上的快速創新。
亞太地區預計將成為成長最快的地區,到2031年複合年成長率將達到13.83%。這主要得益於對獨立安全審計和「安全設計」生命週期的需求,而印度的數位借貸監管和印尼的銀行現代化進程又推動了這一需求。中國的「多層防護2.0」強制要求在應用層進行加密和漏洞披露,國內平台目前已在開發初期就整合了靜態安全測試工具(SAST)和動態安全測試工具(DAST)。日本、韓國和澳洲的合規性變化進一步統一了區域需求,並促使全球供應商添加本地資料駐留和語言包。
歐洲正受惠於2025年1月生效的《數位營運彈性法案》。該法案強制要求金融業每季進行滲透測試,並推廣採用版本控制的審計追蹤。即將訂定的《網路安全彈性法案》將把「安全設計」義務擴展到單一市場內銷售的所有軟體,使其範圍超越傳統監管產業。中東和非洲市場仍在發展中,但沙烏地阿拉伯和阿拉伯聯合大公國強制推行的主權雲正在加速成長,這要求本地託管並結合經認證的安全工具。在南美洲,隨著巴西和墨西哥的金融監管機構將其指導方針與PCI-DSS 4.0接軌,並鼓勵銀行和金融科技公司進行持續測試,相關應用安全技術的應用也逐步推進。總體而言,合規性的統一正在融合區域趨勢,並擴大全球應用安全市場。
其他好處:
- Excel格式的市場預測(ME)表
- 3個月的分析師支持
目錄
第1章:引言
- 研究假設和市場定義
- 調查範圍
第2章:調查方法
第3章執行摘要
第4章 市場狀況
- 市場概覽
- 市場促進因素
- 基於網路、行動裝置和 API 的攻擊日益增多且手段日益複雜。
- DevSecOps 工具鏈的快速普及
- 不斷擴大的監管要求(PCI-DSS 4.0、GDPR、DORA 等)
- 第三方SaaS與API整合成長
- 根據美國總統第 14028 號命令,強制披露 SBOM。
- 人工智慧產生的程式碼導致未知漏洞增加
- 市場限制因素
- 工具整體擁有成本高且複雜。
- 全球安全編碼人才短缺
- 過多的誤報會削弱開發者的信心。
- 「左移疲勞」與工具的激增
- 價值鏈分析
- 監理情勢
- 技術展望
- 波特五力分析
- 新進入者的威脅
- 買方的議價能力
- 供應商的議價能力
- 替代品的威脅
- 競爭公司之間的競爭
- 宏觀經濟因素對市場的影響
第5章 市場規模與成長預測
- 按組件
- 解決方案
- 服務
- 部署模式
- 雲
- 現場
- 按組織規模
- 中小企業
- 大公司
- 按安全測試類型
- 靜態應用程式安全掃瞄(SAST)
- 動態應用程式安全測試 (DAST)
- 互動式應用程式安全測試 (IAST)
- 運行時應用程式自我保護(RASP)
- 軟體配置分析(SCA)
- 按最終用戶行業分類
- BFSI
- 衛生保健
- 零售與電子商務
- 政府/國防
- 資訊科技和通訊
- 教育
- 其他終端用戶產業
- 按地區
- 北美洲
- 美國
- 加拿大
- 墨西哥
- 南美洲
- 巴西
- 阿根廷
- 南美洲其他地區
- 歐洲
- 德國
- 英國
- 法國
- 西班牙
- 其他歐洲地區
- 亞太地區
- 中國
- 日本
- 印度
- 韓國
- 亞太其他地區
- 中東
- 沙烏地阿拉伯
- 阿拉伯聯合大公國
- 土耳其
- 其他中東國家
- 非洲
- 南非
- 奈及利亞
- 埃及
- 其他非洲地區
- 北美洲
第6章 競爭情勢
- 市場集中度
- 策略趨勢
- 市佔率分析
- 公司簡介
- IBM
- Synopsys Inc.
- Checkmarx
- Veracode(Thoma Bravo)
- Micro Focus
- Oracle Corporation
- Rapid7
- Qualys
- Palo Alto Networks
- Fortinet
- Trend Micro
- GitLab
- GitHub
- Snyk
- CrowdStrike
- Contrast Security
- WhiteHat Security(NTT)
- Positive Technologies
- SiteLock
- Mend(WhiteSource)
- ArmorCode
- Fasoo
- HCL Software(AppScan)
第7章 市場機會與未來展望
The application security market size is expected to increase from USD 13.61 billion in 2025 to USD 14.83 billion in 2026 and reach USD 28.11 billion by 2031, growing at a CAGR of 13.64% over 2026-2031.
Continuous integration pipelines now embed code scanning at every commit, multiplying tool usage across development, staging and production layers. Enterprises are pivoting toward API-aware testing after United States regulators highlighted that 42% of 2025 web incidents involved insecure interfaces. Deadlines such as the March 2025 mandate for full PCI-DSS 4.0 compliance compressed buying cycles, accelerating adoption of software composition analysis and runtime protection. Meanwhile, dynamic and interactive testing suites are displacing stand-alone static analyzers as organizations seek to detect business-logic flaws during live execution. Mergers, especially by large platform vendors buying niche API, container and supply-chain specialists, are reshaping competitive dynamics and expanding bundled DevSecOps suites.
Global Application Security Market Trends and Insights
Rising Volume And Sophistication Of Web, Mobile And API-Based Attacks
Attackers increasingly bypass perimeter controls by exploiting poorly authenticated API endpoints, broken object-level authorization and excessive data exposure, vulnerabilities flagged in the 2024 OWASP API Security Top 10. Financial services firms logged a 67% jump in API-driven fraud attempts during 2025 as adversaries manipulated unchecked input parameters in mobile banking apps. Enterprises consequently deploy dynamic and interactive testing that replay malicious payloads inside running applications, combined with real-time gateways inspecting every request. Mobile software faces similar scrutiny because regulators now mandate biometric authentication and encrypted local storage, forcing agile teams to schedule security scans within each sprint. The immediate business risk of data exfiltration and account takeover makes this driver the single largest catalyst for new spending across the application security market.
Rapid Adoption Of DevSecOps Toolchains
Automated security scans built into continuous integration and continuous delivery pipelines reduced median time to vulnerability detection from 21 days in 2023 to 4 days in 2025, as reported by GitLab's global survey. Kubernetes clusters now enforce policy engines that block containers containing critical flaws, pushing remediation upstream before code can merge. Cloud providers supply native dashboards highlighting application-layer weaknesses alongside infrastructure misconfigurations, giving developers an end-to-end risk posture within familiar consoles. Nevertheless, the average organization already runs seven distinct scanners, creating alert fatigue and integration overhead that vendors address through unified orchestration platforms. Overall, embedding security controls directly inside developer workflows expands addressable usage moments and fuels compounding license growth across the application security market.
High Total Cost Of Ownership And Tool Complexity
National Cyber Security Alliance research showed that 62% of small firms cited cost as the top barrier to automated testing in 2025. Beyond license fees, teams must allocate scarce engineers to configure scan rules, integrate outputs into ticketing systems and triage thousands of findings, roles commanding salaries above USD 120,000 in major hubs. Migration projects toward unified platforms can span 12-18 months, disrupting release cadences and prompting some businesses to defer modernization. Consumption-based cloud pricing introduces budget volatility, further complicating planning for cash-constrained organizations. As a result, potential buyers, particularly SMEs, may postpone full coverage, tempering short-term growth across the application security market.
Other drivers and restraints analyzed in the detailed report include:
- Expanding Regulatory Mandates (PCI-DSS 4.0, GDPR, DORA)
- Growth In Third-Party SaaS And API Integrations
- Global Shortage Of Secure-Coding Talent
For complete list of drivers and restraints, kindly check the Table Of Contents.
Segment Analysis
Solutions maintained 61.48% of 2025 revenue, confirming entrenched demand for platforms that integrate seamlessly with source control and continuous integration flows. The services segment is growing at a 13.67% CAGR because organizations delegate penetration testing, alert triage and developer upskilling to global consulting firms, mitigating in-house talent shortages. Professional advisers negotiate complex seat-based licenses, configure rule sets and deliver audit-ready evidence, freeing product teams to ship features faster.
Managed services also combine automated scans with 24/7 human validation, ranking exploitable findings over theoretical flaws, a model prized by payment processors and healthcare systems under strict breach-notification laws. Solutions vendors bundle advisory hours into enterprise agreements, blurring lines between software and services and locking clients into long-term contracts. This convergence keeps platform spending steady while accelerating uptake of add-on incident-response and training offerings across the application security market.
Cloud deployment held 57.81% of revenue in 2025 and is projected to compound at 13.77% through 2031, buoyed by Amazon, Microsoft and Google integrating scanners inside developer consoles. Real-time feedback delivered within code editors eliminates context switching, encouraging continuous scanning and facilitating pay-as-you-go economics ideal for startups and small teams.
On-premise solutions remain indispensable for banks and defense agencies operating air-gapped environments that prohibit external code processing. Hybrid models are rising, with containerized testing engines deployed behind firewalls for sensitive modules, while less critical microservices run in public clouds. Vendors now ship identical feature sets across both modes, allowing customers gradual migration without tooling disruption. As regulatory data-sovereignty clauses tighten, flexible deployment remains a competitive differentiator within the application security market.
Application Security Market is Segmented by Component (Solutions, and Services), Deployment Mode (Cloud, and On-Premises), Organization Size (SMEs, and Large Enterprises), Security Testing Type (SAST, DAST, and More), End-User Industry (BFSI, Healthcare, Retail and E-Commerce, and More), and Geography. The Market Forecasts are Provided in Terms of Value (USD).
Geography Analysis
North America accounted for 40.91% of 2025 revenue, propelled by Executive Order 14028, which obliges vendors to supply software bills of materials for federal procurement. The United States Cybersecurity and Infrastructure Security Agency published baseline secure-software standards in 2024, effectively making application security controls contractual requirements for public-sector deals. Venture capital funding fosters constant startup formation, intensifying competition among incumbents and open-source challengers while driving rapid feature innovation.
Asia-Pacific delivers the fastest 13.83% CAGR through 2031 as India's digital lending rules and Indonesia's banking modernization require independent security audits and secure-by-design lifecycles. China's Multi-Level Protection Scheme 2.0 enforces application-layer encryption and vulnerability disclosure, causing domestic platforms to embed SAST and DAST tooling from the earliest sprint. Compliance changes across Japan, South Korea and Australia further unify regional demand, prompting global vendors to add local data residency and language packs.
Europe benefits from the Digital Operational Resilience Act effective January 2025, mandating quarterly penetration testing for finance and pushing adoption of version-control-level audit trails. The forthcoming Cyber Resilience Act will extend secure-by-design duties to all software sold inside the single market, broadening scope beyond traditional regulated verticals. Middle East and Africa markets remain nascent but accelerate as sovereign-cloud mandates in Saudi Arabia and the United Arab Emirates require local hosting paired with certified security tooling. South America witnesses gradual uptake as financial regulators in Brazil and Mexico harmonize guidance with PCI-DSS 4.0, nudging banks and fintechs toward continuous testing. Collectively, compliance harmonization converges regional trajectories, enlarging the global application security market.
- IBM
- Synopsys Inc.
- Checkmarx
- Veracode (Thoma Bravo)
- Micro Focus
- Oracle Corporation
- Rapid7
- Qualys
- Palo Alto Networks
- Fortinet
- Trend Micro
- GitLab
- GitHub
- Snyk
- CrowdStrike
- Contrast Security
- WhiteHat Security (NTT)
- Positive Technologies
- SiteLock
- Mend (WhiteSource)
- ArmorCode
- Fasoo
- HCL Software (AppScan)
Additional Benefits:
- The market estimate (ME) sheet in Excel format
- 3 months of analyst support
TABLE OF CONTENTS
1 INTRODUCTION
- 1.1 Study Assumptions and Market Definition
- 1.2 Scope of the Study
2 RESEARCH METHODOLOGY
3 EXECUTIVE SUMMARY
4 MARKET LANDSCAPE
- 4.1 Market Overview
- 4.2 Market Drivers
- 4.2.1 Rising Volume and Sophistication of Web-, Mobile- and API-Based Attacks
- 4.2.2 Rapid Adoption of DevSecOps Toolchains
- 4.2.3 Expanding Regulatory Mandates (PCI-DSS 4.0, GDPR, DORA, etc.)
- 4.2.4 Growth in Third-Party SaaS and API Integrations
- 4.2.5 Mandatory SBOM Disclosure Post-US Executive Order 14028
- 4.2.6 AI-Generated Code Inflating Unknown Vulnerabilities
- 4.3 Market Restraints
- 4.3.1 High Total Cost of Ownership and Tool Complexity
- 4.3.2 Global Shortage of Secure-Coding Talent
- 4.3.3 False-Positive Overload Eroding Developer Trust
- 4.3.4 "Shift-Left Fatigue" and Tool Sprawl
- 4.4 Value Chain Analysis
- 4.5 Regulatory Landscape
- 4.6 Technological Outlook
- 4.7 Porter's Five Forces Analysis
- 4.7.1 Threat of New Entrants
- 4.7.2 Bargaining Power of Buyers
- 4.7.3 Bargaining Power of Suppliers
- 4.7.4 Threat of Substitutes
- 4.7.5 Competitive Rivalry
- 4.8 Impact of Macroeconomic Factors on the Market
5 MARKET SIZE AND GROWTH FORECASTS (VALUE)
- 5.1 By Component
- 5.1.1 Solutions
- 5.1.2 Services
- 5.2 By Deployment Mode
- 5.2.1 Cloud
- 5.2.2 On-Premise
- 5.3 By Organization Size
- 5.3.1 Small and Medium Enterprises (SMEs)
- 5.3.2 Large Enterprises
- 5.4 By Security Testing Type
- 5.4.1 Static Application Security Testing (SAST)
- 5.4.2 Dynamic Application Security Testing (DAST)
- 5.4.3 Interactive Application Security Testing (IAST)
- 5.4.4 Run-Time Application Self-Protection (RASP)
- 5.4.5 Software Composition Analysis (SCA)
- 5.5 By End-User Industry
- 5.5.1 BFSI
- 5.5.2 Healthcare
- 5.5.3 Retail and E-Commerce
- 5.5.4 Government and Defense
- 5.5.5 IT and Telecom
- 5.5.6 Education
- 5.5.7 Other End-User Industries
- 5.6 By Geography
- 5.6.1 North America
- 5.6.1.1 United States
- 5.6.1.2 Canada
- 5.6.1.3 Mexico
- 5.6.2 South America
- 5.6.2.1 Brazil
- 5.6.2.2 Argentina
- 5.6.2.3 Rest of South America
- 5.6.3 Europe
- 5.6.3.1 Germany
- 5.6.3.2 United Kingdom
- 5.6.3.3 France
- 5.6.3.4 Spain
- 5.6.3.5 Rest of Europe
- 5.6.4 Asia-Pacific
- 5.6.4.1 China
- 5.6.4.2 Japan
- 5.6.4.3 India
- 5.6.4.4 South Korea
- 5.6.4.5 Rest of Asia-Pacific
- 5.6.5 Middle East
- 5.6.5.1 Saudi Arabia
- 5.6.5.2 United Arab Emirates
- 5.6.5.3 Turkey
- 5.6.5.4 Rest of Middle East
- 5.6.6 Africa
- 5.6.6.1 South Africa
- 5.6.6.2 Nigeria
- 5.6.6.3 Egypt
- 5.6.6.4 Rest of Africa
- 5.6.1 North America
6 COMPETITIVE LANDSCAPE
- 6.1 Market Concentration
- 6.2 Strategic Moves
- 6.3 Market Share Analysis
- 6.4 Company Profiles (includes Global Level Overview, Market Level Overview, Core Segments, Financials as available, Strategic Information, Market Rank/Share, Products and Services, Recent Developments)
- 6.4.1 IBM
- 6.4.2 Synopsys Inc.
- 6.4.3 Checkmarx
- 6.4.4 Veracode (Thoma Bravo)
- 6.4.5 Micro Focus
- 6.4.6 Oracle Corporation
- 6.4.7 Rapid7
- 6.4.8 Qualys
- 6.4.9 Palo Alto Networks
- 6.4.10 Fortinet
- 6.4.11 Trend Micro
- 6.4.12 GitLab
- 6.4.13 GitHub
- 6.4.14 Snyk
- 6.4.15 CrowdStrike
- 6.4.16 Contrast Security
- 6.4.17 WhiteHat Security (NTT)
- 6.4.18 Positive Technologies
- 6.4.19 SiteLock
- 6.4.20 Mend (WhiteSource)
- 6.4.21 ArmorCode
- 6.4.22 Fasoo
- 6.4.23 HCL Software (AppScan)
7 MARKET OPPORTUNITIES AND FUTURE OUTLOOK
- 7.1 White-Space and Unmet-Need Assessment

 行動應用安全測試市場預測-全球分析(按交付方式、企業規模、部署模式、作業系統、最終用戶和地區分類)——2034年
 應用安全市場:按類型、組件、產業、部署模式和組織規模分類-2026-2032年全球市場預測
 應用安全市場規模、佔有率、趨勢和預測:按組件、類型、測試類型、部署模式、組織規模、行業和地區分類(2026-2034 年)
 應用安全市場規模、佔有率、成長率及全球產業分析:按類型、應用和地區的洞察,2026-2034年的預測
 2026年全球行動網路釣魚防範措施市場報告行動應用安全測試市場:依測試類型、測試方法、應用平台和部署方式分類-2026-2032年全球市場預測2026年全球應用安全市場報告室內安防巡邏機器人市場:按組件、自主等級、移動性、最終用戶和應用分類-全球預測,2026-2032年
 應用安全市場規模、佔有率和趨勢分析報告:按組件、解決方案、服務、測試類型、部署方式、企業規模、最終用途、地區和細分市場分類 - 預測,2026-2033 年應用安全態勢管理軟體市場:按部署模式、安全性類型、應用程式類型、組織規模、最終用戶和垂直行業分類 - 全球預測(2026-2032 年)