


 |
市場調查報告書
商品編碼
2044145
大樓自動化系統:市場佔有率分析、產業趨勢與統計、成長預測(2026-2031)Building Automation System - Market Share Analysis, Industry Trends & Statistics, Growth Forecasts (2026 - 2031) |
||||||

※ 本網頁內容可能與最新版本有所差異。詳細情況請與我們聯繫。
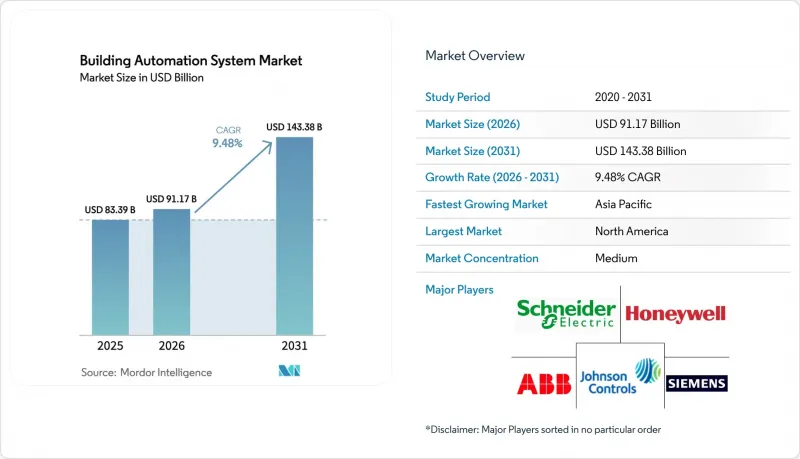
預計大樓自動化系統市場將從 2025 年的 833.9 億美元和 2026 年的 911.7 億美元成長到 2031 年的 1,433.8 億美元,2026 年至 2031 年的複合年成長率為 9.48%。
在監管壓力日益增大、感測器價格不斷下降以及雲端分析技術日趨成熟的推動下,建築控制系統正從簡單的獨立式暖通空調定時器轉型為數據豐富的企業級平台。為了遵守更嚴格的能源法規,業主們正在加快維修,而訂閱式軟體模式則降低了小規模設施採用該技術的門檻。供應商正在將預測分析功能打包,以減少服務呼叫並實現營運數據貨幣化,而公用事業公司則透過提供更高的回扣來提高需量反應計劃的吸引力。從專有硬體到開放、安全協議的轉變,正在為更廣泛的部署奠定基礎,從商業和公共建築到獨棟住宅,都將受益。
全球大樓自動化系統市場趨勢及洞察
嚴格的能源效率法規和綠建築標準
新的建築規範正將能源效率從「可選項」轉變為「強制性要求」。 2024 年國際節能標準 (IECC) 加強了對暖通空調 (HVAC) 節能措施和通風的規定,而德國 2024 年建築能源法案 (Gebaudeenergiegesetz) 則強制要求面積超過 1000平方公尺的非住宅建築必須實現自動化。在奧地利的一項試點計畫中,智慧就緒指標 (SRI) 得分超過 70 分的建築可獲得 4% 至 7% 的租金溢價。加州第 24 號法規修正案規定,資料中心和零售商店必須在收到電網訊號後的 10 分鐘內將尖峰負載降低 15%。隨著 ISO 52120 等認證的日益普及,保險公司和貸款機構正在將自動化採用程度納入綠色金融定價,從而賦予合規性以切實的貨幣價值。
物聯網和智慧互聯設備的普及
低成本半導體和開放API正在消除以往與高階控制系統相關的高昂價格。 Matter 1.4實現了800多種認證設備的互通性,管理員無需中間件即可將來自多個品牌的溫控器、照明設備和門禁卡整合在一起。 Thread的網狀網路即使在高密度塔樓內也能將無線覆蓋範圍擴展至100米,在新加坡的一個試點項目中,管道工程量減少了40%。霍尼韋爾基於Azure的Forge平台現在可以提前兩週預測故障,從而將意外停機時間減少了25%。整合了內建BACnet閘道器的Wi-Fi 6E網路基地台簡化了佈線,並支援將即時佔用地圖整合到企業IT儀表板中。
初始投資額高,投資回收期長
全面維修的成本在每平方英尺 8 美元到 15 美元之間,這意味著一棟 10 萬平方英尺的辦公大樓需要花費 100 萬美元,這使得許多業主面臨資金籌措難題。歐洲的研究表明,在波蘭等補貼地區,翻新成本高達每平方公尺10 歐元,投資回收期長達四年。小規模業主無法獲得綠色貸款,而且由於收費系統和天氣狀況的波動,投資回報率難以預測。基於績效的合約將資本投資轉移給了供應商,同時增加了法律複雜性,因此不受謹慎經營團隊的歡迎。
細分市場分析
軟體市場預計到2031年將以10.07%的複合年成長率成長,供應商正從一次性授權模式轉向循環訂閱模式,以實現故障偵測和能源基準測試的利潤。監控套件現在整合了強化學習模組,用於最佳化冷卻器的運行階段,並在舒適度申訴出現之前檢測閥門漂移。施耐德電機的EcoStruxure系統已在48萬個地點運作,每月每平方英尺收費0.05至0.15美元,將已安裝的設備轉化為穩定的收入來源。到2025年,硬體仍將佔大樓自動化系統市場佔有率的48.43%,因為感測器和控制器仍然至關重要,但由於商品化,利潤率正在下降。隨著遠端診斷減少了現場訪問的需求,服務領域保持著穩定的中個位數成長。
隨著雲端託管消除伺服器採購成本,與軟體相關的大樓自動化系統市場預計將快速成長。供應商正將多年分析服務與每台新控制器捆綁銷售,從而強化降低設施營運成本的獎勵。同時具備IT和OT領域專業知識的獨立整合商正在填補技能缺口,他們收取高額的日費,將第三方感測器整合到供應商的控制面板中。在整個預測期內,軟體的高毛利率預計將提升企業價值,並進一步推動對人工智慧新創公司的互補性收購。
到2025年,暖通空調(HVAC)控制系統將佔銷售額的38.51%,仍將是大樓自動化系統市場的基石;同時,能源管理模組正以10.17%的複合年成長率快速成長。目前,美國18個州的電力公司每五分鐘發布一次價格訊號,自動回應可將設施的能源成本降低15%至25%。照明控制正從基於日曆的調光轉向基於感測器的自然光利用,尤其是在玻璃高層建築中。安防、門禁和生命安全平台正在整合,並且根據NFPA 72標準規定,當火警警報器啟動時,暖通空調排煙和出口解鎖將同時進行。
隨著界限的模糊,整合式儀錶板使設施管理人員能夠集中監控熱負荷、電力消耗量和入住率。這種融合正在重新定義建築控制,使其從「暖通空調系統的附加組件」轉變為一套全面的操作技術體系。隨著財務長將排放揭露與負責人薪酬掛鉤,分析數據正從機房走向負責人,面向能源管理大樓自動化系統市場規模預計將持續擴大。提供模組化附加元件而非完整系統升級的供應商正在贏得維修項目,而SaaS定價模式則允許客戶從電錶計量入手,稍後再添加照明和安全功能。
區域分析
預計到2025年,北美將佔全球銷售額的34.33%。這主要得益於2024年國際節能規範(IECC)和即將修訂的加州能源法規第24條將自動化納入合規性檢查清單。美國暖氣、冷氣與空調工程師學會(ASHRAE)90.1-2022標準承諾比2019年基準值節能8.9%,這推動了企業園區冷水機組的現代化改造。加拿大國家能源規範強制要求面積超過3000平方公尺的建築物安裝控制系統,多倫多市政府也提供獎勵,補貼高達25%的工程成本。墨西哥由於關稅較低而落後於其他地區,但為了滿足母公司環境、社會和治理(ESG)審計的要求,該國正在將自動化技術應用於新的海上工廠。試運行作業中的人手不足仍然是一個瓶頸,導致專案工期延長,服務費用上升。
亞太地區是成長最快的地區,年複合成長率達9.86%。中國首個五年規劃投資690億美元用於智慧城市基礎建設,其中約12%將用於北京、上海和深圳的建築控制系統。印度的智慧城市計畫強制要求面積超過1萬平方公尺的政府和商業建築實現自動化,而日本正在資助一個試點項目,旨在透過基於人員佔用情況的暖通空調(HVAC)系統實現20%的節能。澳洲的《2025年國家建築標準》強制要求面積超過2000平方公尺的商業建築實現自動化,新加坡的綠色建築標誌計畫則提升了認證房產的轉售價值。然而,分散的供應鏈和區域標準差異使得市場准入變得複雜。
歐洲的政策正為其發展提供強而有力的支持。 《建築能源性能指令》(EPBD) 的修訂規定,到 2024 年,所有非住宅建築(功率超過 290 千瓦)必須安裝建築自動化和控制系統,到 2029 年,這項要求將降至 70 千瓦。在法國,強制安裝截止日期為 2025 年 1 月;在德國,逾期未安裝的房產可能面臨每處 5 萬歐元(約 58,145.62 美元)的罰款。 「地平線歐洲」計畫的補貼正在加速西班牙、波蘭和希臘的試點項目,而「智慧準備度指標」則將自動化程度與房產估值掛鉤。由於補貼電力供應和綠色金融有限,東歐在這方面進展緩慢,但計劃在 2027 年設立一個 100 億歐元(約 116.3 億美元)的專項基金,用於能源維修。
在中東,智慧電網的發展動能遠超其他地區。杜拜耗資70億迪拉姆(約19.1億美元)的智慧電網計畫強制要求面積超過1萬平方公尺的建築進行建築級智慧電網部署,這無疑創造了巨大的市場需求。西門子在阿拉伯聯合大公國維修了60棟建築,實現了27%的節能效果,並在不到四年的時間內收回了投資,為鄰國樹立了成功典範。沙烏地阿拉伯的「迪里亞之門」(Dirya Gate)計畫投資632億美元,用於部署BACnet Secure Connect系統,目標是2025年實現電網40%的自動化水準。南美洲和非洲仍處於發展階段。巴西的「PROCEL Edifica」計畫和南非的稅收優惠政策正在推動主要都市區的需求成長,但全國範圍內的智慧電網發展勢頭仍然不足。
其他好處
- Excel格式的市場預測(ME)表
- 3個月的分析師支持
目錄
第1章:引言
- 研究假設和市場定義
- 調查範圍
第2章:調查方法
第3章執行摘要
第4章 市場狀況
- 市場概覽
- 市場促進因素
- 嚴格的能源效率法規和綠建築標準
- 物聯網和智慧連網型設備。
- 對降低能源成本和永續性目標的需求
- 智慧城市理念的推廣與政府獎勵
- 將數位雙胞胎技術整合到預測性建築管理中
- 混合辦公模式透過提高空間利用率來最佳化空間利用率。
- 市場限制因素
- 初始投資額大,投資回收期長
- 舊有系統之間缺乏互通性標準
- 由於對網路安全和資料隱私的日益擔憂,專案延期。
- 熟練的建築自動化系統試運行專家短缺
- 宏觀經濟因素的影響
- 產業價值鏈分析
- 監理情勢
- 技術分析
- 波特五力分析
- 供應商的議價能力
- 買方的議價能力
- 新進入者的威脅
- 替代品的威脅
- 競爭公司之間的競爭
第5章 市場規模與成長預測
- 按組件
- 硬體
- 控制器
- 感測器和現場設備
- 執行器
- 其他硬體組件
- 軟體
- 監控和管理軟體
- 分析/能源管理軟體
- 服務
- 安裝
- 維護和支援
- 硬體
- 依系統類型
- 暖通空調控制系統
- 照明控制系統
- 安全和存取控制系統
- 影像監控系統
- 門禁系統
- 刷卡/RFID門禁
- 生物識別訪問
- 能源管理系統
- 消防和災害預防系統
- 透過通訊技術
- 有線
- 無線的
- 按安裝類型
- 新建工程
- 維修
- 最終用戶
- 家用
- 商業的
- 工業的
- 公共機構和政府
- 按地區
- 北美洲
- 美國
- 加拿大
- 墨西哥
- 南美洲
- 巴西
- 阿根廷
- 歐洲
- 德國
- 英國
- 法國
- 其他歐洲國家
- 亞太地區
- 中國
- 日本
- 印度
- 亞太其他地區
- 中東
- 阿拉伯聯合大公國
- 沙烏地阿拉伯
- 其他中東國家
- 非洲
- 南非
- 其他非洲地區
- 北美洲
第6章 競爭情勢
- 市場集中度
- 策略趨勢
- 市佔率分析
- 公司簡介
- Honeywell International Inc.
- Siemens AG
- Johnson Controls International plc
- Schneider Electric SE
- ABB Ltd
- Robert Bosch GmbH
- Mitsubishi Electric Corporation
- Carrier Global Corporation
- Trane Technologies plc
- Legrand SA
- Cisco Systems Inc.
- Hubbell Incorporated
- Delta Controls Inc.
- Lutron Electronics Co., Inc.
- Crestron Electronics, Inc.
- Distech Controls Inc.
- Leviton Manufacturing Co., Inc.
- Belimo Holding AG
- Automated Logic Corporation(Carrier)
第7章 市場機會與未來展望
The Building automation system market size is projected to expand from USD 83.39 billion in 2025 and USD 91.17 billion in 2026 to USD 143.38 billion by 2031, registering a 9.48% CAGR between 2026 and 2031.
Rising regulatory pressure, falling sensor prices, and maturing cloud analytics are turning building controls from isolated HVAC timers into enterprise-wide, data-rich platforms. Facility owners are accelerating retrofits to comply with tighter energy codes, while subscription software models lower the entry barrier for small portfolios. Vendors are bundling predictive analytics that cut service calls and monetize operational data, and utilities are sweetening demand-response programs with higher rebates. The shift from proprietary hardware toward open, secure protocols is setting the stage for broader adoption across commercial, institutional, and even single-family housing stock.
Global Building Automation System Market Trends and Insights
Stringent Energy Efficiency Regulations And Green Building Codes
Fresh codes are turning energy reduction from a choice into a mandate. The 2024 International Energy Conservation Code tightened HVAC setback and ventilation rules, while Germany's 2024 Gebaudeenergiegesetz requires automation in non-residential buildings above 1,000 m2. Buildings that exceed a 70-point Smart Readiness Indicator in early Austrian pilots enjoy 4-7% rental premiums. California's Title 24 update obliges data centers and retailers to drop 15% of peak load within ten minutes of a grid signal. As certifications such as ISO 52120 gain momentum, insurers and lenders are using automation depth to price green finance, effectively putting a hard dollar value on compliance.
Growing Adoption of IoT And Smart Connected Devices
Low-cost silicon and open APIs are dissolving the premium once attached to sophisticated controls. Matter 1.4 enabled interoperability across 800-plus certified devices, letting managers mix thermostats, lighting, and access badges from multiple brands without middleware. Thread's mesh network stretches wireless range to 100 m in dense towers, shaving conduit labor by 40% in Singapore pilots. Honeywell's Azure-enabled Forge platform now predicts failures up to two weeks ahead, cutting unplanned downtime by 25%. Converged Wi-Fi 6E access points with embedded BACnet gateways simplify wiring and make real-time occupancy maps part of corporate IT dashboards.
High Upfront Capital Expenditure And Long Payback Periods
Comprehensive retrofits can cost USD 8-15 per ft2, pushing a 100,000-ft2 office into a USD 1 million outlay that many landlords struggle to finance. European studies show EUR 10 per m2 spend with four-year paybacks in subsidized-electricity zones such as Poland. Smaller owners lack access to green loans, and ROI calculations wobble with changing tariffs and weather. Pay-for-performance contracts shift capex to vendors but add legal complexity that cautious managers resist.
Other drivers and restraints analyzed in the detailed report include:
- Demand for Energy Cost Savings And Sustainability Targets
- Proliferation of Smart City Initiatives And Government Incentives
- Lack Of Interoperable Standards Across Legacy Systems
For complete list of drivers and restraints, kindly check the Table Of Contents.
Segment Analysis
Software is recording a 10.07% CAGR through 2031 as vendors transition from one-time licenses to recurring subscriptions that monetize fault detection and energy benchmarking. Supervisory suites now embed reinforcement-learning modules that optimize chiller staging and flag valve drift before comfort complaints arise. Schneider Electric's EcoStruxure, active in 480,000 sites, charges at USD 0.05-0.15 per ft2 monthly, turning the installed base into an annuity. Hardware still dominates the Building automation system market share at 48.43% in 2025 because sensors and controllers remain mandatory, yet commoditization is eroding margins. Services are steady mid-single-digit growers as remote diagnostics lessen the need for on-site truck rolls.
The Building automation system market size attached to software is projected to grow sharply because cloud hosting sidesteps server procurement costs. Vendors bundle multiyear analytics contracts with every new controller, aligning incentives to cut a facility's utility bills. Independent integrators that master both IT and OT domains are filling skill gaps, charging premium day rates to stitch third-party sensors into vendor dashboards. Over the forecast horizon, software's higher gross margin will nudge corporate valuations, spurring more tuck-in acquisitions of AI startups.
HVAC controls, at 38.51% revenue share in 2025, remain the backbone of the Building automation system market, but energy management modules are racing ahead at a 10.17% CAGR. Utilities in 18 U.S. states now dispatch five-minute price signals, and automated response can shave 15-25% of a site's bill. Lighting controls are shifting from calendar-based dimming to sensor-driven daylight harvesting, especially in glass-heavy towers. Security, access, and life-safety platforms are converging, enabling a fire alarm to cue HVAC smoke purge and unlock exits simultaneously, as stipulated by NFPA 72.
As boundaries blur, integrated dashboards give facility managers a single view of thermal loads, kWh spend, and occupant counts. That convergence is redefining building controls from "HVAC plus extras" into holistic operational technology stacks. The Building automation system market size for energy management tools will keep expanding as CFOs link emissions disclosures to executive compensation, pushing analytics from plant rooms into the boardroom. Vendors offering modular add-ons rather than forklift upgrades are winning retrofits, and SaaS pricing lets customers start with power metering and layer on lighting or security later.
The Building Automation System Market Report is Segmented by Component (Hardware, Software, and Services), System Type (HVAC Control, Lighting Control, and More), Communication Technology (Wired, and Wireless), Installation Type (New-Build, and Retrofit), End User (Residential, Commercial, Industrial, and Institutional), and Geography (North America, Europe, and More). The Market Forecasts are Provided in Terms of Value (USD).
Geography Analysis
North America captured 34.33% of 2025 revenue, buoyed by the 2024 IECC and upcoming Title 24 updates that hard-wire automation into compliance checklists. ASHRAE 90.1-2022 promises 8.9% energy savings over the 2019 baseline, pushing corporate campuses to modernize chilled-water plants. Canada's National Energy Code mandates controls for buildings above 3,000 m2, and municipal incentives in Toronto cover up to 25% of project costs. Mexico lags due to lower tariffs but is seeing automation embedded in new near-shore factories to satisfy parent-company ESG audits. Labor shortages in commissioning trades remain a bottleneck, stretching timelines and propping up service rates.
Asia Pacific is the fastest-growing territory at a 9.86% CAGR. China's five-year plan steers USD 69 billion toward smart-city layers, reserving roughly 12% for building controls in Beijing, Shanghai, and Shenzhen. India's Smart Cities Mission mandates automation for government and commercial properties over 10,000 m2, while Japan funds pilots that target 20% savings through occupancy-based HVAC. Australia's 2025 National Construction Code embeds automation in commercial buildings above 2,000 m2, and Singapore's Green Mark raises resale values for rated properties. Fragmented supply chains and divergent local standards, however, create go-to-market complexity.
Europe enjoys strong policy tailwinds. The EPBD recast forces Building Automation and Control Systems in non-residential sites over 290 kW by 2024, dropping to 70 kW by 2029. France requires installation by January 2025, and Germany can fine laggards EUR 50,000 (USD 58,145.62) per property. Horizon Europe subsidies accelerate demos in Spain, Poland, and Greece, while the Smart Readiness Indicator links automation depth to property valuation. Eastern Europe trails due to subsidy electricity and limited green financing, yet cohesion funds of EUR 10 billion (USD 11.63 billion) through 2027 are earmarked for energy retrofits.
The Middle East shows outsized momentum. Dubai's AED 7 billion (USD 1.91 billion) smart-grid blueprint mandates building-level response for structures above 10,000 m2, baking demand into the pipeline. Siemens' retrofit of 60 UAE buildings confirmed a 27% energy cut and sub-four-year payback, setting proof points for neighbors. Saudi Arabia's Diriyah Gate channels USD 63.2 billion into BACnet Secure Connect deployments, aiming for 40% grid automation by 2025. South America and Africa remain nascent; Brazil's PROCEL Edifica and South Africa's tax incentives pick up the slack in major metros but lack nationwide impetus.
- Honeywell International Inc.
- Siemens AG
- Johnson Controls International plc
- Schneider Electric SE
- ABB Ltd
- Robert Bosch GmbH
- Mitsubishi Electric Corporation
- Carrier Global Corporation
- Trane Technologies plc
- Legrand SA
- Cisco Systems Inc.
- Hubbell Incorporated
- Delta Controls Inc.
- Lutron Electronics Co., Inc.
- Crestron Electronics, Inc.
- Distech Controls Inc.
- Leviton Manufacturing Co., Inc.
- Belimo Holding AG
- Automated Logic Corporation (Carrier)
Additional Benefits:
- The market estimate (ME) sheet in Excel format
- 3 months of analyst support
TABLE OF CONTENTS
1 INTRODUCTION
- 1.1 Study Assumptions and Market Definition
- 1.2 Scope of the Study
2 RESEARCH METHODOLOGY
3 EXECUTIVE SUMMARY
4 MARKET LANDSCAPE
- 4.1 Market Overview
- 4.2 Market Drivers
- 4.2.1 Stringent Energy Efficiency Regulations and Green Building Codes
- 4.2.2 Growing Adoption of IoT and Smart Connected Devices
- 4.2.3 Demand for Energy Cost Savings and Sustainability Targets
- 4.2.4 Proliferation of Smart City Initiatives and Government Incentives
- 4.2.5 Integration of Digital Twin Technology for Predictive Building Operations
- 4.2.6 Hybrid Work Models Driving Occupancy-Based Space Optimization
- 4.3 Market Restraints
- 4.3.1 High Upfront Capital Expenditure and Long Payback Periods
- 4.3.2 Lack of Interoperable Standards Across Legacy Systems
- 4.3.3 Escalating Cybersecurity and Data Privacy Concerns Delaying Projects
- 4.3.4 Shortage of Skilled BAS Commissioning Professionals
- 4.4 Impact of Macroeconomic Factors
- 4.5 Industry Value Chain Analysis
- 4.6 Regulatory Landscape
- 4.7 Technology Analysis
- 4.8 Porter's Five Forces Analysis
- 4.8.1 Bargaining Power of Suppliers
- 4.8.2 Bargaining Power of Buyers
- 4.8.3 Threat of New Entrants
- 4.8.4 Threat of Substitutes
- 4.8.5 Intensity of Competitive Rivalry
5 MARKET SIZE AND GROWTH FORECASTS (VALUE)
- 5.1 By Component
- 5.1.1 Hardware
- 5.1.1.1 Controllers
- 5.1.1.2 Sensors and Field Devices
- 5.1.1.3 Actuators
- 5.1.1.4 Other Hardware Components
- 5.1.2 Software
- 5.1.2.1 Supervisory / Management Software
- 5.1.2.2 Analytics / Energy Management Software
- 5.1.3 Services
- 5.1.3.1 Installation
- 5.1.3.2 Maintenance and Support
- 5.1.1 Hardware
- 5.2 By System Type
- 5.2.1 HVAC Control Systems
- 5.2.2 Lighting Control Systems
- 5.2.3 Security and Access Control Systems
- 5.2.3.1 Video Surveillance System
- 5.2.3.2 Access Control Systems
- 5.2.3.2.1 Card / RFID Access
- 5.2.3.2.2 Biometric Access
- 5.2.4 Energy Management Systems
- 5.2.5 Fire and Life-Safety Systems
- 5.3 By Communication Technology
- 5.3.1 Wired
- 5.3.2 Wireless
- 5.4 By Installation Type
- 5.4.1 New-Build
- 5.4.2 Retrofit
- 5.5 By End User
- 5.5.1 Residential
- 5.5.2 Commercial
- 5.5.3 Industrial
- 5.5.4 Institutional / Government
- 5.6 By Geography
- 5.6.1 North America
- 5.6.1.1 United States
- 5.6.1.2 Canada
- 5.6.1.3 Mexico
- 5.6.2 South America
- 5.6.2.1 Brazil
- 5.6.2.2 Argentina
- 5.6.3 Europe
- 5.6.3.1 Germany
- 5.6.3.2 United Kingdom
- 5.6.3.3 France
- 5.6.3.4 Rest of Europe
- 5.6.4 Asia Pacific
- 5.6.4.1 China
- 5.6.4.2 Japan
- 5.6.4.3 India
- 5.6.4.4 Rest of Asia Pacific
- 5.6.5 Middle East
- 5.6.5.1 United Arab Emirates
- 5.6.5.2 Saudi Arabia
- 5.6.5.3 Rest of Middle East
- 5.6.6 Africa
- 5.6.6.1 South Africa
- 5.6.6.2 Rest of Africa
- 5.6.1 North America
6 COMPETITIVE LANDSCAPE
- 6.1 Market Concentration
- 6.2 Strategic Moves
- 6.3 Market Share Analysis
- 6.4 Company Profiles (includes Global Level Overview, Market Level Overview, Core Segments, Financials as available, Strategic Information, Market Rank/Share, Products and Services, Recent Developments)
- 6.4.1 Honeywell International Inc.
- 6.4.2 Siemens AG
- 6.4.3 Johnson Controls International plc
- 6.4.4 Schneider Electric SE
- 6.4.5 ABB Ltd
- 6.4.6 Robert Bosch GmbH
- 6.4.7 Mitsubishi Electric Corporation
- 6.4.8 Carrier Global Corporation
- 6.4.9 Trane Technologies plc
- 6.4.10 Legrand SA
- 6.4.11 Cisco Systems Inc.
- 6.4.12 Hubbell Incorporated
- 6.4.13 Delta Controls Inc.
- 6.4.14 Lutron Electronics Co., Inc.
- 6.4.15 Crestron Electronics, Inc.
- 6.4.16 Distech Controls Inc.
- 6.4.17 Leviton Manufacturing Co., Inc.
- 6.4.18 Belimo Holding AG
- 6.4.19 Automated Logic Corporation (Carrier)
7 MARKET OPPORTUNITIES AND FUTURE OUTLOOK
- 7.1 White-Space and Unmet-Need Assessment

 大樓自動化系統市場-2026-2032年全球市場預測
 全球建築自動化與控制系統市場:機會與策略展望(至2035年)
 大樓自動化系統市場:依系統、應用和地區分類2026年全球商業建築市場報告2026年全球大樓自動化系統市場報告2026年全球建築自動化與控制系統市場報告商業建築市場:2026-2032年全球市場預測(依類型、建築風格、建築系統、建築規模及所有權狀況分類)
 KNX產品全球市場規模、佔有率、趨勢和成長分析報告(2026-2034年)建築自動化軟體市場:按組件類型、最終用戶類型、應用和部署模式分類-2026-2032年全球市場預測智慧建築自動化技術市場:按組件、連接方式、應用和最終用戶分類-2026-2032年全球預測