


 |
市場調查報告書
商品編碼
2044117
乙醇(酒精):市場佔有率分析、產業趨勢與統計、成長預測(2026-2031)Ethyl Alcohol (Ethanol) - Market Share Analysis, Industry Trends & Statistics, Growth Forecasts (2026 - 2031) |
||||||
※ 本網頁內容可能與最新版本有所差異。詳細情況請與我們聯繫。
2025 年乙醇市場價值為 1,081.2 億公升,預計到 2031 年將達到 1,484 億公升,而 2026 年為 1,139.8 億公升,預測期(2026-2031 年)複合年成長率為 5.42%。
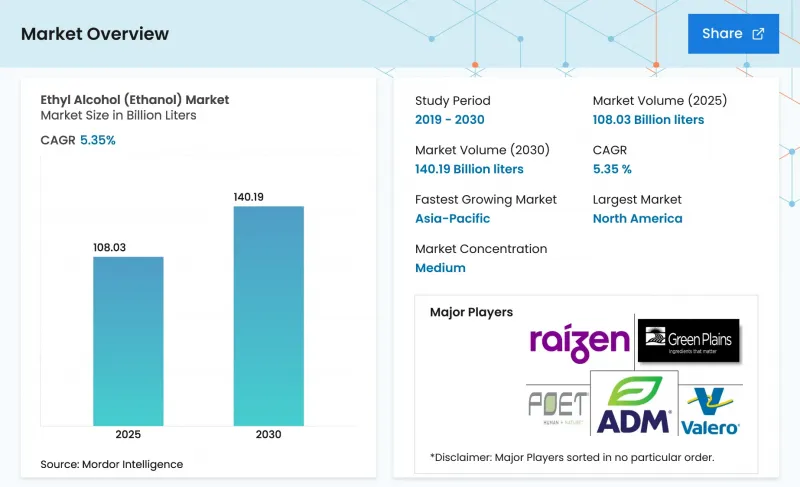
排碳權的累積正日益受到關注,加速了從乙醇向噴射機燃料的轉變,並推動了對醫藥級產品需求的激增。這些變化正在重新定義價值創造,使其不再局限於傳統的燃料混合。二氧化碳捕集與儲存(CCS)也變得日益重要,它利用了45Q信用額與美國《通貨膨脹控制法案》(IRA)規定的平均捕獲成本之間的差額。因此,中西部地區的老舊工廠正在轉型為盈利的低碳樞紐。永續航空燃料(SAF)正在獲得銷售契約,尤其是在電動車(EV)興起導致陸路運輸即將放棄供應的情況下。同時,高階個人護理品牌正在採用碳捕獲乙醇來減少範圍3排放。雖然預計到2025年北美將在供應方面佔據主導,但亞太地區正在經歷最快的成長,這主要得益於印度不斷提高的混合比例以及中國多個省份強制實施的E10乙醇汽油政策。隨著 POET、Ryzen 和中糧等行業領導者策略性地整合 CCS 管道、CBIO 溢價和 SAF 契約,競爭格局正在加劇。
全球乙醇市場趨勢與洞察
與汽油相比,成本競爭力更強
2025年初,巴西水合乙醇價格跌破通常促使駕駛員更換燃料的閾值,從而維持了國內需求。到2025年底,儘管加油站集中在中西部地區,但美國E85批發價格經能量調整後仍低於普通汽油。印度對高碳含量糖蜜乙醇的採購價格低於汽油,幫助石油分銷商在不依賴直接補貼的情況下實現摻混目標。 2026年初,玉米價格下跌降低了美國的原料成本,但也擠壓了效率較低的工廠的利潤空間。同時,巴西糖廠提高了甘蔗產量,降低了生產成本,並擴大了在加州低碳燃料標準(LCFS)市場的出口機會,該市場的信貸價格很高。
靈活燃料汽車和混合動力汽車數量增加
到2022年,美國靈活燃料汽車的數量顯著增加。然而,只有少數零售加油站提供E85乙醇汽油,使用率仍然很低。在巴西,大多數輕型汽車都是靈活燃料汽車,由於乙醇價格具有競爭力,其銷售量。在泰國,為了彌補乙醇能量密度較低的劣勢,政府在2025年推出了補貼政策,促使E20乙醇汽油的市佔率迅速成長,並增加了對乙醇汽油的需求。日本和韓國的汽車製造商正在測試與乙醇相容的混合動力傳動系統,以對沖電池供應風險,並等待高比例乙醇汽油的監管核准。菲律賓宣佈在2025年下半年實施全國性的E10乙醇汽油政策,將增加對泰國木薯乙醇的依賴,同時促進東協內部貿易。
電動車的普及將抑制對液體燃料的需求。
2024年,美國電動車銷量顯著成長,佔據了小型車市場的大部分佔有率。加州的目標是到2030年逐年降低汽油消耗量,並強制要求到2026年,零排放汽車的銷售量必須占到總銷量的相當一部分。同時,在中國,電池式電動車和插電式混合動力汽車的銷量在2025年大幅成長,佔據了乘用車市場的大部分佔有率。中國監管機構預測,汽油需求將在不久的將來達到高峰。國際能源總署(IEA)預測,到2030年,全球將有相當數量的電動車運作,按混合比例計算,其替代的汽油量相當於大量的乙醇。挪威2025年禁止內燃機的政策已經降低了乙醇的年需求量。為此,生產商正將重點放在永續航空燃料(SAF)、工業溶劑和高純度應用領域。然而,這些新的需求來源目前僅佔現有產量的一小部分,凸顯了結構性供應過剩的潛在風險。
細分市場分析
預計2026年至2031年預測期內,醫藥級乙醇的複合年成長率將達到6.12%,超過整體乙醇市場成長率。這一成長主要得益於更嚴格的標準,特別是疫苗相關要求以及對無苯產品的推動。 2025年,燃料乙醇佔總產量的68.22%,但隨著電動車的普及,其成長預計將會放緩。工業乙醇受益於亞太地區建築業對乙酸乙酯的需求。食品級乙醇市場佔有率顯著,並因其非基因改造可追溯性而保持高價。實驗室乙醇雖然是一個小眾市場,但由於美國和歐洲對生技研發的持續投入,其市場正在成長。
預計到2031年,醫藥級乙醇市場將顯著擴張,而燃料級乙醇的產量預計將以較為溫和的速度成長。主要生產商正利用美國藥典(USP)標準和非基因改造(非基因改造生物)審核。 LanzaJet的碳回收乙醇在香水供應合約中獲得了溢價,反映出市場對超低碳原料的需求日益成長。此外,受中國和韓國油漆塗料市場更嚴格的揮發性有機化合物(VOC)法規的推動,工業級乙醇的出貨量也在上升。
《乙醇市場報告》按等級(燃料級、工業級、食品級等)、終端用戶行業(汽車及交通運輸、食品飲料、製藥、化妝品及個人護理等終端用戶行業)和地區(亞太地區、北美、歐洲、南美、中東和非洲)進行細分。市場預測以公升為單位。
區域分析
2025年,北美佔全球總量的33.36%,主要得益於強制性可再生燃料標準(RFS)。美國作為區域供應的主要支撐國,擁有強大的生產能力,許多工廠計劃在2028年前透過引入二氧化碳捕集與儲存(CCS)技術來提高獲利能力。在加拿大,將於2025年生效的聯邦無污染燃料法規旨在提高全國範圍內的乙醇摻混比例,但目前的產量仍然小規模。在墨西哥,由於2025年對汽油中乙醇的摻混比例設定了上限,因此對美國進口乙醇的需求得以維持。
預計亞太地區在2026年至2031年的預測期內將以6.51%的複合年成長率成長,其乙醇市場佔有率預計將擴大。在2024-2025供應年度,印度大量採購乙醇,實現了相當高的摻混率,並計劃在2028年實現全國範圍的推廣。中國的E10舉措正在多個省份實施,預計2025年玉米衍生乙醇的消費量將大幅成長,但全國的推廣取決於玉米價格的穩定性。東協的乙醇消費主要依賴鄰國的進口,並受到泰國木薯衍生汽油醇和菲律賓新實施的E10強制令的推動。
在南美洲,2025年巴西產量的大幅成長以及RenovaBio在2026年提高的CBIO目標,都顯著推動了南美地區的成長。 Raizen和Copersucar管線的建設,簡化了從糖廠到沿海出口碼頭的物流,擴大了加州低碳燃料標準(LCFS)和歐洲永續航空燃料(SAF)強制令帶來的套利機會。儘管歐洲在2025年的市佔率仍然較小,但德國和法國已成為主要市場。需求轉變正在持續,這主要得益於RED III對纖維素和廢棄物衍生乙醇的偏好,以及合格。在面積最小的中東和非洲地區,沙烏地阿拉伯一個利用椰棗廢棄物的先導計畫展現出良好的前景,預示著2028年後可能出現新的原料。
其他好處:
- Excel格式的市場預測(ME)表
- 3個月的分析師支持
目錄
第1章:引言
- 研究假設和市場定義
- 調查範圍
第2章:調查方法
第3章執行摘要
第4章 市場狀況
- 市場概覽
- 市場促進因素
- 與汽油相比,成本競爭力更強
- 靈活燃料汽車和混合動力汽車數量增加
- SAF供應鏈中乙醇製航空煤油(ETJ)路線的發展動能。
- 透過碳捕獲、利用與封存(CCUS)技術累積排碳權,進而改善工廠的經濟效益。
- 供應生物基二氧化碳,以支持電子甲醇和合成燃料項目。
- 市場限制因素
- 電動車的普及將抑制對液體燃料的需求。
- 對用水足跡的監測力道加大,導致工廠的授權更加嚴格。
- 圍繞土地用途變更的爭議正引起ESG投資者的強烈反對。
- 價值鏈分析
- 波特五力模型
- 供應商的議價能力
- 買方的議價能力
- 新進入者的威脅
- 替代品的威脅
- 競爭程度
第5章 市場規模與成長預測
- 按年級
- 燃料等級
- 工業級
- 食品級
- 醫藥級
- 實驗室級
- 按最終用戶行業分類
- 汽車和交通運輸
- 食品/飲料
- 製藥
- 化妝品和個人護理
- 其他終端用戶產業
- 按地區
- 亞太地區
- 中國
- 印度
- 日本
- 韓國
- 東南亞國協
- 亞太其他地區
- 北美洲
- 美國
- 加拿大
- 墨西哥
- 歐洲
- 德國
- 英國
- 法國
- 義大利
- 俄羅斯
- 北歐國家
- 其他歐洲地區
- 南美洲
- 巴西
- 阿根廷
- 南美洲其他地區
- 中東和非洲
- 沙烏地阿拉伯
- 南非
- 其他中東和非洲
- 亞太地區
第6章 競爭情勢
- 市場集中度
- 策略趨勢
- 市佔率(%)/排名分析
- 公司簡介
- Abengoa
- ADM
- Advanced BioEnergy LLC
- BP plc
- Cargill, Incorporated
- Copersucar
- Flint Hills Resources
- Gevo, Inc.
- Green Plains Inc.
- HBL
- INEOS
- POET, LLC
- Raizen
- Sasol
- Tereos
- Thai Bioethanol Co.
- The Andersons Inc.
- Triveni Engineering & Industries Ltd.
- Ubon Bio Ethanol Public Company Limited
- Valero Energy Corporation
第7章 市場機會與未來展望
The Ethyl Alcohol Market size was valued at 108.12 billion liters in 2025 and is estimated to grow from 113.98 billion liters in 2026 to reach 148.40 billion liters by 2031, at a CAGR of 5.42% during the forecast period (2026-2031).
Carbon-credit stacking is gaining traction, ethanol-to-jet pathways are accelerating, and there is a surging demand for pharmaceutical-grade products. These shifts are redefining value creation, moving beyond the traditional focus on fuel blending. Carbon capture and sequestration (CCS) is gaining prominence, leveraging the gap between the U.S. Inflation Reduction Act's 45Q credit and average capture costs. Consequently, older Midwest plants have evolved into profitable low-carbon hubs. Sustainable aviation fuel (SAF) is securing offtake agreements, absorbing volumes that road transport may soon relinquish, particularly due to the rise of electric vehicles (EVs). Concurrently, luxury personal-care brands are adopting carbon-captured ethanol to mitigate their Scope 3 emissions. By 2025, North America is expected to dominate supply; however, the Asia-Pacific region is witnessing the fastest growth, driven by rising blending rates in India and China's provincial E10 mandates. The competitive landscape is intensifying, with industry leaders such as POET, Raizen, and COFCO strategically aligning with CCS pipelines, CBIO premiums, and SAF contracts.
Global Ethyl Alcohol (Ethanol) Market Trends and Insights
Cost Competitiveness Versus Gasoline
In early 2025, Brazilian hydrous ethanol traded below the threshold that typically drives drivers to switch fuels, thus maintaining domestic demand. In late 2025, U.S. wholesale E85 was cheaper than regular gasoline on an energy-adjusted basis, despite the concentration of pumps in the Midwest. India set its C-heavy molasses ethanol procurement price lower than gasoline, aiding oil-marketing companies in achieving the blend target without resorting to direct subsidies. In early 2026, corn prices decreased, alleviating U.S. feedstock costs but tightening margins for less-efficient plants. Concurrently, Brazilian mills boosted cane yields, reducing production costs and enhancing export opportunities in California's Low Carbon Fuel Standard market, where credits were high.
Growing Flex-Fuel and Hybrid Vehicle Fleet
By 2022, the United States had a significant number of flex-fuel vehicles. However, only a small fraction of retail stations offered E85, leading to a low utilization rate. In Brazil, where most of the light-vehicle fleet is flex-fuel, ethanol outsold gasoline for several months in 2025 when price parity favored the biofuel. Thailand's gasohol demand increased in 2025, with E20 rapidly capturing market share, thanks to subsidies countering energy-density drawbacks. Japanese and South Korean automakers are testing ethanol-compatible hybrid powertrains as a hedge against battery supply risks and are awaiting regulatory approval for higher blends. The Philippines announced a nationwide E10 policy in late 2025, increasing reliance on Thai cassava-ethanol imports and bolstering intra-ASEAN trade.
EV Adoption Curbing Liquid-Fuel Demand
In 2024, U.S. electric vehicle (EV) sales increased significantly, capturing a substantial share of the light-duty vehicle market. California mandated that a considerable portion of sales transition to zero-emission vehicles by 2026, aiming to reduce gasoline consumption annually by 2030. Meanwhile, in China, 2025 witnessed a significant rise in sales of battery-electric and plug-in hybrid vehicles, which accounted for a substantial share of the passenger-car market. Regulators in China predict that gasoline demand will peak in the near future. The International Energy Agency (IEA) forecasts that by 2030, a substantial number of EVs will be operational globally, displacing a significant volume of gasoline, equivalent to a large amount of ethanol at a blended rate. Norway's 2025 ban on internal combustion engines has already resulted in a reduction in annual ethanol demand. In response, producers are shifting their focus to sustainable aviation fuel (SAF), industrial solvents, and high-purity applications. However, these new outlets currently account for only a small portion of the existing volume, highlighting a potential structural surplus risk.
Other drivers and restraints analyzed in the detailed report include:
- Ethanol-to-Jet Pathway Momentum in SAF Supply Chains
- CCUS Integration Enhancing Plant Economics Via Carbon-Credit Stacking
- Water-Use Footprint Scrutiny Tightening Plant Permitting
For complete list of drivers and restraints, kindly check the Table Of Contents.
Segment Analysis
Pharmaceutical-grade ethanol is projected to grow at a 6.12% CAGR during the forecast period of 2026-2031, outpacing the broader Ethyl Alcohol Market. This growth is largely attributed to heightened specifications, particularly those related to vaccines and the push for benzene-free products. While fuel-grade ethanol accounted for 68.22% of the 2025 volume, its growth is expected to slow due to the rising adoption of electric vehicles (EVs). Industrial-grade ethanol, is benefiting from the Asia-Pacific construction sector's demand for ethyl acetate. Food-grade ethanol, with its notable market presence, enjoys a premium price tag due to its non-GMO traceability. Lab-grade ethanol, though a niche segment, is experiencing growth, fueled by steady biotech research and development investments in the United States and Europe.
The market for pharmaceutical-grade ethyl alcohol is poised for a significant upswing by 2031, while fuel-grade volumes are set to grow at a more moderate rate. Premium producers are capitalizing on United States Pharmacopeia standards and non-GMO audits. LanzaJet's carbon-captured ethanol, highlighting the rising demand for ultra-low-carbon feedstocks, secured a premium price in perfume supply contracts. Furthermore, industrial-grade volumes are climbing, spurred by tightening volatile-organic-compound caps in the paints and coatings markets of China and South Korea.
The Ethyl Alcohol (Ethanol) Market Report is Segmented by Grade (Fuel Grade, Industrial Grade, Food Grade, and More), End-User Industry (Automotive and Transportation, Food and Beverage, Pharmaceuticals, Cosmetics and Personal Care, and Other End-User Industries), and Geography (Asia-Pacific, North America, Europe, South America, and Middle-East and Africa). The Market Forecasts are Provided in Terms of Volume (Liters).
Geography Analysis
In 2025, North America commanded 33.36% of the global volume, supported by the Renewable Fuel Standard's mandates. The United States, anchoring the regional supply, has a robust production capacity, with many plants targeting improved margins through CCS adoption by 2028. Canada's federal clean-fuel regulation, effective in 2025, aims to boost nationwide ethanol blends, though current volumes remain modest. Mexico, in 2025, capped ethanol in gasoline, leading to sustained import demand from the United States.
The Asia-Pacific region is projected to grow at a 6.51% CAGR through the 2026-2031 forecast period, with its Ethyl Alcohol Market Share set to expand. In the 2024-2025 supply year, India made significant ethanol purchases, achieving a notable blend and aiming for a nationwide increase by 2028. China's E10 initiative, active in several provinces, consumed a large volume of corn ethanol in 2025, but its nationwide expansion depends on stabilizing corn prices. ASEAN's consumption, bolstered by imports from regional neighbors, has been driven by Thailand's cassava-derived gasohol and the Philippines' new E10 mandate.
South America, in 2025, saw a significant boost from Brazil's output and RenovaBio's rising CBIO targets for 2026. Logistics from mills to coastal export terminals, streamlined by Raizen and Copersucar pipelines, enhance arbitrage opportunities with California's LCFS and Europe's SAF mandates. Europe, while accounting for a smaller share in 2025, saw Germany and France emerge as key markets. With RED III now favoring cellulosic and waste-based ethanol, demand is shifting, especially with double-counting eligibility. The Middle-East and Africa, the smallest region, are eyeing potential in Saudi Arabian pilot projects harnessing date-palm waste, suggesting new feedstock possibilities post-2028.
- Abengoa
- ADM
- Advanced BioEnergy LLC
- BP p.l.c.
- Cargill, Incorporated
- Copersucar
- Flint Hills Resources
- Gevo, Inc.
- Green Plains Inc.
- HBL
- INEOS
- POET, LLC
- Raizen
- Sasol
- Tereos
- Thai Bioethanol Co.
- The Andersons Inc.
- Triveni Engineering & Industries Ltd.
- Ubon Bio Ethanol Public Company Limited
- Valero Energy Corporation
Additional Benefits:
- The market estimate (ME) sheet in Excel format
- 3 months of analyst support
TABLE OF CONTENTS
1 Introduction
- 1.1 Study Assumptions and Market Definition
- 1.2 Scope of the Study
2 Research Methodology
3 Executive Summary
4 Market Landscape
- 4.1 Market Overview
- 4.2 Market Drivers
- 4.2.1 Cost competitiveness versus gasoline
- 4.2.2 Growing flex-fuel and hybrid vehicle fleet
- 4.2.3 Ethanol-to-jet (ETJ) pathway momentum in SAF supply chains
- 4.2.4 CCUS integration enhancing plant economics via carbon-credit stacking
- 4.2.5 Biogenic CO2 supply enabling e-methanol and syn-fuel projects
- 4.3 Market Restraints
- 4.3.1 EV adoption curbing liquid-fuel demand
- 4.3.2 Water-use footprint scrutiny tightening plant permitting
- 4.3.3 Land-use change controversies triggering ESG investor push-back
- 4.4 Value Chain Analysis
- 4.5 Porter's Five Forces
- 4.5.1 Bargaining Power of Suppliers
- 4.5.2 Bargaining Power of Buyers
- 4.5.3 Threat of New Entrants
- 4.5.4 Threat of Substitutes
- 4.5.5 Degree of Competition
5 Market Size and Growth Forecasts (Volume)
- 5.1 By Grade
- 5.1.1 Fuel Grade
- 5.1.2 Industrial Grade
- 5.1.3 Food Grade
- 5.1.4 Pharmaceutical Grade
- 5.1.5 Lab Grade
- 5.2 By End-user Industry
- 5.2.1 Automotive and Transportation
- 5.2.2 Food and Beverage
- 5.2.3 Pharmaceuticals
- 5.2.4 Cosmetics and Personal Care
- 5.2.5 Other End-user Industries
- 5.3 By Geography
- 5.3.1 Asia-Pacific
- 5.3.1.1 China
- 5.3.1.2 India
- 5.3.1.3 Japan
- 5.3.1.4 South Korea
- 5.3.1.5 ASEAN Countries
- 5.3.1.6 Rest of Asia-Pacific
- 5.3.2 North America
- 5.3.2.1 United States
- 5.3.2.2 Canada
- 5.3.2.3 Mexico
- 5.3.3 Europe
- 5.3.3.1 Germany
- 5.3.3.2 United Kingdom
- 5.3.3.3 France
- 5.3.3.4 Italy
- 5.3.3.5 Russia
- 5.3.3.6 NORDIC Countries
- 5.3.3.7 Rest of Europe
- 5.3.4 South America
- 5.3.4.1 Brazil
- 5.3.4.2 Argentina
- 5.3.4.3 Rest of South America
- 5.3.5 Middle-East and Africa
- 5.3.5.1 Saudi Arabia
- 5.3.5.2 South Africa
- 5.3.5.3 Rest of Middle-East and Africa
- 5.3.1 Asia-Pacific
6 Competitive Landscape
- 6.1 Market Concentration
- 6.2 Strategic Moves
- 6.3 Market Share(%)/Ranking Analysis
- 6.4 Company Profiles (includes Global Overview, Market Overview, Core Segments, Financials, Strategic Information, Products and Services, Recent Developments)
- 6.4.1 Abengoa
- 6.4.2 ADM
- 6.4.3 Advanced BioEnergy LLC
- 6.4.4 BP p.l.c.
- 6.4.5 Cargill, Incorporated
- 6.4.6 Copersucar
- 6.4.7 Flint Hills Resources
- 6.4.8 Gevo, Inc.
- 6.4.9 Green Plains Inc.
- 6.4.10 HBL
- 6.4.11 INEOS
- 6.4.12 POET, LLC
- 6.4.13 Raizen
- 6.4.14 Sasol
- 6.4.15 Tereos
- 6.4.16 Thai Bioethanol Co.
- 6.4.17 The Andersons Inc.
- 6.4.18 Triveni Engineering & Industries Ltd.
- 6.4.19 Ubon Bio Ethanol Public Company Limited
- 6.4.20 Valero Energy Corporation
7 Market Opportunities and Future Outlook
- 7.1 White-space and Unmet-Need Assessment


