


 |
市場調查報告書
商品編碼
2044087
互動式顯示器:市場佔有率分析、行業趨勢和統計數據、成長預測(2026-2031 年)Interactive Display - Market Share Analysis, Industry Trends & Statistics, Growth Forecasts (2026 - 2031) |
||||||
※ 本網頁內容可能與最新版本有所差異。詳細情況請與我們聯繫。
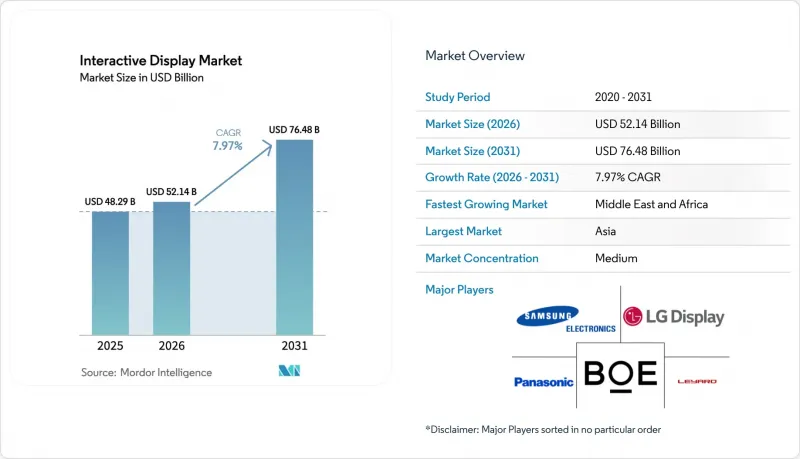
預計互動顯示市場將從 2025 年的 482.9 億美元成長到 2026 年的 521.4 億美元,到 2031 年達到 764.8 億美元,2026 年至 2031 年的複合年成長率為 7.97%。
這一成長主要得益於混合辦公模式的普及、智慧城市的部署以及觸控技術的穩定發展,這些技術提升了數位表面的反應速度、亮度和能源效率。教育、企業協作和消費者自助服務仍然是最大的收入來源,但醫療保健領域的資訊顯示和公共交通乘客資訊系統正在成為新的需求來源。面板製造商(尤其是中國製造商)的整合正在改變供應鏈的議價能力,使買家能夠以更低的單價獲得更大、更高解析度的螢幕。同時,能源價格上漲推高了玻璃價格,加上半導體供應的不確定性,導致整體擁有成本 (TCO) 上升,促使一些買家尋求將生命週期服務與硬體捆綁銷售的供應商。
全球互動顯示器市場趨勢與洞察
在北美各地的混合式教室中推廣使用互動式平板顯示器
獲得聯邦技術津貼的學區正在用觸控面板取代白板,以實現遠距學生和課堂學生學習的同步。這些面板在課程交付中發揮核心作用,能夠無縫切換雲端學習平台和課堂資源。 SMART Technologies 進入印度市場表明,製造商正在對硬體和內容進行在地化,以適應更廣泛的課程體系,從而降低預算敏感型教育機構的採購門檻。教育領域的這些應用正在延長軟體更新周期,並鞏固軟體訂閱協議,從而提升供應商的終身收入。
歐洲零售業對自助式互動資訊亭的需求正在加速成長。
人手不足和消費者對非接觸式結帳的偏好迫使歐洲零售商部署自助服務終端,全天候處理訂單、付款、調查和忠誠度計畫註冊等業務。這些終端機配備的多語言選單使他們無需增加人手即可拓展客戶群。飯店業也使用同樣的硬體提案客房升級和在地體驗服務,這充分展現了觸控式自助服務的跨產業效用。
新興市場大型互動牆的總擁有成本較高
硬體成本僅佔五年內多面板牆總成本的一半。安裝、軟體和服務成本使總成本翻倍。面板製造商在2025年5月削減產能表明,供應商正試圖在關稅不確定性的情況下保護其利潤率,這限制了買家獲得折扣的空間。此外,當預算與當地競標價格掛鉤時,外匯波動會增加最終成本,從而延緩經合組織國家以外學校和辦公室的部署。
細分市場分析
到2025年,互動式平板顯示器將佔銷售額的87.45%,憑藉其便利的壁掛安裝和熟悉的使用者介面,仍將是教室、會議室和零售洽談區的首選。供應商將白板、視訊會議和設備投屏應用程式捆綁銷售,以最大限度地減少培訓時間,並透過提供承包協作中心的硬體來證明高價服務合約的合理性。隨著相關人員要求在面授和遠距學習之間無縫切換,平板顯示器作為基礎設施支柱的作用正日益受到重視。
互動式自助服務終端正以8.28%的複合年成長率成為成長最快的細分市場,其成長主要得益於旅館業的自助入住和快餐店的點餐服務。同時,電視牆正逐漸應用於安保指揮中心等數據密集型環境,而互動式桌則在博物館和設計工作室等場所普及,方便多位用戶同時在水平佈局上協作。鏡子和其他新興形式的互動顯示設備正在拓展互動式顯示市場在實體空間的應用範圍,例如虛擬試衣間和建築指示牌。
預計到2025年,液晶顯示器(LCD)將佔總銷售額的61.22%,這得益於規模經濟和成熟的供應商生態系統。儘管如此,直視型LED顯示器(DirectView LED)預計將以9.34%的複合年成長率成長,反映消費者對無邊框螢幕、高亮度和更低營運成本的需求。 OLED仍然是高階之選,尤其是在對比度和色彩還原度比價格更重要的應用領域,例如影音工作室和高階零售店。
儘管投影和DLP顯示器仍在大型禮堂和類似場所中使用,但燈泡更換頻繁以及對環境光敏感等問題限制了它們的長期競爭力。鈣鈦礦LED的研究表明,更薄、更便宜且整合觸控功能的產品有望在未來十年重塑互動式顯示器市場。
《互動式顯示器市場報告》按顯示器類型(互動式資訊亭、互動式電視牆等)、技術(LCD、OLED 等)、觸控感應技術(紅外線、電容式等)、面板尺寸(32 吋以下、32-65 吋、65 吋以上)、面板方向(橫向、縱向)、使用者產業(教育等)及終端地區進行細分。市場預測以美元 (USD) 為單位。
區域分析
亞太地區憑藉一體化的供應鏈和積極的產能擴張(例如京東方在成都投資90億美元建設的第八代.6代AMOLED工廠),預計到2025年將佔全球銷售額的32.85%。日本和韓國擁有取得專利的製程技術,而印度對本地組裝的優惠政策正吸引全球品牌與印度企業建立夥伴關係。教室和企業園區等國內市場需求的成長進一步鞏固了該地區互動顯示器市場的地位。
北美持續發揮影響力,這主要得益於混合辦公室軟體和雲端生態系的發展,這些軟體和生態系統需要觸控螢幕來進行腦力激盪和分析。聯邦和州政府的津貼正在推動學校的影音設備升級,而美國企業也始終是新型協作功能的早期採用者。供應鏈的韌性至關重要,為了配合回流政策,一些面板製造商正在多元化經營到亞洲以外的地區。
在歐洲,自助服務、環保營運和醫療保健數位化備受重視。零售商正在引入自助服務終端以應對人手不足,而斯堪的納維亞半島的醫院則率先採用引導介面來緩解前台堵塞。此外,嚴格的能源法規也促使消費者轉向低功耗LED燈具。
中東和非洲地區正以9.55%的複合年成長率推動成長,預計到2031年將實現這一目標。這主要得益於數十億美元的智慧城市項目,這些項目將互動式螢幕整合到交通候車區、文化區和電子政府網站中。惡劣的氣候條件要求螢幕具備高亮度、封閉式機殼,這為提供性能可靠的產品的供應商創造了高利潤率。
南美洲的基礎設施現代化正在穩步推進,機場和地鐵等交通樞紐紛紛採用乘客資訊顯示器來最佳化交通流量並增加收入。都市化和旅遊業的蓬勃發展推動了市政預算的增加,用於這些升級改造,但外匯波動可能會導致訂單延遲。
其他好處:
- Excel格式的市場預測(ME)表
- 3個月的分析師支持
目錄
第1章:引言
- 研究假設和市場定義
- 調查範圍
第2章:調查方法
第3章執行摘要
第4章 市場狀況
- 市場概覽
- 市場促進因素
- 在北美各地的混合式教室中推廣使用互動式平板顯示器
- 歐洲零售業對自助式互動資訊亭的需求正在加速成長。
- 引領亞太地區總部採用互動式電視牆:滿足企業的數位協作需求。
- 政府智慧城市計畫旨在促進中東地區的戶外互動展示
- 在南美洲各地的交通樞紐擴大互動式乘客資訊顯示器的部署。
- 北歐國家醫療機構中互動式路線引導解決方案的激增
- 市場限制因素
- 新興市場大型互動牆的總擁有成本較高
- 半導體積體電路供應鏈受限,影響觸控控制器的供應
- 新冠疫情後時代加勒比海和非洲地區公共觸控螢幕的健康和衛生問題
- 在銀行、金融服務和保險 (BFSI) 行業中,與傳統音影片/ IT基礎設施整合的複雜性
- 產業生態系分析
- 技術展望
- 波特五力分析
- 供應商的議價能力
- 買方的議價能力
- 新進入者的威脅
- 替代品的威脅
- 競爭公司之間的競爭
第5章 市場規模與成長預測
- 顯示類型
- 互動資訊亭
- 互動電視牆
- 互動式白板
- 互動式平板顯示器
- 互動桌
- 互動鏡
- 其他顯示類型
- 透過技術
- LCD
- LED(直視型)
- OLED
- 投影和DLP
- 電子紙及其他新興領域
- 觸摸感應技術
- 紅外線的
- 電容式
- 電阻型
- 光學成像
- 聲波及其他
- 按面板尺寸
- 最大可達 32 英寸
- 32英寸至65英寸
- 65吋或更大
- 面板方向
- 水平的
- 垂直的
- 最終用戶
- 教育
- 公司/企業
- 零售和酒店
- 運輸/物流
- 衛生保健
- 銀行、金融服務和保險(BFSI)
- 工業和製造業
- 體育和娛樂設施
- 政府/國防
- 其他行業
- 按地區
- 北美洲
- 美國
- 加拿大
- 墨西哥
- 歐洲
- 德國
- 英國
- 法國
- 北歐國家
- 其他歐洲地區
- 南美洲
- 巴西
- 南美洲其他地區
- 亞太地區
- 中國
- 日本
- 印度
- 東南亞
- 亞太其他地區
- 中東和非洲
- 中東
- GCC
- 土耳其
- 其他中東國家
- 非洲
- 南非
- 其他非洲地區
- 中東
- 北美洲
第6章 競爭情勢
- 市場集中度
- 策略趨勢
- 市佔率分析
- 公司簡介
- Samsung Electronics Co., Ltd.
- LG Display Co., Ltd.
- BOE Technology Group Co., Ltd.
- Panasonic Corporation
- Leyard Optoelectronic Co., Ltd.
- Sharp NEC Display Solutions, Ltd.
- ViewSonic Corporation
- Planar Systems, Inc.
- SMART Technologies ULC
- Promethean World Ltd.
- Newline Interactive, Inc.
- Elo Touch Solutions, Inc.
- BenQ Corporation
- Delta Electronics, Inc.(Vivitek)
- Christie Digital Systems USA, Inc.
- AU Optronics Corp.
- Advantech Co., Ltd.
- Boxlight Corporation
- Horizon Display, Inc.
- Baanto International Ltd.
- Intuiface(IntuiLab SAS)
- CLEVERTOUCH(Boxlight)
- Kiosk Information Systems
- GestureTek Systems, Inc.
- KT Corporation(Digico)
第7章 市場機會與未來展望
The Interactive Display Market size is expected to increase from USD 48.29 billion in 2025 to USD 52.14 billion in 2026 and reach USD 76.48 billion by 2031, growing at a CAGR of 7.97% over 2026-2031.
Growth is underpinned by hybrid work adoption, smart-city roll-outs, and steady advances in touch-sensing that make digital surfaces more responsive, brighter, and energy-efficient. Education, corporate collaboration, and public-facing self-service remain the largest revenue pools, yet healthcare way-finding and transport passenger-information systems are adding fresh demand streams. Consolidation among panel makers, especially in China, is shifting bargaining power along the supply chain and giving buyers access to larger, higher-resolution screens at lower unit cost. At the same time, energy-driven increases in glass pricing, plus fragile semiconductor supplies, are nudging total cost of ownership higher, steering some buyers toward vendors that bundle lifecycle services with hardware.
Global Interactive Display Market Trends and Insights
Growing Adoption of Interactive Flat Panels in Hybrid Classrooms Across North America
School districts that received federal technology grants are replacing whiteboards with touch-enabled panels to keep remote and in-class learners on the same page. Seamless switching between cloud learning platforms and classroom resources makes the panels the centerpiece of lesson delivery. SMART Technologies' India expansion signals how producers now localize hardware and content for broader curricula, lowering procurement friction for budget-sensitive institutions. These education deployments lengthen replacement cycles and lock in software subscriptions-effects that lift lifetime revenue for vendors.
Retail Demand for Self-Service Interactive Kiosks Accelerating in Europe
Labor shortages and consumer preference for contact-free check-out are pushing European retailers to install kiosks that handle ordering, payments, survey capture, and loyalty enrollment around the clock. Kiosks' multilingual menus widen customer reach without extra staffing. Hospitality operators use the same hardware for upselling room upgrades and local experiences, demonstrating the cross-sector usefulness of touch-based self-service.
High Total Cost of Ownership for Large-Format Interactive Walls in Emerging Economies
Hardware expenses only account for half of a multi-panel wall over five years; installation, software, and service double the bill. May 2025 capacity cuts among panel makers show vendors protecting margins amid tariff uncertainty, limiting discount room for buyers. Currency swings also raise landed costs where budgets are pegged to local tenders, slowing adoption in schools and offices outside the OECD.
Other drivers and restraints analyzed in the detailed report include:
- Corporate Digital Collaboration Needs Driving Interactive Video Walls in Asia-Pacific Headquarters
- Government Smart-City Initiatives Boosting Outdoor Interactive Displays in the Middle East
- Supply-Chain Constraints of Semiconductor ICs Affecting Touch-Controller Availability
For complete list of drivers and restraints, kindly check the Table Of Contents.
Segment Analysis
Interactive flat panels generated 87.45% of revenue in 2025 and remain the default choice for classrooms, meeting rooms, and retail huddle zones thanks to wall-mount simplicity and familiar user interfaces. Vendors bundle whiteboard, video-conferencing, and device-casting apps to minimize training time, turning the hardware into a turnkey collaboration hub that justifies premium service contracts. As educators require seamless transitions between on-site and remote lessons, the panels' role as backbone infrastructure strengthens budget priority.
Interactive kiosks constitute the speediest niche at an 8.28% CAGR, powered by hospitality self-check-in and quick-service restaurant ordering. Meanwhile, video walls address data-rich settings such as security command centers, and interactive tables gain a foothold in museums and design studios where multiple users work simultaneously on horizontal layouts. Mirrors and other emerging forms unlock virtual try-on and architectural signage, expanding where and how the interactive display market appears in physical spaces.
LCD accounted for 61.22% revenue in 2025, leveraging economies of scale and a well-established supplier ecosystem. Nevertheless, direct-view LED's 9.34% CAGR reflects buyer appetite for bezel-free canvases, higher brightness, and lower operating cost. OLED stays a premium option where contrast and color fidelity trump price, notably in studio and luxury retail.
Projection and DLP still serve extra-large auditoria, yet lamp replacement and ambient-light sensitivity curb long-run competitiveness. Research into perovskite LEDs hints at thinner, cheaper, and integrated touch possibilities that could re-shape the interactive display market over the next decade.
The Interactive Display Market Report is Segmented by Display Type (Interactive Kiosk, Interactive Video Wall, and More), Technology (LCD, OLED, and More), Touch-Sensing Technology (Infrared, Capacitive, and More), Panel Size (Up To 32", 32" - 65", and Above 65"), Panel Orientation (Landscape, and Portrait), End-User Vertical (Education, and More), and Geography. The Market Forecasts are Provided in Terms of Value USD.
Geography Analysis
Asia-Pacific generated 32.85% of 2025 revenue, supported by integrated supply chains and aggressive capacity expansions such as BOE's USD 9 billion Gen-8.6 AMOLED plant in Chengdu. Japan and South Korea add patented process know-how, while India's incentives for local assembly are drawing global brands to in-country partnerships. Growing domestic consumption across classrooms and corporate campuses further anchors the interactive display market in the region.
North America stays influential on the back of hybrid-work software and cloud ecosystems that depend on touch-enabled surfaces for brainstorming and analytics. Federal and provincial grants keep schools refreshing AV gear, and U.S. enterprises remain early buyers of novel collaboration features. Supply-chain resilience is a priority, prompting some panel makers to diversify beyond Asia in line with reshoring policies.
Europe emphasizes self-service, green operations, and healthcare digitalization. Retailers deploy kiosks to cope with staffing shortages, while Nordic hospitals pioneer way-finding interfaces that cut check-in congestion. Strict energy codes also push buyers toward low-power LED models.
The Middle East and Africa lead growth at 9.55% CAGR to 2031, fueled by multibillion-dollar smart-city programs that embed interactive screens into transit shelters, cultural districts, and e-government counters. Harsh climate prompts high-brightness, sealed enclosures, creating premium margin potential for vendors with rugged options.
South America is on an infrastructure modernizing curve where airports and metros rely on passenger-information displays to streamline traffic and revenue. Urbanization and tourism lift municipal budgets for such upgrades, though currency volatility can delay orders.
- Samsung Electronics Co., Ltd.
- LG Display Co., Ltd.
- BOE Technology Group Co., Ltd.
- Panasonic Corporation
- Leyard Optoelectronic Co., Ltd.
- Sharp NEC Display Solutions, Ltd.
- ViewSonic Corporation
- Planar Systems, Inc.
- SMART Technologies ULC
- Promethean World Ltd.
- Newline Interactive, Inc.
- Elo Touch Solutions, Inc.
- BenQ Corporation
- Delta Electronics, Inc. (Vivitek)
- Christie Digital Systems USA, Inc.
- AU Optronics Corp.
- Advantech Co., Ltd.
- Boxlight Corporation
- Horizon Display, Inc.
- Baanto International Ltd.
- Intuiface (IntuiLab SAS)
- CLEVERTOUCH (Boxlight)
- Kiosk Information Systems
- GestureTek Systems, Inc.
- KT Corporation (Digico)
Additional Benefits:
- The market estimate (ME) sheet in Excel format
- 3 months of analyst support
TABLE OF CONTENTS
1 INTRODUCTION
- 1.1 Study Assumptions and Market Definition
- 1.2 Scope of the Study
2 RESEARCH METHODOLOGY
3 EXECUTIVE SUMMARY
4 MARKET LANDSCAPE
- 4.1 Market Overview
- 4.2 Market Drivers
- 4.2.1 Growing Adoption of Interactive Flat Panels in Hybrid Classrooms Across North America
- 4.2.2 Retail Demand for Self-Service Interactive Kiosks Accelerating in Europe
- 4.2.3 Corporate Digital Collaboration Needs Driving Interactive Video Walls in Asia-Pacific Headquarters
- 4.2.4 Government Smart-City Initiatives Boosting Outdoor Interactive Displays in the Middle East
- 4.2.5 Increasing Deployment of Interactive Passenger Information Displays in Transportation Hubs Across South America
- 4.2.6 Surge in Interactive Way-finding Solutions within Healthcare Facilities in Nordic Countries
- 4.3 Market Restraints
- 4.3.1 High Total Cost of Ownership for Large-Format Interactive Walls in Emerging Economies
- 4.3.2 Supply-Chain Constraints of Semiconductor ICs Affecting Touch-Controller Availability
- 4.3.3 Health and Hygiene Concerns over Public Touchscreens Post-COVID in the Caribbeans and Africa
- 4.3.4 Integration Complexity with Legacy AV/IT Infrastructure in BFSI Sector
- 4.4 Industry Ecosystem Analysis
- 4.5 Technological Outlook
- 4.6 Porter's Five Forces Analysis
- 4.6.1 Bargaining Power of Suppliers
- 4.6.2 Bargaining Power of Buyers
- 4.6.3 Threat of New Entrants
- 4.6.4 Threat of Substitutes
- 4.6.5 Intensity of Competitive Rivalry
5 MARKET SIZE AND GROWTH FORECASTS (VALUES)
- 5.1 By Display Type
- 5.1.1 Interactive Kiosk
- 5.1.2 Interactive Video Wall
- 5.1.3 Interactive Whiteboard
- 5.1.4 Interactive Flat Panel
- 5.1.5 Interactive Table
- 5.1.6 Interactive Mirror
- 5.1.7 Other Display Types
- 5.2 By Technology
- 5.2.1 LCD
- 5.2.2 LED (Direct-View)
- 5.2.3 OLED
- 5.2.4 Projection and DLP
- 5.2.5 ePaper and Other Emerging
- 5.3 By Touch-Sensing Technology
- 5.3.1 Infrared
- 5.3.2 capacitive
- 5.3.3 Resistive
- 5.3.4 Optical Imaging
- 5.3.5 Acoustic Wave and Others
- 5.4 By Panel Size
- 5.4.1 Up to 32"
- 5.4.2 32" - 65"
- 5.4.3 Above 65"
- 5.5 By Panel Orientation
- 5.5.1 Landscape
- 5.5.2 Portrait
- 5.6 By End-user Vertical
- 5.6.1 Education
- 5.6.2 Corporate and Enterprise
- 5.6.3 Retail and Hospitality
- 5.6.4 Transportation and Logistics
- 5.6.5 Healthcare
- 5.6.6 Banking, Financial Services and Insurance (BFSI)
- 5.6.7 Industrial and Manufacturing
- 5.6.8 Sports and Entertainment Venues
- 5.6.9 Government and Defense
- 5.6.10 Other Verticals
- 5.7 By Geography
- 5.7.1 North America
- 5.7.1.1 United States
- 5.7.1.2 Canada
- 5.7.1.3 Mexico
- 5.7.2 Europe
- 5.7.2.1 Germany
- 5.7.2.2 United Kingdom
- 5.7.2.3 France
- 5.7.2.4 Nordics
- 5.7.2.5 Rest of Europe
- 5.7.3 South America
- 5.7.3.1 Brazil
- 5.7.3.2 Rest of South America
- 5.7.4 Asia Pacific
- 5.7.4.1 China
- 5.7.4.2 Japan
- 5.7.4.3 India
- 5.7.4.4 South East Asia
- 5.7.4.5 Rest of Asia Pacific
- 5.7.5 Middle East and Africa
- 5.7.5.1 Middle East
- 5.7.5.1.1 Gulf Cooperation Council Countries
- 5.7.5.1.2 Turkey
- 5.7.5.1.3 Rest of Middle East
- 5.7.5.2 Africa
- 5.7.5.2.1 South Africa
- 5.7.5.2.2 Rest of Africa
- 5.7.5.1 Middle East
- 5.7.1 North America
6 COMPETITIVE LANDSCAPE
- 6.1 Market Concentration
- 6.2 Strategic Moves
- 6.3 Market Share Analysis
- 6.4 Company Profiles {(includes Global-level Overview, Market-level Overview, Core Segments, Financials as available, Strategic Information, Market Rank/Share, Products and Services, Recent Developments)}
- 6.4.1 Samsung Electronics Co., Ltd.
- 6.4.2 LG Display Co., Ltd.
- 6.4.3 BOE Technology Group Co., Ltd.
- 6.4.4 Panasonic Corporation
- 6.4.5 Leyard Optoelectronic Co., Ltd.
- 6.4.6 Sharp NEC Display Solutions, Ltd.
- 6.4.7 ViewSonic Corporation
- 6.4.8 Planar Systems, Inc.
- 6.4.9 SMART Technologies ULC
- 6.4.10 Promethean World Ltd.
- 6.4.11 Newline Interactive, Inc.
- 6.4.12 Elo Touch Solutions, Inc.
- 6.4.13 BenQ Corporation
- 6.4.14 Delta Electronics, Inc. (Vivitek)
- 6.4.15 Christie Digital Systems USA, Inc.
- 6.4.16 AU Optronics Corp.
- 6.4.17 Advantech Co., Ltd.
- 6.4.18 Boxlight Corporation
- 6.4.19 Horizon Display, Inc.
- 6.4.20 Baanto International Ltd.
- 6.4.21 Intuiface (IntuiLab SAS)
- 6.4.22 CLEVERTOUCH (Boxlight)
- 6.4.23 Kiosk Information Systems
- 6.4.24 GestureTek Systems, Inc.
- 6.4.25 KT Corporation (Digico)
7 MARKET OPPORTUNITIES AND FUTURE OUTLOOK
- 7.1 White-space and Unmet-Need Assessment
 2026年全球人工智慧(AI)互動式顯示器市場報告
 互動式顯示器市場:全球市場按螢幕大小、應用程式、銷售管道和最終用戶分類的預測 - 2026-2032 年互動式平板顯示器市場:2026年至2032年全球市場預測(按觸點、分銷管道、螢幕技術、產品類型和最終用戶分類)2026年全球互動式平板顯示器市場報告互動式筆顯示器市場按技術、產品類型、應用、分銷管道和最終用戶分類 - 全球預測 2026-2032觸控互動桌市場按技術類型、螢幕大小、部署類型、應用程式和最終用戶分類 - 全球預測 2026-2032
 互動式顯示器市場規模、佔有率和成長分析(按產品、技術、面板尺寸、面板類型、最終用途和地區分類)-2026-2033年產業預測
 互動·顯示器:季度市場追蹤
 亞太地區互動顯示市場預測至 2031 年 - 區域分析 - 按產品、面板尺寸、面板類型和垂直行業
 北美互動式顯示器市場預測至 2031 年 - 區域分析 - 按產品、面板尺寸、面板類型和垂直行業