


 |
市場調查報告書
商品編碼
2044053
SSD快取:市場佔有率分析、產業趨勢與統計、成長預測(2026-2031年)SSD Caching - Market Share Analysis, Industry Trends & Statistics, Growth Forecasts (2026 - 2031) |
||||||
※ 本網頁內容可能與最新版本有所差異。詳細情況請與我們聯繫。
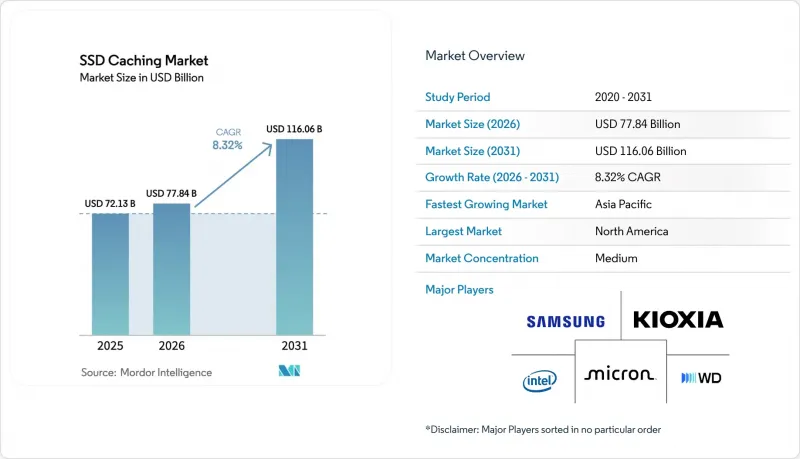
SSD快取市場預計將從2025年的721.3億美元成長到2026年的778.4億美元,然後在2031年達到1,160.6億美元,2026年至2031年的複合年成長率為8.32%。
對低延遲資訊服務的持續需求、PCIe 5.0 和 Compute Express Link (CXL) 的普及以及企業對自主 AI 工作流程的採用,正在推動短期收入成長。硬體市場佔有率仍佔據主導地位,但隨著虛擬化將效能層級與實體介質分離,向軟體定義分層的轉變已顯而易見。隨著超大規模資料中心業者開始將 NVMe-over-Fabrics 作為標準服務提供,雲端原生應用程式正在加速發展。另一方面,本地部署陣列正透過付費使用制捍衛其市場佔有率。競爭的焦點正從簡單的容量轉向協議互通性和耐久性,這為同時擁有 NAND 製造和韌體藍圖的供應商創造了機會。供應鏈波動、地緣政治出口限制和新的資料主權法規仍然是主要的阻力,但將垂直整合與靈活授權相結合的供應商將繼續主導 SSD 快取市場。
全球固態硬碟快取市場趨勢及洞察
加速採用基於 NVMe 的資料中心
NVMe over Fabrics 正在取代 SATA 和 SAS,將延遲從毫秒級大幅降低至微秒級,使每個硬碟的 IOPS 提升幾個數量級。英特爾報告稱,到 2026 年第一季,其 Xeon 平台上的 NVMe SSD搭載率將超過 75%,這印證了超大規模資料中心業者推動的標準化進程。鎧俠 (Kioxia) 的 PCIe 5.0 CD9P 硬碟讀取速度高達 14 GB/s,單一裝置即可取代三個 Gen4 單元,從而縮小機架尺寸,降低功耗和散熱成本。這種轉變給傳統的區塊協定 SAN 帶來了壓力,並推動企業轉向軟體定義儲存架構 (SDS)。 SDS 雖然會帶來授權方面的額外開銷,但卻能實現亞微秒的快取命中率。
企業資料分析工作量日益增加
受生成式人工智慧工作負載爆炸性成長的推動,預計到2025年,全球資料倉儲查詢量將年增42%,從而推動對持續隨機讀取的需求不斷成長。戴爾表示,整合NVMe快取的PowerStore陣列出貨量在金融服務業客戶中成長了63%。 SSD快取允許企業將熱點資料集暫存到僅佔總容量一小部分的位置,從而在維持服務等級協定(SLA)的同時,推遲成本高昂的容量升級。基於機器學習的預取技術正在興起,旨在應對不斷變化的存取模式,從而穩定快取命中率。
企業級 SSD 快取的初始投資成本高
企業級 NVMe SSD 的價格為每 GB 0.80 美元至 1.20 美元,而近線 HDD 的價格僅為每 GB 0.05 美元,兩者相差 16 至 24 倍,成為升級的一大障礙。美光公司宣布 2025 會計年度 NVMe SSD 的價格將上漲 15%,扭轉了先前平均售價 (ASP) 長期下降的趨勢,因為 AI 伺服器已經佔據了晶圓產能。 Pure Storage 的 Evergreen//Forever 等基於消費的計劃可以降低資本支出,但採用率仍然低於 20%,導致市場兩極分化:超大規模超大規模資料中心業者正在快速發展,而中型企業則難以充分利用其第四代 NVMe 資產。
細分市場分析
到2025年,直寫式快取將維持45.88%的市場佔有率,成為固態硬碟快取市場的基礎,因為事務型資料庫需要同步持久性。大規模金融和電商平台青睞這種設計,因為所有寫入操作都會鏡像到原始數據,從而消除數據遺失的擔憂。然而,環繞式快取將迎來最快的成長,到2031年複合年成長率將達到9.34%。這反映了分析型工作負載對讀取延遲的重視程度高於寫入速度。目前,軟體定義陣列允許管理員按卷切換快取模式,提供了傳統控制器所不具備的柔軟性,並支援固態硬碟快取市場中日益多樣化的工作負載。
PCIe 5.0頻寬的激增消除了傳統的瓶頸,使得資料攝入流量可以繞過快取,而不會給寫入旁路陣列的處理能力帶來壓力。 Snowflake 和 Databricks 正在將此模型標準化,用於讀取率高達 95% 的雲端資料倉儲,這預示著更廣泛的架構轉變。同時,寫回方法仍然適用於混合工作負載,但依賴具有電池備份的易失性緩衝區或非揮發性記憶體模組。總而言之,多樣化的快取模式的出現擴大了買家的選擇範圍,並加劇了 SSD 快取市場的功能競爭。
到2025年,硬體將佔據68.63%的市場佔有率,而隨著企業將邏輯效能層與底層儲存媒體分離,軟體定義快取平台預計將在2031年之前以9.56%的複合年成長率成長。像DataCore SANsymphony這樣的平台可以將任何區塊裝置轉換為快取層,從而最大限度地利用老舊的SAS硬碟,並將PCIe 5.0 SSD整合到同一叢集。這種轉變將緩解廠商鎖定問題,但也迫使硬碟製造商採用更智慧的韌體來實現差異化。
美光9550固態硬碟整合了控制器級機器學習功能,能夠預測熱點資料。三星的靈活資料放置(Flexible Data Placement)功能可讓主機將寫入操作定向到同一硬碟內的高耐久性SLC區域。這些創新模糊了固態硬碟快取市場中硬體和軟體功能之間的界限,促使買家重新思考其整體擁有成本(TCO)框架。
區域分析
到2025年,北美將佔據市場主導地位,市佔率達38.84%。維吉尼亞、奧勒岡州和德克薩斯州的超大規模園區每月消耗數千塊PCIe 5.0硬碟,為其成長提供了強大支撐。 《晶片與科學法案》下的聯邦獎勵推動了美國本土的組裝,而FIPS 140-3等加密要求則確保只有經過認證的安全韌體才能成為供應商候選產品。然而,北美的更新周期超過五年,導致其成長速度低於其他地區。
預計亞太地區將維持最高成長率,到2031年複合年成長率將達到9.91%。中國的「十四五」規劃目標是企業儲存自給率達到70%,這將推動國產控制器和NAND快閃記憶體的發展。 SK海力士計畫投資39億美元,到2028年將其CXL模組產能提高三倍,其預期是快取連貫記憶體將取代部分固態硬碟(SSD)快取市場。在印度,受《數位個人資料保護法》的推動,資料中心規模擴張,目標占地面積加倍,從而增加了該地區對適用於高溫高濕環境的快取設備的需求。
歐洲和中東/非洲雖然規模較小,但卻構成了一個具有重要戰略意義的叢集。 GDPR強制要求在區域內進行快取,這使得預先安裝了NVMe陣列的託管服務提供者受益。在歐洲,德國和英國引領投資,而沙烏地阿拉伯和阿拉伯聯合大公國則投資建置自主雲端叢集,以減少對美國和中國超大規模資料中心業者雲端服務供應商的依賴。微軟Azure在奈及利亞和埃及的擴張預示著未來需求的成長,但由於電力系統不穩定和光纖連接有限,非洲地區的SSD快取市場佔有率成長仍然受到阻礙。
其他好處:
- Excel格式的市場預測(ME)表
- 3個月的分析師支持
目錄
第1章:引言
- 研究假設和市場定義
- 調查範圍
第2章:調查方法
第3章執行摘要
第4章 市場狀況
- 市場概覽
- 市場促進因素
- 加速採用基於 NVMe 的資料中心
- 企業內日益成長的數據分析工作量。
- 對低延遲邊緣運算基礎設施的需求
- 擴大融合式基礎架構基礎設施的採用
- 將對 PCIe 5.0 和 CXL 協議的支援納入主流。
- 透過人工智慧驅動的損耗均衡提高固態硬碟的耐用性。
- 市場限制因素
- 企業級 SSD 快取需要較高的初始資本投入。
- 維護多層儲存架構的複雜性
- 寫入密集型工作負載效能提升的局限性
- 先進NAND組件的供應鏈波動
- 宏觀經濟因素對市場的影響
- 產業供應鏈分析
- 監理情勢
- 技術展望
- 波特五力分析
- 新進入者的威脅
- 供應商的議價能力
- 買方的議價能力
- 替代品的威脅
- 競爭公司之間的競爭
第5章 市場規模與成長預測
- 以建築學為例
- 光線透過
- 輕背
- 就在附近
- 按組件
- 硬體
- 軟體
- 按部署模式
- 現場
- 雲
- 透過使用
- 企業伺服器
- 個人電腦
- 按地區
- 北美洲
- 美國
- 加拿大
- 墨西哥
- 南美洲
- 巴西
- 阿根廷
- 南美洲其他地區
- 歐洲
- 德國
- 英國
- 法國
- 義大利
- 西班牙
- 其他歐洲地區
- 亞太地區
- 中國
- 日本
- 印度
- 韓國
- 澳洲
- 亞太其他地區
- 中東和非洲
- 中東
- 沙烏地阿拉伯
- 阿拉伯聯合大公國
- 土耳其
- 其他中東國家
- 非洲
- 南非
- 埃及
- 奈及利亞
- 其他非洲地區
- 中東
- 北美洲
第6章 競爭情勢
- 市場集中度
- 策略趨勢
- 市佔率分析
- 公司簡介
- Samsung Electronics Co., Ltd.
- Intel Corporation
- Kioxia Holdings Corporation
- Western Digital Corporation
- Micron Technology, Inc.
- SK hynix Inc.
- ASTERA LABS, INC.
- Kingston Technology Company, Inc.
- Hewlett Packard Enterprise Company
- Dell Technologies Inc.
- NetApp, Inc.
- Lenovo Group Limited
- Huawei Technologies Co., Ltd.
- Inspur Group Co., Ltd.
- Pure Storage, Inc.
- DataCore Software Corporation
- Nutanix, Inc.
- Montage Technology
- AccelStor, Inc.
第7章 市場機會與未來展望
The SSD caching market size is expected to grow from USD 72.13 billion in 2025 to USD 77.84 billion in 2026 and is forecast to reach USD 116.06 billion by 2031 at 8.32% CAGR over 2026-2031.
Unrelenting demand for low-latency data services, the mainstreaming of PCIe 5.0 and Compute Express Link (CXL), and enterprise adoption of sovereign-AI workflows are lifting near-term revenue. Hardware share stays dominant, yet the pivot toward software-defined tiering is unmistakable as virtualization decouples performance tiers from physical media. Cloud-native deployments are accelerating because hyperscalers now expose NVMe-over-Fabrics as a routine service, while on-premise arrays defend share through consumption-based pricing. Competitive energy has moved from raw capacity to protocol interoperability and endurance, creating space for vendors that own both NAND fabrication and firmware road maps. Supply-chain volatility, geopolitical export controls, and emerging data-sovereignty rules remain the chief headwinds, but the SSD caching market continues to reward providers that combine vertical integration with flexible licensing.
Global SSD Caching Market Trends and Insights
Accelerated Adoption of NVMe-Based Data Centers
NVMe-over-Fabrics is replacing SATA and SAS, slashing latency from milliseconds to microseconds and allowing each drive to serve order-of-magnitude more IOPS. Intel reported that NVMe SSD attach rates in Xeon platforms exceeded 75% in Q1 2026, underscoring hyperscaler standardization. Kioxia's PCIe 5.0 CD9P drive delivers 14 GB/s reads, enabling one device to replace three Gen4 units and cut rack count, power, and cooling. The switch strains legacy block-protocol SANs, pushing enterprises toward software-defined storage fabrics that add license overhead but unlock sub-100-microsecond cache hits.
Rising Data Analytics Workloads Across Enterprises
Global data-warehouse query volumes expanded 42% year-over-year in 2025 as generative-AI workloads exploded, intensifying demand for sustained random reads. Dell noted a 63% shipment jump for PowerStore arrays with integrated NVMe caching among financial-services customers. SSD caches permit enterprises to stage hot datasets on a fraction of total capacity, postponing costly capacity upgrades while maintaining service-level agreements. Machine-learning-based prefetching is emerging to stabilize cache-hit ratios amid shifting access patterns.
High Upfront Capital Expenditure for Enterprise SSD Caches
Enterprise NVMe SSDs cost USD 0.80-1.20 per gigabyte versus USD 0.05 for nearline HDDs, a 16-24X delta that deters upgrades. Micron's 15% price hike in FY2025 reversed years of ASP declines as AI servers absorbed wafer output. Consumption-based programs like Pure Storage's Evergreen//Forever mitigate capex but remain sub-20% penetrated, creating a bifurcated market where hyperscalers advance and mid-tier buyers sweat Gen4 assets.
Other drivers and restraints analyzed in the detailed report include:
- Demand for Low-Latency Edge Computing Infrastructure
- Growth in Hyperconverged Infrastructure Deployments
- Complexity in Maintaining Multi-Tier Storage Architectures
For complete list of drivers and restraints, kindly check the Table Of Contents.
Segment Analysis
Write-through retained 45.88% of the market share in 2025, anchoring the SSD caching market as transactional databases insist on synchronous durability. Large financial and e-commerce platforms favor the design because every write is mirrored to the origin, eliminating data-loss concerns. Yet write-around will post the fastest growth at a 9.34% CAGR through 2031, reflecting analytics workloads where read latency trumps write speed. Software-defined arrays now let administrators toggle among caching modes per volume, injecting flexibility legacy controllers lack, and supporting the widening workload split within the SSD caching market.
The surge of PCIe 5.0 bandwidth permits ingest traffic to bypass cache without choking write-around arrays, removing a historic bottleneck. Snowflake and Databricks have standardized on the model for cloud warehouses that show 95% read ratios, signaling a broad architectural pivot. Meanwhile, write-back persists for mixed workloads but depends on battery-backed volatile buffers or persistent memory modules. Overall, the panoply of caching modes expands buyer choice and intensifies feature competition across the SSD caching market.
Hardware accounted for 68.63% of market share in 2025, but software-defined caching platforms are on pace for a 9.56% CAGR through 2031 as enterprises decouple logical performance layers from the underlying media. Platforms such as DataCore SANsymphony convert any block device into a cache tier, squeezing residual value from aging SAS drives and sliding PCIe 5.0 SSDs into the same cluster. This shift lowers vendor lock-in, though it pressures drive makers to embed smarter firmware to differentiate.
Micron's 9550 SSD integrates on-controller machine learning that predicts hot data. Samsung's Flexible Data Placement allows hosts to steer writes to high-endurance SLC within the same drive. These innovations blur the boundaries between hardware and software feature sets in the SSD caching market, prompting buyers to reassess total-cost-of-ownership frameworks.
The SSD Caching Market Report is Segmented by Architecture (Write-Through, Write-Back, and Write-Around), Component (Hardware and Software), Deployment Model (On-Premise and Cloud), Application (Enterprise Servers and Personal Computing), and Geography. The Market Forecasts are Provided in Terms of Value (USD).
Geography Analysis
North America led with 38.84% of the market share in 2025, anchored by hyperscale campuses in Virginia, Oregon, and Texas that consume thousands of PCIe 5.0 drives per month. Federal incentives under the CHIPS and Science Act encourage domestic assembly, and encryption mandates such as FIPS 140-3 narrow the supplier field to drives with certified secure firmware. Replacement cycles, however, lengthen beyond five years, moderating growth relative to other regions.
Asia-Pacific will post the fastest 9.91% CAGR through 2031. China's 14th Five-Year Plan targets 70% self-sufficiency in enterprise storage, spurring indigenous controller and NAND development. SK hynix is spending USD 3.9 billion to triple CXL module capacity by 2028, betting that cache-coherent memory will displace parts of the SSD caching market. India's data-center build-out, propelled by the Digital Personal Data Protection Act, doubles addressable floor space and lifts regional demand for cache devices tuned to humid, high-temperature environments.
Europe, the Middle East and Africa form a smaller but strategic cluster. GDPR compels in-region caching, benefitting colocation operators that pre-install NVMe arrays. Germany and the United Kingdom lead European spend, while Saudi Arabia and the UAE bankroll sovereign-cloud clusters to cut reliance on U.S. or Chinese hyperscalers. Microsoft Azure's expansion into Nigeria and Egypt highlights future pull, yet broad African adoption remains gated by inconsistent power grids and limited fiber, restraining the SSD caching market share there.
- Samsung Electronics Co., Ltd.
- Intel Corporation
- Kioxia Holdings Corporation
- Western Digital Corporation
- Micron Technology, Inc.
- SK hynix Inc.
- ASTERA LABS, INC.
- Kingston Technology Company, Inc.
- Hewlett Packard Enterprise Company
- Dell Technologies Inc.
- NetApp, Inc.
- Lenovo Group Limited
- Huawei Technologies Co., Ltd.
- Inspur Group Co., Ltd.
- Pure Storage, Inc.
- DataCore Software Corporation
- Nutanix, Inc.
- Montage Technology
- AccelStor, Inc.
Additional Benefits:
- The market estimate (ME) sheet in Excel format
- 3 months of analyst support
TABLE OF CONTENTS
1 INTRODUCTION
- 1.1 Study Assumptions and Market Definition
- 1.2 Scope of the Study
2 RESEARCH METHODOLOGY
3 EXECUTIVE SUMMARY
4 MARKET LANDSCAPE
- 4.1 Market Overview
- 4.2 Market Drivers
- 4.2.1 Accelerated Adoption of NVMe-Based Data Centers
- 4.2.2 Rising Data Analytics Workloads Across Enterprises
- 4.2.3 Demand for Low-Latency Edge Computing Infrastructure
- 4.2.4 Growth in Hyperconverged Infrastructure Deployments
- 4.2.5 Mainstreaming of PCIe 5.0 and CXL Protocol Support
- 4.2.6 Enhanced SSD Endurance Through AI-Enabled Wear-Leveling
- 4.3 Market Restraints
- 4.3.1 High Upfront Capital Expenditure for Enterprise SSD Caches
- 4.3.2 Complexity in Maintaining Multi-Tier Storage Architectures
- 4.3.3 Limited Performance Gains for Write-Intensive Workloads
- 4.3.4 Supply Chain Volatility in Advanced NAND Components
- 4.4 Impact of Macroeconomic Factors on the Market
- 4.5 Industry Supply-Chain Analysis
- 4.6 Regulatory Landscape
- 4.7 Technological Outlook
- 4.8 Porter's Five Forces Analysis
- 4.8.1 Threat of New Entrants
- 4.8.2 Bargaining Power of Suppliers
- 4.8.3 Bargaining Power of Buyers
- 4.8.4 Threat of Substitutes
- 4.8.5 Intensity of Competitive Rivalry
5 MARKET SIZE AND GROWTH FORECASTS (VALUE)
- 5.1 By Architecture
- 5.1.1 Write-Through
- 5.1.2 Write-Back
- 5.1.3 Write-Around
- 5.2 By Component
- 5.2.1 Hardware
- 5.2.2 Software
- 5.3 By Deployment Model
- 5.3.1 On-Premise
- 5.3.2 Cloud
- 5.4 By Application
- 5.4.1 Enterprise Servers
- 5.4.2 Personal Computing
- 5.5 By Geography
- 5.5.1 North America
- 5.5.1.1 United States
- 5.5.1.2 Canada
- 5.5.1.3 Mexico
- 5.5.2 South America
- 5.5.2.1 Brazil
- 5.5.2.2 Argentina
- 5.5.2.3 Rest of South America
- 5.5.3 Europe
- 5.5.3.1 Germany
- 5.5.3.2 United Kingdom
- 5.5.3.3 France
- 5.5.3.4 Italy
- 5.5.3.5 Spain
- 5.5.3.6 Rest of Europe
- 5.5.4 Asia-Pacific
- 5.5.4.1 China
- 5.5.4.2 Japan
- 5.5.4.3 India
- 5.5.4.4 South Korea
- 5.5.4.5 Australia
- 5.5.4.6 Rest of Asia-Pacific
- 5.5.5 Middle East and Africa
- 5.5.5.1 Middle East
- 5.5.5.1.1 Saudi Arabia
- 5.5.5.1.2 United Arab Emirates
- 5.5.5.1.3 Turkey
- 5.5.5.1.4 Rest of Middle East
- 5.5.5.2 Africa
- 5.5.5.2.1 South Africa
- 5.5.5.2.2 Egypt
- 5.5.5.2.3 Nigeria
- 5.5.5.2.4 Rest of Africa
- 5.5.5.1 Middle East
- 5.5.1 North America
6 COMPETITIVE LANDSCAPE
- 6.1 Market Concentration
- 6.2 Strategic Moves
- 6.3 Market Share Analysis
- 6.4 Company Profiles (includes Global level Overview, Market level overview, Core Segments, Financials as Available, Strategic Information, Market Rank/Share for Key Companies, Products and Services, and Recent Developments)
- 6.4.1 Samsung Electronics Co., Ltd.
- 6.4.2 Intel Corporation
- 6.4.3 Kioxia Holdings Corporation
- 6.4.4 Western Digital Corporation
- 6.4.5 Micron Technology, Inc.
- 6.4.6 SK hynix Inc.
- 6.4.7 ASTERA LABS, INC.
- 6.4.8 Kingston Technology Company, Inc.
- 6.4.9 Hewlett Packard Enterprise Company
- 6.4.10 Dell Technologies Inc.
- 6.4.11 NetApp, Inc.
- 6.4.12 Lenovo Group Limited
- 6.4.13 Huawei Technologies Co., Ltd.
- 6.4.14 Inspur Group Co., Ltd.
- 6.4.15 Pure Storage, Inc.
- 6.4.16 DataCore Software Corporation
- 6.4.17 Nutanix, Inc.
- 6.4.18 Montage Technology
- 6.4.19 AccelStor, Inc.
7 MARKET OPPORTUNITIES AND FUTURE OUTLOOK
- 7.1 White-Space and Unmet-Need Assessment
