


 |
市場調查報告書
商品編碼
2044050
北美數位虛擬形象:市場佔有率分析、產業趨勢與統計及成長預測(2026-2031 年)North America Digital Avatar - Market Share Analysis, Industry Trends & Statistics, Growth Forecasts (2026 - 2031) |
||||||
※ 本網頁內容可能與最新版本有所差異。詳細情況請與我們聯繫。
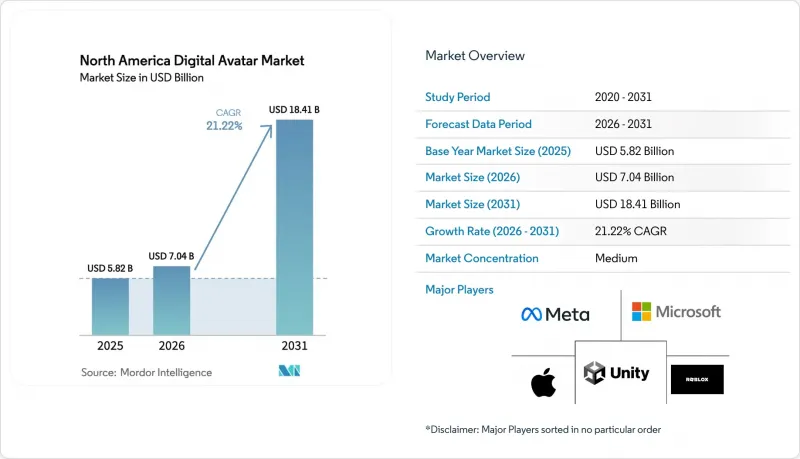
預計北美數位虛擬形象市場將從 2025 年的 58.2 億美元成長到 2026 年的 70.4 億美元,到 2031 年達到 184.1 億美元,2026 年至 2031 年的複合年成長率為 21.22%。
硬體的穩定發展、情感人工智慧的突破以及清晰的資訊揭露法規正在加速企業在顧客關懷、遠端醫療和身臨其境型商務領域的應用。 Meta Platforms 和微軟等超超大規模資料中心業者的巨額投資(每年在元宇宙相關工具上的投資總額超過 100 億美元)正在推動運算和軟體能力的快速提升。同時,醫療保健系統和零售客服中心日益嚴重的勞動力短缺問題,促使預算從人員配備轉向虛擬化身驅動的自動化。此外,COPPA 2.0 的澄清以及各州生物識別法規的訂定,也降低了採用虛擬化身的門檻。所有這些因素綜合起來表明,未來五年內,北美數位虛擬化身市場的成長速度將超過大多數相關的互動式人工智慧細分市場。
北美數位虛擬形象市場的趨勢與洞察
虛擬實境(VR)和擴增實境(AR)硬體的普及
經濟型頭戴式顯示器的快速普及,正推動著身臨其境型身分層技術的根本需求。隨著 Meta 的 Quest 3S(售價 299 美元)於 2024 年底發布,以及蘋果的 Vision Pro 於 2025 年初上市,北美地區的 XR 頭顯總部署量已超過 1500 萬台。這兩款總合整合了轉碼器化身管道,能夠繪製臉部肌肉運動和手勢,從而在遠端協作、虛擬展示室和手術模擬等場景中實現逼真的虛擬化身體驗。 Unity 等中間件供應商正積極響應,推出設備端推理引擎,減少與伺服器的往返通訊,將延遲降低到 100 毫秒以下——認知研究人員認為,100 毫秒的閾值對於自然的社交臨場感至關重要。憑藉著不斷提升的邊緣渲染能力,企業不再需要在照片級真實感和反應速度之間做出權衡,從而消除了北美數位虛擬化身市場長期以來的普及障礙。
客戶服務聊天機器人中數位虛擬形象的採用率不斷提高。
客服中心成本不斷攀升,消費者對全天候支援的需求日益成長,推動了虛擬化身虛擬客服的蓬勃發展。至2025年,金融和零售網路中將有超過8,000名虛擬客服運作,較去年同期成長140%。光是紐約梅隆銀行就部署了2萬個逼真的虛擬客服,這些虛擬客服目前能夠解決三分之二的一級資產管理諮詢,並每年節省4,200萬美元的營運成本。儘管美國聯邦貿易委員會(FTC)的揭露要求明確標識虛擬客服人員,但這項法律規定反而加速了虛擬客服的普及,因為它為首席風險長(CRO)提供了一個清晰的合規框架。預計到2026年,客戶滿意度評分的顯著提升將推動互動式虛擬化身的進一步試點部署,因為這一管道正在北美數位虛擬化身市場中確立其早期收入來源的地位。
即時渲染需要很高的運算成本
儘管邊緣推斷技術取得了進步,但逼真的虛擬形象仍需要高效能GPU和大量的雲端資源。一張RTX 6000 Ada顯示卡的零售價約為6800美元,而維持4K 60fps的渲染通常需要在企業級伺服器上部署多張顯示卡。按需雲端渲染的費用約為每GPU小時0.45美元,這對許多中小企業來說都是一筆難以負擔的每月開支。雖然像Unity的Ziva這樣的最佳化工具已經將多邊形數量減少了40%,但剩餘的成本仍然阻礙了教育機構和中型醫療系統廣泛採用這項技術。除非渲染堆疊也能像莫耳定律那樣提高效率,否則這些成本將繼續阻礙北美數位虛擬形象市場的發展。
細分市場分析
隨著各機構從單向吉祥物轉向能夠帶來可衡量業務成果的互動式式代理,互動式虛擬形象市場正以22.53%的複合年成長率快速擴張。 Ardent醫療網路旗下的一家醫院在部署分診虛擬形象後,急診室的平均等待時間縮短了22分鐘,這一概念驗證正推動著該技術在醫療保健系統中的進一步推廣。互動式形象融合了自動語音辨識、大規模語言處理和情緒人工智慧技術,透過避免重複詢問和僅報告複雜病例來減輕員工的工作量。在遊戲產業,微軟Teams Mesh虛擬形象目前正為超過180萬企業用戶主持內部專案評審和客戶演示,顯著降低了用戶報告的會議疲勞度。
非互動式虛擬形像在品牌策略中仍然扮演著核心角色,尤其是在那些專注於透過色彩分級來保持風格一致性的娛樂品牌中。預計到2025年,非互動式虛擬形象將佔據57.89%的市場佔有率,這反映了它們在社交管道、節日慶典和周邊產品宣傳活動中的廣泛應用。然而,隨著語言模型帶來的情境控制能力的提升,互動式虛擬形像有望在行銷中承擔更多的敘事工作。隨著低延遲渲染技術的不斷進步,使用者因延遲而產生的挫折感得以緩解,北美數位虛擬形象市場正逐步轉型為互動式格式。
預計到2025年,3D虛擬形象將佔據52.32%的市場佔有率,而人工智慧生成的人物在預測期內的複合年成長率預計將達到22.67%。它們正在縮小與3D虛擬形象的差距,因為它們無需耗費數週時間進行手動綁定,即可達到電影級的品質。 Epic Games的MetaHuman Creator將資產創建時間從近一個月縮短到不到兩個小時,這項改變促使去年有420家工作室採用了這種工作流程。諸如NVIDIA Audio2Face之類的神經渲染附加元件已在14種語言中實現了98%的唇形同步準確率,使其成為北美多元文化市場本地化內容的必備工具。各公司紛紛採用這些工具鏈,因為它們無需重拍即可快速對角色語氣、服裝和聲音進行A/B測試。
3D虛擬形像不會消失。它們處理能力強,在頻寬有限的瀏覽器和行動環境中極具吸引力。 Snap的「Bitmoji」每天處理數億個訊息,同時保持時尚的2D+美學風格,並且仍然是品牌夥伴關係包的核心組成部分。在預測期內,融合程式網格和神經紋理的混合工具包將成為主流,這將有助於習慣於傳統工作流程的美術團隊進行轉型,同時也能滿足經營團隊對面向客戶部署中更高真實感的需求。這種融合將支援對多棧解決方案的需求,並擴大北美數位虛擬形象市場的潛在基本客群。
其他好處:
- Excel格式的市場預測(ME)表
- 3個月的分析師支持
目錄
第1章:引言
- 研究假設和市場定義
- 調查範圍
第2章:調查方法
第3章執行摘要
第4章 市場狀況
- 市場概覽
- 市場促進因素
- 虛擬實境(VR)和擴增實境(AR)硬體的普及
- 客戶服務聊天機器人中數位虛擬形象的採用率不斷提高。
- 虛擬網紅在品牌行銷中日益普及
- 遊戲和社交媒體驅動下的元宇宙平台的興起
- 將情緒人工智慧整合到超逼真的虛擬化身面部表情中
- 配備逼真虛擬化身的遠端遠端臨場機器人的普及
- 市場限制因素
- 即時渲染的運算成本很高
- 生物識別和人像識別的資料隱私和安全問題。
- 虛擬化身生態系間互通性標準的局限性
- 基於深度造假的虛擬形像生成引發了倫理方面的強烈反彈。
- 產業價值鏈分析
- 監理情勢
- 技術展望
- 宏觀經濟因素對市場的影響
- 波特五力分析
- 買方的議價能力
- 供應商的議價能力
- 新進入者的威脅
- 替代品的威脅
- 競爭公司之間的競爭
第5章 市場規模與成長預測
- 依產品類型
- 互動式數位虛擬形象
- 非互動式數位虛擬形象
- 透過技術
- 2D 化身
- 3D虛擬形象
- 人工智慧生成的逼真人類化身
- 透過使用
- 客戶服務和虛擬代理
- 行銷和廣告
- 遊戲與娛樂
- 數位學習與培訓
- 醫療保健和遠端醫療
- 社群媒體與內容創作
- 按最終用戶行業分類
- 媒體與娛樂
- 零售與電子商務
- 醫療保健提供者
- 教育機構
- 銀行與金融服務 (BFSI)
- 政府和公共服務
- 其他終端用戶產業
- 國家
- 美國
- 加拿大
- 墨西哥
第6章 競爭情勢
- 市場集中度
- 策略趨勢
- 市佔率分析
- 公司簡介
- Meta Platforms Inc.
- Microsoft Corporation
- Apple Inc.
- Roblox Corporation
- Unity Software Inc.
- NVIDIA Corporation
- Epic Games Inc.
- Amazon.com Inc.
- Alphabet Inc.
- Snap Inc.
- Inworld AI Inc.
- Wolf3D OU(Ready Player Me)
- Genies Inc.
- Soul Machines Ltd.
- Reallusion Inc.
- Pinscreen Inc.
- Loom.ai Inc.
- Adobe Inc.
第7章 市場機會與未來展望
The North America digital avatar market size is expected to increase from USD 5.82 billion in 2025 to USD 7.04 billion in 2026 and reach USD 18.41 billion by 2031, growing at a CAGR of 21.22% over 2026-2031.
Persistent hardware progress, emotion-AI breakthroughs, and clear disclosure rules are accelerating enterprise adoption across customer care, telehealth, and immersive commerce. Heavy investment by hyperscalers such as Meta Platforms and Microsoft, which together earmark well above USD 10 billion per year for metaverse tooling, keeps compute and software capabilities on an aggressive improvement curve. At the same time, rising labor shortages in health systems and retail contact centers are prompting budget reallocation from headcount to avatar-enabled automation, while legal certainty around COPPA 2.0 and state biometric statutes is reducing procurement friction. These converging forces position the North America digital avatar market to outgrow most adjacent conversational-AI segments over the next five years.
North America Digital Avatar Market Trends and Insights
Proliferation of Virtual Reality and Augmented Reality Hardware
Rapid uptake of affordable head-mounted displays is lifting baseline demand for immersive identity layers. Meta's USD 299 Quest 3S, released in late 2024, and Apple's Vision Pro, which entered commercial circulation in early 2025, collectively pushed the North American installed base of XR headsets past 15 million devices. Both headsets ship with built-in codec-avatar pipelines that map facial muscle movement and hand gestures, enabling lifelike embodiment during remote collaboration, virtual showrooms, and surgical simulations. Middleware vendors such as Unity have responded with on-device inference engines that shave server round-trips, lowering latency beneath the 100 millisecond threshold viewed by cognitive researchers as critical for natural social presence. As edge rendering capacity increases, enterprises no longer face a trade-off between photorealism and responsiveness, removing a historical adoption ceiling for the North America digital avatar market.
Growing Adoption of Digital Avatars in Customer Service Chatbots
Contact-center cost inflation and consumer demand for 24/7 assistance have produced a surge in avatar-equipped virtual agents. More than 8,000 such agents went live across financial and retail networks in 2025, up 140% year over year. BNY Mellon alone activated 20,000 photorealistic assistants that now resolve two-thirds of tier-1 wealth-management inquiries, trimming annual operating spend by USD 42 million. Disclosure mandates from the Federal Trade Commission require clear identification of synthetic staff, and this legal clarity has paradoxically accelerated procurement as chief risk officers now have definitive compliance frameworks. The measurable lift in customer-satisfaction scores is persuading additional banks and retailers to pilot conversational avatars in 2026, cementing the channel as an early-cycle revenue driver for the North America digital avatar market.
High Computational Costs for Real-Time Rendering
Despite progress in edge inference, photorealistic avatars still require premium GPUs or substantial cloud budgets. A single RTX 6000 Ada card retails at roughly USD 6,800, and enterprise-grade servers often need multiple units to sustain 4K, 60 fps sessions. On-demand cloud rendering, priced near USD 0.45 per GPU-hour, converts into monthly bills that many small businesses cannot absorb. Optimization tools such as Unity's Ziva have shaved polygon counts by 40%, yet the residual cost still restrains broad deployments in education and mid-tier healthcare systems. Unless Moore's-law-like efficiency gains reach rendering stacks, this expense will continue to drag on the North America digital avatar market growth.
Other drivers and restraints analyzed in the detailed report include:
- Increasing Popularity of Virtual Influencers for Brand Marketing
- Rise of Metaverse Platforms Led by Gaming and Social Media
- Data Privacy and Security Concerns Around Biometric Likeness
For complete list of drivers and restraints, kindly check the Table Of Contents.
Segment Analysis
The interactive avatars is scaling quickly, advancing at a 22.53% CAGR as organizations migrate from one-way mascots to conversational agents that deliver measurable business outcomes. Hospitals within the Ardent network shortened average emergency-department wait times by 22 minutes after installing triage avatars, a performance proof point that encourages further health-system rollouts. Interactive designs incorporate automatic speech recognition, large-language reasoning, and emotion-AI, allowing them to deflect repetitive inquiries and escalate only complex cases, thereby preserving staff bandwidth. In gaming, Microsoft Teams' Mesh avatars now host internal project reviews and client demos for more than 1.8 million corporate users, reducing reported meeting fatigue by double digits.
Non-interactive avatars remain central to branding missions, especially in entertainment franchises determined to maintain color-graded stylistic consistency. Their 57.89% share in 2025 reflects wide deployment across social channels, festivals, and merchandise campaigns. However, as language models improve contextual guardrails, interactive agents are expected to absorb much of the marketing storytelling workload. Ongoing advances in low-latency rendering are helping diminish user frustration over lag, making the North America digital avatar market progressively skew toward two-way formats.
3D avatars held a 52.32% share in 2025, but AI-generated humans is expected to grow at a CAGR of 22.67% during the forecast period. It is closing the gap by promising cinematic quality without weeks of manual rigging. Epic Games' MetaHuman Creator compresses asset build time from nearly a month to under 2 hours, a shift that brought 420 studios into the workflow last year. Neural rendering add-ons such as NVIDIA Audio2Face hit 98% lip-sync accuracy across 14 languages, a vital feature for localized content in multicultural North America. Enterprises favor these toolchains because they permit rapid A/B experimentation of persona tone, attire, and voice without reshoots.
3D avatars are not vanishing; their lower compute requirements make them attractive for browser-based or mobile contexts with bandwidth ceilings. Snap's Bitmoji, which retains a stylized 2D-plus aesthetic, serves hundreds of millions of messages daily and continues to anchor brand partnership packs. Over the forecast horizon, hybrid toolkits that merge procedural meshes with neural texturing will dominate, cushioning the transition for art teams steeped in legacy workflows while satisfying executive mandates for higher realism in customer-facing deployments. Such convergence sustains multi-stack demand, broadening the addressable base for the North America digital avatar market.
The North America Digital Avatar Market Report is Segmented by Product Type (Interactive Digital Avatars, and Non-Interactive Digital Avatars), Technology (2D Avatar, 3D Avatars, and AI-Generated Realistic Human Avatars), Application (Customer Service and Virtual Agents, and More), End User Industry (Media and Entertainment, Retail and Ecommerce, and More), and Country. The Market Forecasts are Provided in Terms of Value (USD).
List of Companies Covered in this Report:
- Meta Platforms Inc.
- Microsoft Corporation
- Apple Inc.
- Roblox Corporation
- Unity Software Inc.
- NVIDIA Corporation
- Epic Games Inc.
- Amazon.com Inc.
- Alphabet Inc.
- Snap Inc.
- Inworld AI Inc.
- Wolf3D OU (Ready Player Me)
- Genies Inc.
- Soul Machines Ltd.
- Reallusion Inc.
- Pinscreen Inc.
- Loom.ai Inc.
- Adobe Inc.
Additional Benefits:
- The market estimate (ME) sheet in Excel format
- 3 months of analyst support
TABLE OF CONTENTS
1 INTRODUCTION
- 1.1 Study Assumptions and Market Definition
- 1.2 Scope of the Study
2 RESEARCH METHODOLOGY
3 EXECUTIVE SUMMARY
4 MARKET LANDSCAPE
- 4.1 Market Overview
- 4.2 Market Drivers
- 4.2.1 Proliferation of Virtual Reality and Augmented Reality Hardware
- 4.2.2 Growing Adoption of Digital Avatars in Customer Service Chatbots
- 4.2.3 Increasing Popularity of Virtual Influencers for Brand Marketing
- 4.2.4 Rise of Metaverse Platforms Led by Gaming and Social Media
- 4.2.5 Integration of Emotion-AI for Hyper-Realistic Avatar Expressions
- 4.2.6 Expansion of Telepresence Robots Powered by Photorealistic Avatars
- 4.3 Market Restraints
- 4.3.1 High Computational Costs for Real-Time Rendering
- 4.3.2 Data Privacy and Security Concerns Around Biometric Likeness
- 4.3.3 Limited Interoperability Standards Across Avatar Ecosystems
- 4.3.4 Ethical Backlash Against Deepfake-based Avatar Generation
- 4.4 Industry Value Chain Analysis
- 4.5 Regulatory Landscape
- 4.6 Technological Outlook
- 4.7 Impact of Macroeconomic Factors on the Market
- 4.8 Porter's Five Forces Analysis
- 4.8.1 Bargaining Power of Buyers
- 4.8.2 Bargaining Power of Suppliers
- 4.8.3 Threat of New Entrants
- 4.8.4 Threat of Substitutes
- 4.8.5 Intensity of Competitive Rivalry
5 MARKET SIZE AND GROWTH FORECASTS (VALUE)
- 5.1 By Product Type
- 5.1.1 Interactive Digital Avatars
- 5.1.2 Non-Interactive Digital Avatars
- 5.2 By Technology
- 5.2.1 2D Avatar
- 5.2.2 3D Avatars
- 5.2.3 AI-Generated Realistic Human Avatars
- 5.3 By Application
- 5.3.1 Customer Service and Virtual Agents
- 5.3.2 Marketing and Advertising
- 5.3.3 Gaming and Entertainment
- 5.3.4 E-Learning and Training
- 5.3.5 Healthcare and Telehealth
- 5.3.6 Social Media and Content Creation
- 5.4 By End User Industry
- 5.4.1 Media and Entertainment
- 5.4.2 Retail and Ecommerce
- 5.4.3 Healthcare Providers
- 5.4.4 Education Institutions
- 5.4.5 Banking and Financial Services (BFSI)
- 5.4.6 Government and Public Services
- 5.4.7 Other End User Industries
- 5.5 By Country
- 5.5.1 United States
- 5.5.2 Canada
- 5.5.3 Mexico
6 COMPETITIVE LANDSCAPE
- 6.1 Market Concentration
- 6.2 Strategic Moves
- 6.3 Market Share Analysis
- 6.4 Company Profiles (includes Global level Overview, Market level overview, Core Segments, Financials as available, Strategic Information, Market Rank/Share for key companies, Products and Services, and Recent Developments)
- 6.4.1 Meta Platforms Inc.
- 6.4.2 Microsoft Corporation
- 6.4.3 Apple Inc.
- 6.4.4 Roblox Corporation
- 6.4.5 Unity Software Inc.
- 6.4.6 NVIDIA Corporation
- 6.4.7 Epic Games Inc.
- 6.4.8 Amazon.com Inc.
- 6.4.9 Alphabet Inc.
- 6.4.10 Snap Inc.
- 6.4.11 Inworld AI Inc.
- 6.4.12 Wolf3D OU (Ready Player Me)
- 6.4.13 Genies Inc.
- 6.4.14 Soul Machines Ltd.
- 6.4.15 Reallusion Inc.
- 6.4.16 Pinscreen Inc.
- 6.4.17 Loom.ai Inc.
- 6.4.18 Adobe Inc.
7 MARKET OPPORTUNITIES AND FUTURE OUTLOOK
- 7.1 White-space and Unmet-Need Assessment


