


 |
市場調查報告書
商品編碼
2044033
通訊邊緣基礎設施:市場佔有率分析、產業趨勢與統計、成長預測(2026-2031 年)Telecom Edge Infrastructure - Market Share Analysis, Industry Trends & Statistics, Growth Forecasts (2026 - 2031) |
||||||
※ 本網頁內容可能與最新版本有所差異。詳細情況請與我們聯繫。
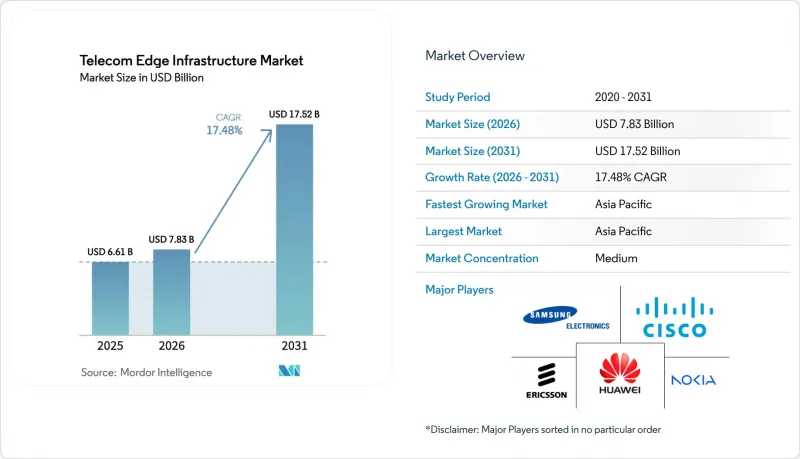
預計通訊邊緣基礎設施市場將從 2025 年的 66.1 億美元成長到 2026 年的 78.3 億美元,然後在 2031 年達到 175.2 億美元,2026 年至 2031 年的複合年成長率為 17.48%。
來自 5G 設備流量的成長、工廠自動化中更嚴格的延遲目標,以及一級通訊業者將資金重新分配到微邊緣節點,共同推動了這一加速成長。雖然硬體支出仍然佔據主導地位,但隨著通訊業者從專用設備轉向雲端原生工作負載,軟體定義網路 (SDN) 功能和編配平台正展現出新的價值。超大規模雲端供應商正在行動通訊基地台層級整合運算能力,使企業能夠快速實現亞毫秒級往返延遲,從而削弱了傳統供應商的競爭優勢。Gigabit連接和資料居住的監管期限日益緊迫,而節能型無線存取網路 (RAN) 控制器正在降低整體擁有成本,並增強分散式部署的商業價值。
全球通訊邊緣基礎設施市場趨勢與洞察:加速5G NR部署
向獨立組網(SA)5G的過渡速度比通訊業者最初預測的要快,邊緣節點的部署進度也隨之加快。到2025年底,中國SA的普及率將達到79%,印度達到49.2%,新加坡達到37%。市場宣傳與核心網升級之間的差距顯而易見:儘管已有384家營運商推出了商用5G服務,但全球整體僅有192通訊業者宣布向SA架構過渡。 SA核心網路支援網路切片和超低延遲、高可靠性(URLLC)服務,從而提升了對分散式運算的需求。在日本,全端虛擬化網路在運作無線接取網路(RAN)智慧控制器後,能耗降低了約20%,同時營運成本也降低了。推遲升級到SA的通訊業者可能會面臨失去工業客戶的風險,因為競爭對手能夠保證絕對的延遲。
超低延遲企業用例激增
如今,製造業、醫療保健和能源公司對封閉回路型控制和遠端操作的延遲要求低於 10 毫秒。一項於 2025 年開展的時間敏感型網路試驗在 5G 網路上實現了 122 奈秒的同步,使得先前依賴工業乙太網的機器人組裝成為可能。一家食品加工廠利用本地邊緣運算和私人 5G 網路,實現了 6 毫秒的預測性維護警報,從而減少了意外停機時間。遠端手術實驗證實,觸覺回饋的最大延遲僅為 1-5 毫秒——這是數百公里外集中式雲端平台無法實現的。超過 90% 的試點私人 5G 部署公司表示,他們在 12 個月內實現了投資回報,這主要歸功於生產力的提高,而非連接成本的降低。因此,通訊邊緣基礎設施市場正在從早期採用者擴展到包括通用營運技術 (OT) 買家。
MEC 和 Open RAN 協定堆疊中的標準分片
並行運作的標準化機構發布了冗餘且相容性極差的規範。 2025 年 PlugFest 測試顯示,多廠商無線接取網路 (RAN) 元件的整合失敗率超過 30%。通訊業者通常為每個供應商的邊緣平台維護獨立的編配平面,這增加了資本和工程成本。雖然垂直整合可以降低風險,但也加劇了對廠商鎖定的擔憂。缺乏統一的框架正在阻礙技術的廣泛應用,並抑制投資熱情。
細分市場分析
預計到2031年,軟體產業將實現最快成長,增幅達20.88%,而硬體在2025年仍佔總營收的53.41%。隨著虛擬化用戶平面功能和防火牆遷移到Kubernetes容器,通訊邊緣基礎設施市場的軟體市場預計將會擴張,通訊業者將擺脫對特定廠商設備的依賴。硬體正趨於商品化,通用客戶終端設備(CPE)和白盒伺服器的普及導致利潤率下降,但供應商數量卻在增加。多家廠商提供的編配平台能夠簡化複雜性,並將服務引進週期從數月縮短至數週。由於大多數通訊業者缺乏內部雲端工程能力,提供整合式託管服務仍然至關重要,系統整合商有望擴大其在相關領域的支出佔有率。
另一個趨勢是,晶片製造商將加速卡與開放原始碼框架捆綁銷售,以簡化部署並提升效能。作為回應,供應商推出了專為嚴苛基地台環境設計的堅固型邊緣伺服器。通訊邊緣基礎設施市場仍在努力平衡成本最佳化的通用設備和高階整合堆棧,後者提供全生命週期服務,旨在降低保守型網路營運商的部署風險。
儘管宏觀和微觀站點仍佔據部署主導地位,但企業內部部署預計將成長 22.02%,反映出工廠、醫院和港口等行業對企業內部部署的需求日益成長。隨著工廠內部的機器控制迴路擴大由專用網路處理,企業站點通訊邊緣基礎設施的市場佔有率預計將會擴大。聚合中心可以彌補對延遲容忍度低於 20 毫秒的工作負載的性能不足,而維修的中心機房則可提供經濟高效的區域覆蓋。
工業領域的私人客戶優先考慮確定性性能和數據主權,因此他們要么自行託管計算資源,要么將其外包給專業的整合商。通訊業者正透過託管式私有 5G 服務來維持其市場地位,但激烈的競爭正在壓縮其毛利率。白盒設備和開放原始碼管理堆疊降低了准入門檻,並鼓勵工廠業主嘗試多供應商架構。
區域分析
亞太地區引領5G部署,預計到2025年將佔全球營收的42.52%,複合年成長率(CAGR)預計為21.61%。中國、日本和韓國的全國性5G涵蓋得益於高密度光纖回程傳輸,為智慧製造群內的大規模邊緣節點提供保障。在印度,獨立組網(SA)5G正在第一線城市部署,但農村地區光纖網路的匱乏阻礙了5G的全面部署。東南亞(如新加坡和泰國)的智慧城市計畫正在加速公共部門在邊緣運算方面的支出。
北美地區約佔全球銷售額的四分之一。美國通訊業者正在部署超過30個城域邊緣區域,主要面向遊戲、電腦視覺和零售分析領域。加拿大正利用政府的數位轉型獎勵,在汽車和航太工廠建造專用網路。通訊業者透過服務等級協定 (SLA) 來提升自身競爭力,這些協定承諾在混合環境中實現低於20毫秒的延遲。
歐洲的整體佔有率與此類似,這主要得益於「數位十年」的需求,即Gigabit通訊的廣泛應用。德國、法國和西班牙正著力建造面向工業和汽車產業的光纖走廊,而北歐國家則利用豐富的可再生能源提供碳中和的邊緣託管服務。標準的碎片化和頻段許可的複雜性導致整合進程延遲,但強大的光纖基礎設施正在為長期擴展奠定基礎。
中東和非洲各地的進展不一。海灣國家正利用其較高的可支配收入和政府的經濟多元化政策,部署邊緣平台以建立智慧城市。同時,撒哈拉以南非洲地區仍然存在光纖覆蓋盲區,迫使通訊業者將重點放在宏基地台部署和衛星回程傳輸上,以支援邊緣部署。在南美洲,巴西和阿根廷的發展勢頭強勁。儘管這些國家的都市區5G覆蓋率和產業界對5G的興趣都在不斷成長,但有關頻率上限的監管不確定性正在減緩5G向多個國家的擴展。
其他好處:
- Excel格式的市場預測(ME)表
- 3個月的分析師支持
目錄
第1章:引言
- 研究假設和市場定義
- 調查範圍
第2章:調查方法
第3章執行摘要
第4章 市場狀況
- 市場概覽
- 市場促進因素
- 5G NR部署正在加速。
- 超低延遲企業用例激增
- 私有 5G 和園區網路的部署
- 通訊業者的資本支出(CAPEX)正轉向分散式雲端架構。
- 適用於敏捷邊緣應用的 RAN 智慧型控制器 (RIC)
- 微邊緣永續性獎勵(可再生能源)
- 市場限制因素
- MEC 和 Open RAN 協定堆疊中的標準分片
- 該場地初期電力和冷卻成本較高。
- 通訊業者(CSP) 缺乏邊緣到核心的編配能力
- 新興市場光纖回程傳輸瓶頸
- 產業價值鏈分析
- 監理情勢
- 技術展望
- 波特五力分析
- 新進入者的威脅
- 供應商的議價能力
- 買方的議價能力
- 替代品的威脅
- 競爭公司之間的競爭
第5章 市場規模與成長預測
- 按組件
- 硬體
- 邊緣伺服器
- uCPE/白盒
- 無線存取網分散式單元(DU)
- 軟體
- 虛擬化網路功能
- 邊緣編配平台
- 服務
- 硬體
- 按邊緣位置
- 宏/微蜂窩行動通訊基地台
- 聚合中心
- 中央辦公室
- 區域資料中心
- 企業本地邊緣
- 按部署模式
- 現場
- 通訊業者/私有雲端
- 混合
- 透過使用
- 高級行動寬頻(eMBB)
- 大規模物聯網(mMTC)
- 關鍵任務/超可靠低延遲通訊
- 按最終用戶行業分類
- 通訊業者
- 製造業
- 衛生保健
- 媒體與娛樂
- 運輸/物流
- 其他終端用戶產業
- 按地區
- 北美洲
- 美國
- 加拿大
- 墨西哥
- 南美洲
- 巴西
- 阿根廷
- 南美洲其他地區
- 歐洲
- 德國
- 英國
- 法國
- 俄羅斯
- 其他歐洲地區
- 亞太地區
- 中國
- 日本
- 印度
- 韓國
- 亞太其他地區
- 中東和非洲
- 中東
- 沙烏地阿拉伯
- 阿拉伯聯合大公國
- 其他中東國家
- 非洲
- 南非
- 奈及利亞
- 其他非洲地區
- 中東
- 北美洲
第6章 競爭情勢
- 市場集中度
- 策略趨勢
- 市佔率分析
- 公司簡介
- Telefonaktiebolaget LM Ericsson
- Nokia Corporation
- Huawei Technologies Co., Ltd.
- Cisco Systems, Inc.
- Samsung Electronics Co., Ltd.
- ZTE Corporation
- NEC Corporation
- Dell Technologies Inc.
- Hewlett Packard Enterprise Company
- Intel Corporation
- Juniper Networks, Inc.
- VMware, Inc.(Broadcom)
- Red Hat, Inc.(International Business Machines Corporation)
- Amazon Web Services, Inc.
- Microsoft Corporation
- Google LLC
- Mavenir Systems, Inc.
- Parallel Wireless, Inc.
- Rakuten Symphony, Inc.(Rakuten Group, Inc.)
- Affirmed Networks, Inc.(Microsoft Corporation)
第7章 市場機會與未來展望
The Telecom Edge Infrastructure Market size is expected to grow from USD 6.61 billion in 2025 to USD 7.83 billion in 2026 and is forecast to reach USD 17.52 billion by 2031 at 17.48% CAGR over 2026-2031. Rising traffic from 5G devices, tighter latency targets for factory automation, and tier-1 operator capital re-allocation toward micro-edge nodes underpin this acceleration. Hardware still dominates spending, yet software-defined network functions and orchestration platforms are capturing incremental value as carriers shift from purpose-built appliances to cloud-native workloads. Hyperscale cloud providers are embedding compute at cell-site distances, giving enterprises quick access to sub-10 millisecond round-trip latency and tilting the balance of power away from traditional equipment vendors. Regulatory deadlines for gigabit connectivity and data residency add urgency, while energy-saving RAN controllers improve total cost of ownership and reinforce the business case for distributed deployments.
Global Telecom Edge Infrastructure Market Trends and Insights 5G NR Roll-Out Acceleration
Standalone 5G migration is advancing faster than initial operator forecasts, compressing the schedule for edge node deployment. China recorded 79% standalone penetration by late 2025, while India reached 49.2% and Singapore 37%. The decoupling between marketing claims and core-network upgrades is evident in the 192 operators globally that committed to a standalone architecture, compared with 384 commercial 5G launches. Standalone cores unlock network slicing and URLLC services, sharpening demand for distributed compute. Japan's full-stack virtualized network achieved roughly 20% energy savings after the activation of the RAN Intelligent Controller, illustrating parallel opex benefits. Operators that defer standalone upgrades risk ceding industrial clients to rivals able to guarantee deterministic latency.
Surge in Ultra-Low-Latency Enterprise Use-Cases
Manufacturing, healthcare, and energy firms now require sub-10-millisecond latency for closed-loop control and teleoperation. A 2025 time-sensitive networking trial achieved 122-nanosecond synchronization over 5G, enabling robotic assembly that once relied on industrial Ethernet. Food-processing plants using private 5G with on-prem edge compute issued predictive-maintenance alerts in 6 milliseconds, cutting unplanned downtime. Remote surgery experiments established a 1-5 millisecond latency ceiling for haptic feedback, unachievable from centralized clouds hundreds of kilometers away. Above 90% of enterprises piloting private 5G reported payback within 12 months, driven more by productivity gains than by connectivity cost reductions. The telecom edge infrastructure market is therefore extending beyond early adopters into mainstream operational technology buyers.
Fragmented Standards Across MEC and Open RAN Stacks
Parallel standard bodies publish overlapping specifications that rarely interoperate cleanly. PlugFest testing in 2025 revealed integration failures topping 30% for multi-vendor RAN elements. Operators often maintain separate orchestration planes for each supplier's edge platform, inflating both capital and engineering costs. Vertical integration can reduce risk but raises fears of vendor lock-in. The absence of a unified framework delays broad adoption and cools investment appetite.
Other drivers and restraints analyzed in the detailed report include:
- Private 5G and Campus Networks Adoption
- Telco CAPEX Shift Toward Distributed Cloud Architecture
- High Upfront Site Power and Cooling Costs
For complete list of drivers and restraints, kindly check the Table Of Contents.
Segment Analysis
Software captured the fastest growth, rising 20.88% through 2031, while hardware retained 53.41% of 2025 revenue. The telecom edge infrastructure market size for software is projected to expand as virtualized user-plane functions and firewalls migrate to Kubernetes containers, freeing operators from proprietary appliances. Universal customer-premises equipment and white-box servers commoditize hardware, lowering margins yet enlarging the pool of suppliers. Orchestration platforms from multiple vendors abstract complexity, cutting service introduction cycles from months to weeks. Integration and managed-service offers remain vital because most carriers lack in-house cloud engineering skills, positioning system integrators to capture a rising share of spending.
A secondary trend sees chip manufacturers bundling accelerator cards with open-source frameworks, simplifying deployment and boosting performance. Hardware vendors respond by shipping ruggedized edge servers built for harsh cell-site environments. The telecom edge infrastructure market continues to balance between cost-optimizing commodity gear and premium, integrated stacks packaged with lifecycle services that de-risk adoption for conservative network operators.
Macro and micro sites still lead deployments, yet on-premises enterprise locations are forecast to grow at 22.02%, reflecting surging interest from factories, hospitals, and ports. The telecom edge infrastructure market share for enterprise sites is set to grow as private networks handle machine control loops on plant floors. Aggregation hubs fill a performance gap for workloads tolerant of sub-20 millisecond latency, while refurbished central offices drive cost-efficient regional coverage.
Private industrial clients prize deterministic performance and data sovereignty, pushing them to self-host compute or contract specialized integrators. Telecom operators counter with managed private 5G to defend relevance, but intense price competition shrinks gross margins. White-box gear and open-source management stacks lower entry barriers, encouraging plant owners to experiment with multi-vendor architectures.
The Telecom Edge Infrastructure Market Report is Segmented by Component (Hardware, Software, and Services), Edge Location (Macro/Micro Cell Sites, Aggregation Hubs, and More), Deployment Model (On-Premise, Telco/Private Cloud, and Hybrid), Application (Enhanced Mobile Broadband (eMBB), and More), End-User Industry (Telecom Operators, Manufacturing, and More), and Geography. The Market Forecasts are Provided in Terms of Value (USD).
Geography Analysis
Asia-Pacific leads adoption, accounting for 42.52% of 2025 revenue and a forecast CAGR of 21.61%. Nationwide 5G coverage in China, Japan, and South Korea, underpinned by dense fiber backhaul, supports large-scale edge nodes inside smart-manufacturing clusters. India rolls out standalone 5G across tier-1 and tier-2 cities, though rural fiber scarcity tempers uniform distribution. Southeast Asian smart-city programs in Singapore and Thailand accelerate public-sector edge spending.
North America contributes roughly one-quarter of revenue. U.S. operators deploy thirty-plus metro edge zones to target gaming, computer vision, and retail analytics. Canada builds private networks in automotive and aerospace plants, leveraging government incentives for digital transformation. Operators differentiate through service-level agreements that guarantee sub-20 millisecond latency across hybrid footprints.
Europe records a similar aggregate share, spurred by the Digital Decade requirement for gigabit coverage. Germany, France, and Spain focus on industrial and automotive corridors, while the Nordics exploit abundant renewable energy to offer carbon-neutral edge hosting. Standards fragmentation and spectrum licensing complexities introduce integration delays, yet robust fiber infrastructure smooths long-run scaling.
The Middle East and Africa see uneven progress. Gulf states leverage high disposable income and government diversification agendas to deploy smart-city edge platforms. Sub-Saharan Africa endures fiber gaps, forcing operators to concentrate on macro-site deployments and satellite backhaul for edge outreach. South America gains momentum in Brazil and Argentina, where urban 5G coverage and industrial interest coincide, though regulatory uncertainty around spectrum caps slows multi-country expansion.
List of Companies Covered in this Report:
- Telefonaktiebolaget LM Ericsson
- Nokia Corporation
- Huawei Technologies Co., Ltd.
- Cisco Systems, Inc.
- Samsung Electronics Co., Ltd.
- ZTE Corporation
- NEC Corporation
- Dell Technologies Inc.
- Hewlett Packard Enterprise Company
- Intel Corporation
- Juniper Networks, Inc.
- VMware, Inc. ( Broadcom)
- Red Hat, Inc. (International Business Machines Corporation)
- Amazon Web Services, Inc.
- Microsoft Corporation
- Google LLC
- Mavenir Systems, Inc.
- Parallel Wireless, Inc.
- Rakuten Symphony, Inc. (Rakuten Group, Inc.)
- Affirmed Networks, Inc. (Microsoft Corporation)
Additional Benefits:
- The market estimate (ME) sheet in Excel format
- 3 months of analyst support
TABLE OF CONTENTS
1 INTRODUCTION
- 1.1 Study Assumptions and Market Definition
- 1.2 Scope of the Study
2 RESEARCH METHODOLOGY
3 EXECUTIVE SUMMARY
4 MARKET LANDSCAPE
- 4.1 Market Overview
- 4.2 Market Drivers
- 4.2.1 5G NR Roll-Out Acceleration
- 4.2.2 Surge in Ultra-Low-Latency Enterprise Use-Cases
- 4.2.3 Private 5G and Campus Networks Adoption
- 4.2.4 Telco CAPEX Shift Toward Distributed Cloud Architecture
- 4.2.5 RAN Intelligent Controller (RIC) Enabling Agile Edge Apps
- 4.2.6 Micro-Edge Sustainability Incentives (Renewable Power)
- 4.3 Market Restraints
- 4.3.1 Fragmented Standards Across MEC and Open RAN Stacks
- 4.3.2 High Upfront Site Power and Cooling Costs
- 4.3.3 Limited Edge-To-Core Orchestration Skill-Set Among CSPs
- 4.3.4 Fiber Backhaul Bottlenecks in Emerging Economies
- 4.4 Industry Value Chain Analysis
- 4.5 Regulatory Landscape
- 4.6 Technological Outlook
- 4.7 Porter's Five Forces Analysis
- 4.7.1 Threat of New Entrants
- 4.7.2 Bargaining Power of Suppliers
- 4.7.3 Bargaining Power of Buyers
- 4.7.4 Threat of Substitutes
- 4.7.5 Competitive Rivalry
5 MARKET SIZE AND GROWTH FORECASTS (VALUE)
- 5.1 By Component
- 5.1.1 Hardware
- 5.1.1.1 Edge Servers
- 5.1.1.2 uCPE / White-box
- 5.1.1.3 RAN Distributed Units (DU)
- 5.1.2 Software
- 5.1.2.1 Virtualized Network Functions
- 5.1.2.2 Edge Orchestration Platforms
- 5.1.3 Services
- 5.1.1 Hardware
- 5.2 By Edge Location
- 5.2.1 Macro / Micro Cell Sites
- 5.2.2 Aggregation Hubs
- 5.2.3 Central Offices
- 5.2.4 Regional Data Centers
- 5.2.5 Enterprise On-prem Edge
- 5.3 By Deployment Model
- 5.3.1 On-premises
- 5.3.2 Telco / Private Cloud
- 5.3.3 Hybrid
- 5.4 By Application
- 5.4.1 Enhanced Mobile Broadband (eMBB)
- 5.4.2 Massive IoT (mMTC)
- 5.4.3 Mission-critical / URLLC
- 5.5 By End-user Industry
- 5.5.1 Telecom Operators
- 5.5.2 Manufacturing
- 5.5.3 Healthcare
- 5.5.4 Media and Entertainment
- 5.5.5 Transportation and Logistics
- 5.5.6 Other end-user Industries
- 5.6 By Geography
- 5.6.1 North America
- 5.6.1.1 United States
- 5.6.1.2 Canada
- 5.6.1.3 Mexico
- 5.6.2 South America
- 5.6.2.1 Brazil
- 5.6.2.2 Argentina
- 5.6.2.3 Rest of South America
- 5.6.3 Europe
- 5.6.3.1 Germany
- 5.6.3.2 United Kingdom
- 5.6.3.3 France
- 5.6.3.4 Russia
- 5.6.3.5 Rest of Europe
- 5.6.4 Asia-Pacific
- 5.6.4.1 China
- 5.6.4.2 Japan
- 5.6.4.3 India
- 5.6.4.4 South Korea
- 5.6.4.5 Rest of Asia-Pacific
- 5.6.5 Middle East and Africa
- 5.6.5.1 Middle East
- 5.6.5.1.1 Saudi Arabia
- 5.6.5.1.2 United Arab Emirates
- 5.6.5.1.3 Rest of the Middle East
- 5.6.5.2 Africa
- 5.6.5.2.1 South Africa
- 5.6.5.2.2 Nigeria
- 5.6.5.2.3 Rest of Africa
- 5.6.5.1 Middle East
- 5.6.1 North America
6 COMPETITIVE LANDSCAPE
- 6.1 Market Concentration
- 6.2 Strategic Moves
- 6.3 Market Share Analysis
- 6.4 Company Profiles (includes Global level Overview, Market level overview, Core Segments, Financials as available, Strategic Information, Market Rank/Share for key companies, Products and Services, and Recent Developments)
- 6.4.1 Telefonaktiebolaget LM Ericsson
- 6.4.2 Nokia Corporation
- 6.4.3 Huawei Technologies Co., Ltd.
- 6.4.4 Cisco Systems, Inc.
- 6.4.5 Samsung Electronics Co., Ltd.
- 6.4.6 ZTE Corporation
- 6.4.7 NEC Corporation
- 6.4.8 Dell Technologies Inc.
- 6.4.9 Hewlett Packard Enterprise Company
- 6.4.10 Intel Corporation
- 6.4.11 Juniper Networks, Inc.
- 6.4.12 VMware, Inc. ( Broadcom)
- 6.4.13 Red Hat, Inc. (International Business Machines Corporation)
- 6.4.14 Amazon Web Services, Inc.
- 6.4.15 Microsoft Corporation
- 6.4.16 Google LLC
- 6.4.17 Mavenir Systems, Inc.
- 6.4.18 Parallel Wireless, Inc.
- 6.4.19 Rakuten Symphony, Inc. (Rakuten Group, Inc.)
- 6.4.20 Affirmed Networks, Inc. (Microsoft Corporation)
7 MARKET OPPORTUNITIES AND FUTURE OUTLOOK
- 7.1 White-space and Unmet-need Assessment