


 |
市場調查報告書
商品編碼
2043974
身臨其境型娛樂:市場佔有率分析、產業趨勢與統計、成長預測(2026-2031)Immersive Entertainment - Market Share Analysis, Industry Trends & Statistics, Growth Forecasts (2026 - 2031) |
||||||

※ 本網頁內容可能與最新版本有所差異。詳細情況請與我們聯繫。
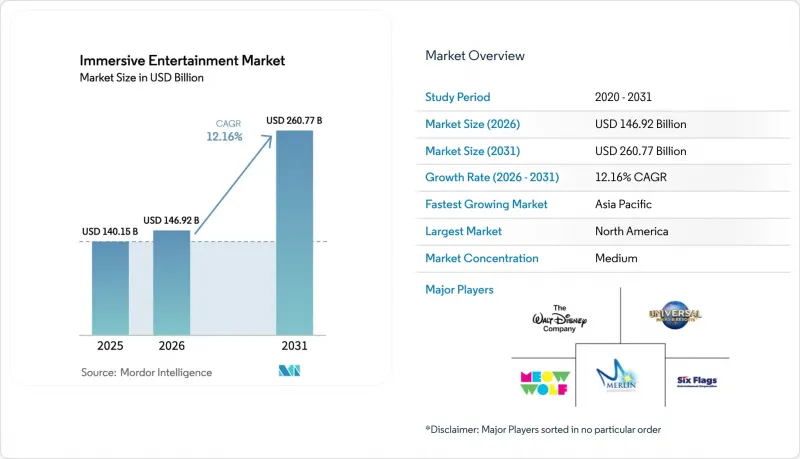
身臨其境型娛樂市場預計將從 2025 年的 1,401.5 億美元成長到 2026 年的 1,469.2 億美元,到 2031 年達到 2,607.7 億美元,2026 年至 2031 年的複合年成長率為 12.16%。
對共用戶外體驗日益成長的需求、數十億美元的設施再投資以及人工智慧驅動的定價引擎,正在推高每位遊客的平均消費額,同時降低收入波動性。資本流入正在加速,體驗式房地產投資信託基金(REITs)為設施擴建提供資金支持,並降低了營運商的資本成本。同時,5G驅動的混合實境(MR)技術和價格適中的觸覺硬體使得老舊景點的現代化改造成本遠低於新建設。這些變化使得營運商能夠在成熟地區傳統主題樂園客流量趨於平穩的情況下,擴大其在消費者支出中的佔有率。
全球身臨其境型娛樂市場趨勢與洞察
主題樂園投資計畫的蓬勃發展正在推動市場擴張。
為了保持定價權並延長遊客停留時間,營運商們正投入創紀錄的資金用於建造新區域、景點系統和飯店設施。華特迪士尼公司承諾在2034年將投入600億美元用於主題樂園和體驗式內容,這一數字超過了其串流媒體業務的預算。環球影城計畫於2025年5月在奧蘭多開設耗資50億美元的「史詩宇宙」(Epic Universe)度假村,新增750英畝土地和多個自有IP主題區。合併後的六旗雪松會(Six Flags Cedar Fair)目前經營42個主題樂園,充分利用採購協同效應和跨園季票的互通性。這種巨額資本投資打造了競爭優勢(護城河),因為規模小規模的競爭對手缺乏足夠的財力來提供高品質的多感官體驗,這使得頂級業者能夠將門票價格提高40%至60%。
後疫情時代消費者從「物品」轉向「體驗」。
全球家庭支出持續從物質商品轉向體驗式消費,Z世代和千禧世代更傾向於選擇值得在社群媒體上分享的活動。營運公司圍繞著可分享的瞬間設計景點,例如Meowwolf的萬花筒般房間,據估計,與付費數位廣告相比,這種設計可降低30-40%的客戶獲取成本。社群電商進一步擴大了受眾範圍。 teamLab在東京舉辦的展覽中,使用者生成內容約佔年度門票銷售的一半。因此,即使自由裁量權支配支出放緩,對參觀頻率的影響也有限。
保險和安全合規成本不斷上漲
一系列事故發生後,承保標準收緊,導致2024年至2025年間互動景點的保險費上漲了15%至20%。虛擬實境(VR)設施的免賠額提高至5萬至7.5萬美元,而為符合ASTM F24和ISO 17025標準而進行的檢查和整改費用每年高達25萬美元。小規模業者面臨不成比例的負擔,固定遵循成本佔其收入的8%至12%,而擁有專門安全團隊的大型連鎖企業這一比例僅為2%至3%。為了應對這一局面,營運商們正在進行整合或退出市場,將市場佔有率拱手讓給那些擁有更雄厚財力來承擔監管成本的營運商。
細分市場分析
到2025年,主題樂園式娛樂將佔應用收入的40.83%,這反映了數十年來景點設施的累積和幾代人的品牌忠誠度。然而,以活動為中心的沉浸式娛樂市場正在擴張,電子競技場館整合了VR戰鬥區域,從參賽者和觀眾身上都能獲得收入,其中身臨其境型遊戲活動預計將以12.20%的複合年成長率實現最高成長。恐怖景點和身臨其境型遊戲仍然是投資者青睞的領域,因為即使每個場館的開業成本僅為20萬至50萬美元,它們也只需兩個旺季即可收回投資。
回頭客正成為一項關鍵指標。 Dave and Buster's 的 VR 電競休息室近期進行了測試,結果顯示顧客停留時間增加了 35%,每次造訪的餐飲消費也增加了 18 至 22 美元。像 Punchdrunk 的《不眠之夜》(Sleep No More)這樣的身臨其境型劇院票價高昂,但由於每場演出都需要自己的演員和場地,因此其規模擴張較為緩慢。由 teamLab 主導的體驗式博物館在資本投資攤銷後能夠帶來高利潤,這證明在不斷擴張的身臨其境型娛樂市場中,美學創新可以與敘事性 IP 相媲美。
虛擬實境(VR)技術,得益於售價低於500美元的頭戴式設備以及豐富的節目庫,預計將在2025年佔科技支出的31.73%。觸覺和多感官鑽機,例如動感座椅、觸覺背心和香氛噴霧器,預計將以12.23%的複合年成長率成長,從而支撐起高價位的門票,並在高階身臨其境型娛樂體驗領域保持市場佔有率。雖然擴增實境(AR)技術由於電池續航時間和設備細分等原因發展滯後,但像《瑪利歐賽車:庫巴挑戰賽》這樣的混合實境(MR)體驗已經證明,將可操作場景與AR技術融合,可以有效延長玩家的等待時間,即使超過一小時也能持續吸引玩家。
迪士尼的《銀河守護隊:宇宙倒帶》整合了可程式設計的12自由度動感座椅,並額外收取20-30美元以提升體驗。 D-BOX Technologies等供應商報告稱,由於家用VR產品日益普及,來自相關企業的訂單增加了40-50%。這些升級強化了「身臨其境才能體驗」的獨特優勢,並擴大了廣泛運用觸覺技術的身臨其境型娛樂項目的市場規模。
區域分析
預計到2025年,北美將佔全球收入的44.52%,這主要得益於佛羅裡達州和加州密集的遊樂園生態系統,這兩個州去年吸引了約9,000萬遊客。較高的可支配收入意味著人均每日消費超過100美元。像迪士尼的Genie+這樣的AI驅動定價平台也讓人均收入增加了8至12美元。市場飽和促使營運商投資高階附加價值服務,而不是簡單地擴大規模,儘管遊客數量趨於穩定,身臨其境型娛樂市場依然蓬勃發展。
亞太地區是成長最快的區域,預計複合年成長率將達到12.39%。這主要得益於中國的文化旅遊政策和日本在投影映射技術領域的領先地位。沙烏地阿拉伯耗資80億美元的「吉迪亞」(Qiddiya)綜合體就是一個絕佳的例子,它展現了海灣國家的巨型計畫如何吸引業界領先的營運商,從而在該地區超越競爭對手。東南亞中產階級的可支配收入正在突破閾值,而這項門檻歷來是推動身臨其境型娛樂市場快速成長的主要動力。
歐洲預計在2025年將貢獻約四分之一的收入,但受限於較短的營業季和較低的人均消費水準。然而,歐洲擁有諸如「光之工作室」(Atelier des Lumières)等藝術投影場所,這表明文化遺產與數位藝術的融合即使在夏季旺季之外也能維持市場需求。中東和非洲雖然規模較小,但受惠於政府對大規模綜合度假村的資助,正逐步擴大其在該地區身臨其境型娛樂市場的佔有率。
其他好處
- Excel格式的市場預測(ME)表
- 3個月的分析師支持
目錄
第1章:引言
- 研究假設和市場定義
- 調查範圍
第2章:調查方法
第3章執行摘要
第4章 市場狀況
- 市場概覽
- 市場促進因素
- 主題樂園的爆炸性資本投資計劃
- 後疫情時代消費者從「物品」轉向「體驗」。
- 基於位置的虛擬實境經營模式正在迅速成熟。
- 借助 5G 和邊緣運算實現即時多用戶 AR 疊加。
- 體驗式房地產投資信託基金正在開發一種新的融資來源。
- 人工智慧驅動的動態票價正在提升人均消費。
- 市場限制因素
- 保險和安全合規成本不斷上漲
- 智慧財產權擁有者對內容許可的抵觸情緒較弱
- 現場互動景點員工離職率率高
- 社區對「沉浸式疲勞」的強烈反對
- 價值鏈分析
- 監理情勢
- 宏觀經濟因素對市場的影響
- 波特五力分析
- 供應商的議價能力
- 買方的議價能力
- 新進入者的威脅
- 替代品的威脅
- 競爭公司之間的競爭
第5章 市場規模與成長預測
- 透過使用
- 主題娛樂
- 恐怖景點和密室逃脫遊戲
- 身臨其境型戲劇
- 體驗式博物館
- 在貿易展覽會和零售店實施
- 身臨其境型現場遊戲活動
- 透過技術
- 虛擬實境(VR)
- 擴增實境(AR)
- 3D音訊和空間音效
- 混合實境(MR)
- 觸覺和多感官技術
- 依場地類型
- 主題樂園與遊樂園
- 家庭娛樂中心
- 博物館和美術館
- 獨立身臨其境型設施
- 臨時和限時設施
- 按收入來源
- 門票銷售
- 飲食
- 商品
- 贊助和品牌夥伴關係
- 知識產權許可和版稅
- 訂閱和會員計劃
- 按地區
- 北美洲
- 美國
- 加拿大
- 墨西哥
- 南美洲
- 巴西
- 阿根廷
- 南美洲其他地區
- 歐洲
- 德國
- 英國
- 法國
- 義大利
- 西班牙
- 其他歐洲國家
- 亞太地區
- 中國
- 日本
- 印度
- 韓國
- ASEAN
- 亞太其他地區
- 中東
- 沙烏地阿拉伯
- 阿拉伯聯合大公國
- 其他中東國家
- 非洲
- 南非
- 奈及利亞
- 埃及
- 其他非洲地區
- 北美洲
第6章 競爭情勢
- 市場集中度
- 策略趨勢
- 市佔率分析
- 公司簡介
- teamLab Inc.
- Meow Wolf, LLC
- Secret Cinema Limited
- Culturespaces SAS
- Museum of Ice Cream, Inc.
- Grande Experiences Pty Ltd.
- The Walt Disney Company
- Universal Parks and Resorts(Comcast Corp.)
- Six Flags Entertainment Corp.
- Cedar Fair Entertainment Company
- Merlin Entertainments Limited
- SeaWorld Entertainment, Inc.
- Parques Reunidos Servicios Centrales SA
- Moment Factory Inc.
- Punchdrunk Global Limited
- Illuminarium Experiences LLC
- Superblue Miami LLC
- Sandbox VR, Inc.
- Holovis International Limited
- Framestore Limited
- Felix and Paul Studios Inc.
- Darkfield Radio Limited
- The VOID, LLC
- Coastiality(Mack International GmbH)
- Dave and Buster's Entertainment, Inc.
- Framestore Ltd.
第7章 市場機會與未來展望
The immersive entertainment market size is expected to increase from USD 140.15 billion in 2025 to USD 146.92 billion in 2026 and reach USD 260.77 billion by 2031, growing at a CAGR of 12.16% over 2026-2031. Pent-up demand for shared, out-of-home experiences, multi-billion-dollar venue reinvestment, and AI-driven pricing engines are raising average guest spend while smoothing revenue volatility. Capital flows are accelerating, with experiential real-estate investment trusts underwriting venue build-outs and reducing operators' cost of capital. Concurrently, 5G-enabled mixed-reality overlays and affordable haptic hardware are refreshing aging attractions at far lower cost than ground-up construction. These shifts allow operators to capture larger consumer-wallet share even as traditional theme-park attendance plateaus in mature regions.
Global Immersive Entertainment Market Trends and Insights
Explosive Theme-Park CAPEX Pipelines Drive Market Expansion
Operators are pouring record sums into new lands, ride systems, and hospitality assets to defend pricing power and lengthen guest stays. The Walt Disney Company earmarked USD 60 billion for parks and experiences through 2034, eclipsing its streaming budget. Universal is debuting the USD 5 billion Epic Universe resort in Orlando in May 2025, adding 750 acres and several proprietary IP zones. Merged Six Flags-Cedar Fair now manages 42 parks, unlocking procurement synergies and cross-park season-pass reciprocity. High CAPEX creates a moat because smaller rivals lack the balance-sheet strength to match multi-sensory fidelity, enabling tier-one operators to justify 40-60% ticket premiums.
Post-COVID "Experience over Things" Consumer Shift
Global household budget allocations continue to tilt toward live experiences over material goods, with Gen Z and millennials prioritizing social-media-worthy outings. Operators design attractions around shareable moments-such as Meow Wolf's kaleidoscopic rooms-cutting customer-acquisition costs by an estimated 30-40% versus paid digital advertising. Social commerce further amplifies reach; user-generated content from teamLab's Tokyo exhibitions accounts for roughly half of annual ticket sales. Consequently, even discretionary spending slowdowns have had a muted impact on visit frequency.
Rising Insurance and Safety-Compliance Costs
Premiums for interactive attractions jumped 15-20% in 2024-2025 after a spate of incidents prompted tighter underwriting. Deductibles for VR venues climbed to USD 50,000-75,000, while adherence to ASTM F24 and ISO 17025 standards adds up to USD 250,000 annually in inspection and remediation costs. Smaller operators face disproportionate burden, as fixed compliance expenses consume 8-12% of revenue versus 2-3% for large chains with dedicated safety teams. The strategic response: operators are consolidating or exiting, ceding market share to well-capitalized players who can absorb regulatory overhead.
Other drivers and restraints analyzed in the detailed report include:
- Fast-Maturing Location-Based VR Business Models
- 5G and Edge Computing Enable Real-Time Multi-User AR Overlays
- Content-Licensing Fatigue among IP Right-Holders
For complete list of drivers and restraints, kindly check the Table Of Contents.
Segment Analysis
Themed entertainment captured 40.83% of 2025 application revenue, reflecting decades of installed ride capacity and multi-generational brand loyalty. Live immersive gaming events, however, are projected to log the fastest 12.20% CAGR as esports arenas integrate VR battle zones that monetize both competitors and spectators, extending the immersive entertainment market size for event-focused venues. Haunted attractions and escape rooms remain attractive for investors because a single site can open for USD 0.2-0.5 million yet deliver paybacks within two peak seasons.
Repeat visitation is becoming a key metric. VR esports lounges piloted by Dave and Buster's delivered 35% longer dwell times and USD 18-22 incremental food-and-beverage spend per visit. Immersive theaters such as Punchdrunk's Sleep No More command premium price points but scale slowly because each production requires bespoke casts and venues. Experiential art museums, led by teamLab, generate high margins once installations are amortized, proving that aesthetic novelty can rival narrative IP in expanding the immersive entertainment market.
Virtual reality accounted for 31.73% of 2025 technology spend, boosted by sub-USD 500 headsets and evergreen content libraries. Haptics and multisensory rigs are forecast to rise at 12.23% CAGR, leveraging motion seats, tactile vests, and scent cannons to justify premium ticket tiers and defend the immersive entertainment market share of premium experiences. Augmented reality adoption lags due to battery life and device fragmentation, yet mixed-reality hybrids such as Mario Kart: Bowser's Challenge prove that practical sets fused with AR can sustain hour-plus queue times.
Disney's Guardians of the Galaxy, Cosmic Rewind integrates programmable motion seats delivering 12 degrees of freedom, commanding USD 20-30 upcharges for enhanced rides. Suppliers including D-BOX Technologies report 40-50% order growth from operators combating at-home VR commoditization. Such upgrades solidify "you-must-be-there" differentiation and expand the immersive entertainment market size for haptic-rich attractions.
The Immersive Entertainment Market Report is Segmented by Application (Themed Entertainment, Haunted Attractions and Escape Rooms, and More), Technology (Virtual Reality, Augmented Reality, and More), Venue Type (Theme and Amusement Parks, Family/Indoor Entertainment Centers, and More), Revenue Stream (Ticket Sales, Food and Beverage, and More), and Geography. The Market Forecasts are Provided in Terms of Value (USD).
Geography Analysis
North America retained 44.52% of 2025 global revenue, anchored by Florida's and California's dense theme-park ecosystems that pulled roughly 90 million visits last year. High disposable income supports an average daily per-capita spend of USD 100-plus, while AI-driven pricing platforms such as Disney's Genie+ lifted per-guest revenue by USD 8-12. Market saturation is prompting operators to invest in premium add-ons rather than raw capacity, sustaining the immersive entertainment market despite plateauing attendance.
Asia-Pacific is the fastest-growing region, with a projected 12.39% CAGR, propelled by China's cultural tourism mandates and Japan's leadership in projection-mapping artistry. Saudi Arabia's USD 8 billion Qiddiya complex exemplifies how Gulf giga-projects are importing best-in-class operators to leapfrog regional competition. Southeast Asia's middle class is crossing discretionary-income thresholds that historically trigger accelerated adoption in the immersive entertainment market.
Europe accounted for roughly one-quarter of revenue in 2025 but is constrained by shorter operating seasons and lower per-visitor spend. Yet the continent is home to artistic projection venues such as Atelier des Lumieres, illustrating that cultural heritage fused with digital art can sustain demand outside peak summer months. The Middle East and Africa segment, while small, benefits from sovereign funding backing large-scale integrated resorts, progressively lifting the immersive entertainment market share of the region.
List of Companies Covered in this Report:
- teamLab Inc.
- Meow Wolf, LLC
- Secret Cinema Limited
- Culturespaces SAS
- Museum of Ice Cream, Inc.
- Grande Experiences Pty Ltd.
- The Walt Disney Company
- Universal Parks and Resorts (Comcast Corp.)
- Six Flags Entertainment Corp.
- Cedar Fair Entertainment Company
- Merlin Entertainments Limited
- SeaWorld Entertainment, Inc.
- Parques Reunidos Servicios Centrales S.A.
- Moment Factory Inc.
- Punchdrunk Global Limited
- Illuminarium Experiences LLC
- Superblue Miami LLC
- Sandbox VR, Inc.
- Holovis International Limited
- Framestore Limited
- Felix and Paul Studios Inc.
- Darkfield Radio Limited
- The VOID, LLC
- Coastiality (Mack International GmbH)
- Dave and Buster's Entertainment, Inc.
- Framestore Ltd.
Additional Benefits:
- The market estimate (ME) sheet in Excel format
- 3 months of analyst support
TABLE OF CONTENTS
1 INTRODUCTION
- 1.1 Study Assumptions and Market Definition
- 1.2 Scope of the Study
2 RESEARCH METHODOLOGY
3 EXECUTIVE SUMMARY
4 MARKET LANDSCAPE
- 4.1 Market Overview
- 4.2 Market Drivers
- 4.2.1 Explosive Theme-Park CAPEX Pipelines
- 4.2.2 Post-COVID "Experience over Things" Consumer Shift
- 4.2.3 Fast-Maturing Location-Based VR Business Models
- 4.2.4 5G and Edge Enabling Real-Time Multi-User AR Overlays
- 4.2.5 Experiential Real-Estate REITs Unlocking New Capital Pools
- 4.2.6 AI-Driven Dynamic Ticket Pricing Boosting Per-Cap Spend
- 4.3 Market Restraints
- 4.3.1 Rising Insurance and Safety-Compliance Costs
- 4.3.2 Content-Licensing Fatigue among IP Right-Holders
- 4.3.3 High Staff Turnover in Live Interactive Attractions
- 4.3.4 Local-Community Backlash over "Immersive Fatigue"
- 4.4 Value Chain Analysis
- 4.5 Regulatory Landscape
- 4.6 Impact of Macroeconomic Factors on the Market
- 4.7 Porter's Five Forces Analysis
- 4.7.1 Bargaining Power of Suppliers
- 4.7.2 Bargaining Power of Buyers
- 4.7.3 Threat of New Entrants
- 4.7.4 Threat of Substitutes
- 4.7.5 Competitive Rivalry
5 MARKET SIZE and GROWTH FORECASTS (VALUE)
- 5.1 By Application
- 5.1.1 Themed Entertainment
- 5.1.2 Haunted Attractions and Escape Rooms
- 5.1.3 Immersive Theatres
- 5.1.4 Experiential Art Museums
- 5.1.5 Exhibitions and Retail Installations
- 5.1.6 Live Immersive Gaming Events
- 5.2 By Technology
- 5.2.1 Virtual Reality (VR)
- 5.2.2 Augmented Reality (AR)
- 5.2.3 3D Audio and Spatial Sound
- 5.2.4 Mixed Reality (MR)
- 5.2.5 Haptics and Multisensory Tech
- 5.3 By Venue Type
- 5.3.1 Theme and Amusement Parks
- 5.3.2 Family/Indoor Entertainment Centers
- 5.3.3 Museums and Galleries
- 5.3.4 Stand-Alone Immersive Venues
- 5.3.5 Pop-Up and Temporary Installations
- 5.4 By Revenue Stream
- 5.4.1 Ticket Sales
- 5.4.2 Food and Beverage
- 5.4.3 Merchandise
- 5.4.4 Sponsorship and Brand Partnerships
- 5.4.5 IP Licensing and Royalties
- 5.4.6 Subscription and Memberships
- 5.5 By Geography
- 5.5.1 North America
- 5.5.1.1 United States
- 5.5.1.2 Canada
- 5.5.1.3 Mexico
- 5.5.2 South America
- 5.5.2.1 Brazil
- 5.5.2.2 Argentina
- 5.5.2.3 Rest of South America
- 5.5.3 Europe
- 5.5.3.1 Germany
- 5.5.3.2 United Kingdom
- 5.5.3.3 France
- 5.5.3.4 Italy
- 5.5.3.5 Spain
- 5.5.3.6 Rest of Europe
- 5.5.4 Asia-Pacific
- 5.5.4.1 China
- 5.5.4.2 Japan
- 5.5.4.3 India
- 5.5.4.4 South Korea
- 5.5.4.5 ASEAN
- 5.5.4.6 Rest of Asia-Pacific
- 5.5.5 Middle East
- 5.5.5.1 Saudi Arabia
- 5.5.5.2 United Arab Emirates
- 5.5.5.3 Rest of Middle East
- 5.5.6 Africa
- 5.5.6.1 South Africa
- 5.5.6.2 Nigeria
- 5.5.6.3 Egypt
- 5.5.6.4 Rest of Africa
- 5.5.1 North America
6 COMPETITIVE LANDSCAPE
- 6.1 Market Concentration
- 6.2 Strategic Moves
- 6.3 Market Share Analysis
- 6.4 Company Profiles (includes Global Level Overview, Market Level Overview, Core Segments, Financials as available, Strategic Information, Market Rank/Share, Products and Services, Recent Developments)
- 6.4.1 teamLab Inc.
- 6.4.2 Meow Wolf, LLC
- 6.4.3 Secret Cinema Limited
- 6.4.4 Culturespaces SAS
- 6.4.5 Museum of Ice Cream, Inc.
- 6.4.6 Grande Experiences Pty Ltd.
- 6.4.7 The Walt Disney Company
- 6.4.8 Universal Parks and Resorts (Comcast Corp.)
- 6.4.9 Six Flags Entertainment Corp.
- 6.4.10 Cedar Fair Entertainment Company
- 6.4.11 Merlin Entertainments Limited
- 6.4.12 SeaWorld Entertainment, Inc.
- 6.4.13 Parques Reunidos Servicios Centrales S.A.
- 6.4.14 Moment Factory Inc.
- 6.4.15 Punchdrunk Global Limited
- 6.4.16 Illuminarium Experiences LLC
- 6.4.17 Superblue Miami LLC
- 6.4.18 Sandbox VR, Inc.
- 6.4.19 Holovis International Limited
- 6.4.20 Framestore Limited
- 6.4.21 Felix and Paul Studios Inc.
- 6.4.22 Darkfield Radio Limited
- 6.4.23 The VOID, LLC
- 6.4.24 Coastiality (Mack International GmbH)
- 6.4.25 Dave and Buster's Entertainment, Inc.
- 6.4.26 Framestore Ltd.
7 MARKET OPPORTUNITIES and FUTURE OUTLOOK
- 7.1 White-Space and Unmet-Need Assessment

 全球身臨其境型娛樂市場規模、佔有率、趨勢和成長分析報告(2026-2034)
 身臨其境型娛樂市場分析及預測(至2035年):依類型、產品類型、服務、技術、組件、應用、設備、最終用戶、解決方案、模式
 身臨其境型娛樂市場規模、佔有率和趨勢分析報告:按技術類型、應用、地區和細分市場預測(2026-2033 年)美國身臨其境型娛樂市場規模、佔有率和趨勢分析報告:按技術類型、應用和細分市場預測(2025-2033 年)
 身臨其境型娛樂的全球市場
 亞太地區沉浸式娛樂市場預測至 2031 年 - 區域分析 - 按組件、技術(虛擬實境、擴增實境、混合實境等)和最終用戶
 北美沉浸式娛樂市場預測至 2031 年 - 區域分析 - 按組件、技術(虛擬實境、擴增實境、混合實境等)和最終用戶
 歐洲沉浸式娛樂市場預測至 2031 年 - 區域分析 - 按組件、技術(虛擬實境、擴增實境、混合實境等)和最終用戶