


 |
市場調查報告書
商品編碼
2043957
中東資料中心固態硬碟:市場佔有率分析、產業趨勢與統計及成長預測(2026-2031 年)Middle East Data Center SSD - Market Share Analysis, Industry Trends & Statistics, Growth Forecasts (2026 - 2031) |
||||||
※ 本網頁內容可能與最新版本有所差異。詳細情況請與我們聯繫。
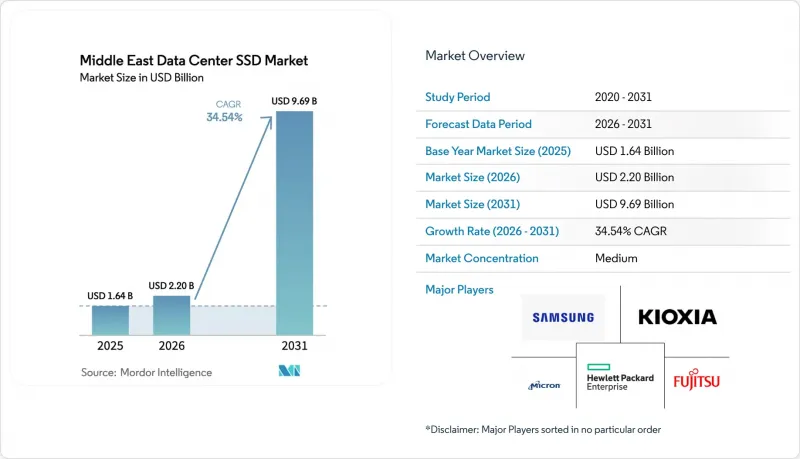
預計中東資料中心固態硬碟市場規模將從 2025 年的 16.4 億美元和 2026 年的 22 億美元成長到 2031 年的 96.9 億美元,2026 年至 2031 年的年複合成長率(CAGR)為 34.54%。
海灣合作理事會成員國政府的積極投資正將石油收入轉向超大規模資料中心園區,這些園區需要低延遲的全快閃儲存來支援人工智慧、邊緣分析和高效能運算。波灣合作理事會、阿拉伯聯合大公國和卡達的國家資料保護條例強制要求個人資料必須儲存在國內,這刺激了新建設而非維修現有設施。在該地區,土地和電力成本高昂,環境溫度也較高,營運商正在標準化NVMe(非揮發性記憶體高速介面)介面和先進的外形規格,以最大限度地提高機架密度。 NAND快閃記憶體層數的增加使得每GB的成本越來越接近關鍵任務型硬碟驅動器,這為中東資料中心固態硬碟市場帶來了成本優勢,再加上有利的政策和工作負載,進一步推動了市場成長。
中東資料中心固態硬碟市場趨勢與洞察
海灣合作理事會地區超大規模資料中心中人工智慧和高效能運算工作負載的加速發展正在推動 NVMe 的普及。
政府支持的資金正湧入超大規模資料中心,用於運行大規模語言模型訓練和高精度模擬——這些工作負載無法容忍磁碟延遲。微軟和G42正在投資152億美元,為阿拉伯聯合大公國新增200兆瓦的儲存容量;此外,美阿聯合舉措的目標是建置5吉瓦的人工智慧(AI)基礎設施,這兩個專案都以NVMe(非揮發性記憶體高速介面)驅動器為核心,其讀取延遲低於100微秒。Oracle於2025年進入該地區,部署了一個GPU密集型叢集,透過PCIe Gen5控制器提供14 GB/s的資料傳輸速度,向營運商展示了全快閃主幹網路的實際優勢。沙烏地阿拉伯公共投資基金已撥款超過210億美元用於諸如480兆瓦的Hexagon資料中心等項目,將NVMe陣列定位為該國人工智慧模型的預設儲存層。隨著運算密度的增加,能夠最大限度地減少 I/O 瓶頸並簡化橫向擴展的 SSD 在資料中心變得越來越受歡迎,從而為中東資料中心 SSD 市場創造了強勁的結構性動力。
沙烏地阿拉伯2030願景和阿拉伯聯合大公國數位政府專案基金新建全快閃設施
利雅德的「國家資料中心戰略」目標是到2030年實現1.5吉瓦的資料中心容量,並強制要求公共運作。這項法規實際上規定了從第一個機架開始就必須使用快閃記憶體媒體。阿布達比已投資130億迪拉姆(約35億美元)建造了一個19兆瓦的政府資料中心,透過遷移到NVMe陣列,降低了40%的電力消耗。阿拉伯聯合大公國中央銀行正與Core42合作建構主權金融雲,這增加了另一層無法跨國運作的工作負荷。因此,這些工作負載必須駐留在本地的高效能硬碟上。 DataVolt和Neom已達成協議,將建造一個價值50億美元、可擴展至1吉瓦的超大規模資料中心園區。園區採用E1.S型磁條硬碟實現高密度存儲,並利用新增的土地和運作資源,證明快閃記憶體儲存可以從一開始就取代旋轉式硬碟。
NAND快閃記憶體價格波動對廠商的利潤率帶來了壓力。
2025年至2026年間,記憶體晶片價格加倍。這是由於供應商將晶圓轉向汽車和行動裝置生產線,導致企業級固態硬碟(SSD)的合約價格上漲超過50%。三星逐季漲價,而創見(Transcend)則公開承認NAND快閃記憶體出貨延遲,並被迫停產。對於群聯電子(Phison)等專業控制器製造商而言,訂單率跌破30%,前置作業時間延長至30週,使在現貨市場採購的中東營運商面臨極端的成本波動。持續的價格波動進一步擠壓了區域系統整合商本已微薄的利潤空間,並可能導致訂單成長放緩,儘管業務量不斷增加。
細分市場分析
到2025年,2.5吋U.2和U.3硬碟位將佔據中東資料中心SSD市場佔有率的58.13%,這反映了其與傳統熱插拔托架的兼容性。預計在預測期內,EDSFF(擴展型固態硬碟)的市佔率將以35.14%的複合年成長率成長。然而,不斷上漲的機架空間成本和氣流限制正促使營運商探索部署採用E1.S、E1.L和E3設計的高容量資料中心SSD,這些設計使每個框架單位的硬碟數量翻倍。該地區領先的超大規模資料中心業者正在將試點叢集遷移到E1.S線程,從而將每Terabyte的功耗降低三分之一以上。提高散熱效率同樣重要,因為更高密度的快閃記憶體陣列使資料中心能夠降低風扇轉速,即使在沙漠氣候下也能保持節熱器冷卻。這些成本節約,加上目前基於負載的電價收費系統,顯示更薄的硬碟將成為應對未來電力系統改革的有效手段。
到2026年,隨著控制器藍圖率先向EDSFF(擴展型固態硬碟)靠攏,這一轉變將加速,導致傳統的2.5吋外形規格在性能上落後。西部數據的Ultrastar DC SN861 (E1.S)即使在45°C的環境下也能保持13.5 GB/s的寫入速度,這項規格非常適合沿岸地區的氣候。鎧俠的CD8-V (E3.S)單模組容量高達30.72 TB,在沙烏地阿拉伯Hexagon園區,每個42U機櫃即可實現1.5 PB的儲存容量,而無需特殊的冷卻系統。因此,預計中東資料中心的EDSFF市場將顯著成長,而U.2的需求正從擴展週期轉向替換週期。由於新的硬碟規格已被列入採購文件的最低要求,沒有EDSFF產品線的供應商將面臨被市場淘汰的風險。
預計到2025年,PCIe將佔據70.21%的市場佔有率,並隨著第五代PCIe闆卡達到14GB/s的傳輸速度,以及人工智慧叢集GPU流水線的飽和,其市場佔有率將繼續以35.74%的複合年成長率成長。 SATA在注重成本的邊緣閘道領域仍佔有一席之地,但其6Gb/s的傳輸速度不足以滿足即時推理的需求。由於雙埠冗餘現在透過網路架構而非控制器對來實現,SAS的市場佔有率已下降至個位數。因此,中東資料中心基於PCIe的固態硬碟市場不僅因出貨量增加而擴張,也因平均售價上漲而擴大。這是因為增加通道數和提高控制器速度能夠帶來更高的利潤率。
根據PCI-SIG 6.0規範,第六代(Gen6)晶片的吞吐量已確認達到128 GT/s,將於2026年下半年交付給超大規模資料超大規模資料中心業者,其吞吐量將是第五代(Gen5)的兩倍,並為下一代GPU預留了充足的空間。阿拉伯聯合大公國一個由微軟和G42支援的專案以第五代(Gen5)晶片為基礎,同時要求相容第六代(Gen6)晶片,這表明該地區的買家正在跳過某些升級階段。向下相容性將允許營運商分階段升級,而無需大規模更換設備(即「堆高機式」更換),從而簡化部署流程。受此趨勢影響,中東資料中心的固態硬碟(SSD)市場將繼續由PCIe主導,而SATA將轉向邊緣運算,用於資料歸檔。
由於TLC在價格和寫入壽命方面兼顧優勢,預計到2025年,TLC將以36.72%的市佔率領先。但QLC憑藉其高出50%的面密度,預計在預測期內將以35.46%的複合年成長率成長。隨著層數超過280層的QLC固態硬碟有望實現每天一次、持續五年的寫入操作,為主導超大規模雲端的物件儲存和分析湖提供足夠的效能。成本差距的縮小正促使營運商用快閃存取代冷硬碟層,而這項轉變將有利於中東資料中心固態硬碟市場的發展,因為該市場在面積和冷卻能力方面存在諸多限制。
美光的232層QLC和Solidigum的61.44TB型號均表明,4位元單元可以實現7GB/s的連續式寫入速度,同時保持較低的每Terabyte功耗。西部資料的動態寫入加速技術透過增量寫入SLC緩衝區進一步提升了耐用性,消除了QLC廣泛應用的最後一個顧慮。這些發展可望在本世紀末重塑中東資料中心固態硬碟市場中TLC和QLC的市佔率格局。
其他好處:
- Excel格式的市場預測(ME)表
- 3個月的分析師支持
目錄
第1章:引言
- 研究假設和市場定義
- 調查範圍
第2章:調查方法
第3章執行摘要
第4章 市場狀況
- 市場概覽
- 市場促進因素
- 海灣合作理事會地區超大規模資料中心中人工智慧和高效能運算工作負載的加速發展正在推動 NVMe 的普及。
- 沙烏地阿拉伯2030願景和阿拉伯聯合大公國數位政府計畫為建立一個全新的全快閃網站提供了資金支持。
- 3D-NAND 的每 GB 價格已經下降,與關鍵任務型 HDD 的價格持平。
- 石油和天然氣田邊緣運算和 5G 微型資料中心的部署,催生了對功能強大、低功耗 SSD 的需求。
- 區域資料主權法規(沙烏地阿拉伯的 PDPL、阿拉伯聯合大公國的 DIFC、卡達的 PDP)正在促進這些地區內全快閃系統的發展。
- 以色列半導體生態系統主導的早期CXL和運算儲存先導計畫
- 市場限制因素
- NAND快閃記憶體價格的波動週期給廠商的利潤率帶來了壓力。
- 控制器晶片持續供應緊張,導致企業級固態硬碟的前置作業時間延長。
- 電費改革的不斷深入推高了區域電力供應商的總擁有成本(TCO)。
- 地緣政治緊張局勢和跨境貿易限制正在加劇供應鏈風險。
- 產業價值鏈分析
- 監理情勢
- 技術展望
- 宏觀經濟因素對市場的影響
- 波特五力分析
- 買方的議價能力
- 供應商的議價能力
- 新進入者的威脅
- 替代品的威脅
- 競爭公司之間的競爭
第5章 市場規模與成長預測
- 按外形規格
- 2.5吋(U.2/U.3)
- M.2
- PCIe擴充卡
- EDSFF(E1.S/E1.L/E3)
- 透過介面
- SATA
- SAS
- PCIe
- PCIe/NVMe Gen3
- PCIe/NVMe Gen4
- PCIe/NVMe Gen5
- PCIe/NVMe Gen6
- 透過NAND技術
- SLC
- MLC
- TLC
- QLC
- 按容量範圍
- ≤ 1 TB
- 1-2 TB
- 2~4 TB
- 4TB 或以上
- 層級類型
- 一級和二級
- 三級
- 第四級
- 按資料中心規模
- 小規模資料中心
- 中型資料中心
- 大型資料中心
- 超大規模資料中心
- 依資料中心類型
- 託管資料中心
- 超大規模資料中心業者資料中心/雲端服務供應商
- 企業和邊緣資料中心
- 國家
- 沙烏地阿拉伯
- 阿拉伯聯合大公國
- 土耳其
- 其他中東國家
第6章 競爭情勢
- 市佔率分析
- 公司簡介
- Samsung Electronics Co., Ltd.
- Kioxia Corporation
- Western Digital Corporation
- Solidigm(SK hynix Inc.)
- Micron Technology, Inc.
- Seagate Technology Holdings plc
- Kingston Technology Corp.
- Phison Electronics Corp.
- Silicon Motion Technology Corp.
- Marvell Technology, Inc.
- Huawei Technologies Co., Ltd.(FusionSSD)
- Inspur Electronic Information Industry Co., Ltd.
- Lenovo Group Limited(ThinkSystem SSD)
- Hewlett Packard Enterprise Co.
- Lightbits Labs Ltd.
- GRAID Technology Inc.
- Nimbus Data, Inc.
- Pure Storage, Inc.
- Fujitsu Limited
- Dell Technologies Inc.(Dell EMC Enterprise SSDs)
第7章 市場機會與未來展望
The Middle East data center SSD market size is projected to expand from USD 1.64 billion in 2025 and USD 2.20 billion in 2026 to USD 9.69 billion by 2031, registering a CAGR of 34.54% between 2026 to 2031.
Fierce investment by Gulf Cooperation Council governments is transferring sovereign oil revenue into hyperscale campuses that demand low-latency, all-flash storage for artificial intelligence, edge analytics, and high-performance computing. Sovereign data-protection rules in Saudi Arabia, the United Arab Emirates, and Qatar force in-country retention of personal information, encouraging greenfield builds instead of retrofits. Operators are standardizing on non-volatile memory express interfaces and advanced form factors to maximize rack density in a region where land and power are expensive and ambient temperatures are high. Intensifying NAND layer counts are pushing cost per gigabyte toward parity with mission-critical hard disk drives, giving the Middle East data center SSD market a cost tailwind alongside the policy and workload catalysts.
Middle East Data Center SSD Market Trends and Insights
Accelerating AI and HPC Workloads In GCC Hyperscale Data Centers Driving NVMe Adoption
Government-backed capital is flowing into hyperscale campuses that train large language models and run high-fidelity simulations, workloads that are intolerant of disk latency. Microsoft and G42 committed USD 15.2 billion to add 200 MW of capacity in the United Arab Emirates, and the United States-UAE initiative targets a 5 GW artificial-intelligence estate, both architected around non-volatile memory express drives delivering sub-100-microsecond read latency. Oracle entered the region in 2025 with a GPU-rich cluster that streams data at 14 GB/s through PCIe Gen5 controllers, showing operators the practical advantage of an all-flash spine. Saudi Arabia's Public Investment Fund allocated more than USD 21 billion to projects such as the 480 MW Hexagon facility, positioning NVMe arrays as the default storage layer for sovereign AI models. As compute density climbs, campuses prefer SSDs that minimize I/O bottlenecks and simplify horizontal scaling, giving the Middle East data center SSD market strong structural momentum.
Saudi Vision 2030 and UAE Digital-Government Projects Funding Greenfield All-Flash Sites
Riyadh's National Data Center Strategy targets 1.5 GW by 2030 and requires public workloads to run in domestic facilities certified to stringent security standards, a decree that effectively locks in flash media from the first rack. Abu Dhabi spent AED 13 billion (USD 3.5 billion) on a 19 MW government data centre that cut power draw by 40% after migrating to NVMe arrays. The UAE Central Bank is building a sovereign financial cloud with Core42, adding another workload that cannot leave national borders and therefore must sit on local, high-performance drives. DataVolt and Neom agreed to a USD 5 billion hyperscale campus that scales to 1 GW and uses ruler-style E1.S drives for density, proving that fresh land and power allocations allow flash to displace spinning media from day one.
NAND Price-Volatility Cycles Compressing Vendor Margins
Memory-chip prices doubling across 2025-2026 as suppliers diverted wafers to automotive and mobile lines, lifting enterprise-SSD contract prices by more than 50%. Samsung raised quotes quarter over quarter, while Transcend publicly acknowledged a lapse in NAND deliveries that forced a production halt. Controller specialists such as Phison recorded fill rates below 30%, stretching lead times to 30 weeks and exposing Middle East operators that buy on the spot market to severe cost swings. Prolonged volatility pressures already thin margins for regional system integrators and may slow purchase orders even as workloads climb.
Other drivers and restraints analyzed in the detailed report include:
- Declining USD/GB ff 3D NAND Reaching Price Parity with Mission-Critical HDDs
- Edge and 5G Micro-Data-Center Rollouts In Oil and Gas Fields Demanding Rugged, Low-Power SSDs
- Persistent Controller-IC Supply Constraints Extending Enterprise SSD Lead Times
For complete list of drivers and restraints, kindly check the Table Of Contents.
Segment Analysis
The 2.5-inch U.2 and U.3 bays delivered 58.13% of the Middle East data center SSD market share in 2025, reflecting their compatibility with legacy hot-swap trays. EDSFF variants is expected to expand at a 35.14% CAGR during the forecast period. Rising rack-space premiums and airflow constraints, however, are prompting operators to pursue the elongated data center SSD capacities enabled by E1.S, E1.L, and E3 designs that double drive count per rack unit. Leading hyperscalers in the region have moved pilot clusters to E1.S sleds that cut power draw per terabyte by more than one-third. Thermal gains are equally important, because denser flash arrays let facilities throttle fan speeds and sustain economizer cooling in desert climates. These savings resonate with utility tariffs that now index costs to load factor, making slimmer drives a hedge against future electricity reforms.
The transition accelerates in 2026 as controller roadmaps converge on EDSFF first, leaving legacy 2.5-inch form factors a step behind the performance curve. Western Digital's Ultrastar DC SN861 in E1.S sustains 13.5 GB/s writes while operating at 45 °C air, a specification aligned with Gulf climatics. Kioxia's CD8-V in E3.S adds 30.72 TB in a single stick, letting Saudi Arabia's Hexagon campus fit 1.5 PB per 42U cabinet without exotic cooling. As a result, the Middle East data center SSD market size for EDSFF units is positioned for outsized growth, while U.2 demand tapers toward refresh rather than expansion cycles. Vendors that lack an EDSFF line risk displacement as procurement documents embed the new form factor as a minimum requirement.
PCIe captured 70.21% of the market share in 2025 and will continue compounding at a 35.74% CAGR as Gen5 boards reach 14 GB/s, saturating GPU pipelines in AI clusters. SATA maintains a niche in cost-sensitive edge gateways, yet its 6 Gb/s ceiling cannot service real-time inference. SAS fell to a mid-single-digit slice as dual-port redundancy now arrives via network fabrics rather than controller pairs. The Middle East data center SSD market size tied to PCIe therefore rises not only on unit growth but also on average selling price, because higher lane counts and faster controllers carry better margins.
Gen6 silicon finalised at 128 GT/s in the PCI-SIG 6.0 spec ships to hyperscalers in late 2026, doubling Gen5 throughput and ensuring ample headroom for next-generation GPUs. UAE projects backed by Microsoft-G42 have written Gen5 as baseline and request Gen6 readiness, illustrating how buyers in the region leapfrog incremental steps. Backward compatibility lets operators stage upgrades without forklift swaps, smoothing deployment Cadence. This dynamic keeps the Middle East data center SSD market firmly oriented around PCIe, while SATA fades into archival edges.
TLC led the market at 36.72% in 2025 thanks to its balance of price and write endurance, though QLC is set to climb at a 35.46% CAGR during the forecast period by offering 50% higher areal density. Rising layer counts above 280 let QLC drives promise 1 drive write per day over 5 years, adequate for object storage and analytics lakes that dominate hyperscale clouds. The shrinking cost delta invites operators to replace cold HDD tiers with flash, a shift that benefits the Middle East data center SSD market, where floor space and cooling caps are binding.
Micron's 232-layer QLC and Solidigm's 61.44 TB ruler both demonstrate that four-bit cells can deliver 7 GB/s sequential writes while holding down watts per terabyte. Western Digital's dynamic write acceleration further stretches durability by staging writes in SLC buffers, removing the last argument against deep QLC adoption. Together, these moves will rebalance the Middle East data center SSD market share between TLC and QLC by the decade's close.
The Middle East Data Center SSD Market Report is Segmented by Form Factor (2. 5-Inch, M. 2, and More), Interface (SATA, SAS, and PCIe), NAND Technology (SLC, MLC, TLC, and QLC), Capacity Range (<=1 TB, and More), Tier Type (Tier 1 and 2, Tier 3, and Tier 4), Data Center Size (Small, Medium, Large, and Hyperscale), Data Center Type (Colocation, and More), and Country. The Market Forecasts are Provided in Terms of Value (USD).
List of Companies Covered in this Report:
- Samsung Electronics Co., Ltd.
- Kioxia Corporation
- Western Digital Corporation
- Solidigm (SK hynix Inc.)
- Micron Technology, Inc.
- Seagate Technology Holdings plc
- Kingston Technology Corp.
- Phison Electronics Corp.
- Silicon Motion Technology Corp.
- Marvell Technology, Inc.
- Huawei Technologies Co., Ltd. (FusionSSD)
- Inspur Electronic Information Industry Co., Ltd.
- Lenovo Group Limited (ThinkSystem SSD)
- Hewlett Packard Enterprise Co.
- Lightbits Labs Ltd.
- GRAID Technology Inc.
- Nimbus Data, Inc.
- Pure Storage, Inc.
- Fujitsu Limited
- Dell Technologies Inc. (Dell EMC Enterprise SSDs)
Additional Benefits:
- The market estimate (ME) sheet in Excel format
- 3 months of analyst support
TABLE OF CONTENTS
1 INTRODUCTION
- 1.1 Study Assumptions and Market Definition
- 1.2 Scope of the Study
2 RESEARCH METHODOLOGY
3 EXECUTIVE SUMMARY
4 MARKET LANDSCAPE
- 4.1 Market Overview
- 4.2 Market Drivers
- 4.2.1 Accelerating AI and HPC Workloads in GCC Hyperscale Data Centers Driving NVMe Adoption
- 4.2.2 Saudi Vision 2030 and UAE Digital-Government Projects Funding Greenfield All-Flash Sites
- 4.2.3 Declining USD/GB of 3D-NAND Reaching Price-Parity With Mission-Critical HDDs
- 4.2.4 Edge and 5G Micro-Data-Center Roll-Outs in Oil and Gas Fields Demanding Rugged, Low-Power SSDs
- 4.2.5 Regional Data-Sovereignty Mandates (Saudi PDPL, UAE DIFC, Qatar PDP) Spurring In-Country All-Flash Builds
- 4.2.6 Early CXL and Computational-Storage Pilots Led by Israel's Semiconductor Ecosystem
- 4.3 Market Restraints
- 4.3.1 NAND Price-Volatility Cycles Compressing Vendor Margins
- 4.3.2 Persistent Controller-IC Supply Constraints Extending Enterprise-SSD Lead-Times
- 4.3.3 Escalating Electricity-Tariff Reforms Raising TCO for Regional Operators
- 4.3.4 Geopolitical Tensions and Cross-Border Trade Restrictions Heightening Supply-Chain Risk
- 4.4 Industry Value Chain Analysis
- 4.5 Regulatory Landscape
- 4.6 Technological Outlook
- 4.7 Impact of Macroeconomic Factors on the Market
- 4.8 Porter's Five Forces Analysis
- 4.8.1 Bargaining Power of Buyers
- 4.8.2 Bargaining Power of Suppliers
- 4.8.3 Threat of New Entrants
- 4.8.4 Threat of Substitutes
- 4.8.5 Intensity of Competitive Rivalry
5 MARKET SIZE AND GROWTH FORECASTS (VALUE)
- 5.1 By Form Factor
- 5.1.1 2.5-inch (U.2/U.3)
- 5.1.2 M.2
- 5.1.3 PCIe Add-In Card
- 5.1.4 EDSFF (E1.S/E1.L/E3)
- 5.2 By Interface
- 5.2.1 SATA
- 5.2.2 SAS
- 5.2.3 PCIe
- 5.2.3.1 PCIe/NVMe Gen3
- 5.2.3.2 PCIe/NVMe Gen4
- 5.2.3.3 PCIe/NVMe Gen5
- 5.2.3.4 PCIe/NVMe Gen6
- 5.3 By NAND Technology
- 5.3.1 SLC
- 5.3.2 MLC
- 5.3.3 TLC
- 5.3.4 QLC
- 5.4 By Capacity Range
- 5.4.1 <=1 TB
- 5.4.2 1-2 TB
- 5.4.3 2-4 TB
- 5.4.4 >=4 TB
- 5.5 By Tier Type
- 5.5.1 Tier 1 and 2
- 5.5.2 Tier 3
- 5.5.3 Tier 4
- 5.6 By Data Center Size
- 5.6.1 Small Data Center
- 5.6.2 Medium Data Center
- 5.6.3 Large Data Center
- 5.6.4 Hyperscale Data Center
- 5.7 By Data Center Type
- 5.7.1 Colocation Data Center
- 5.7.2 Hyperscalers Data Center/CSPs
- 5.7.3 Enterprise and Edge Data Center
- 5.8 By Country
- 5.8.1 Saudi Arabia
- 5.8.2 United Arab Emirates
- 5.8.3 Turkey
- 5.8.4 Rest of Middle East
6 COMPETITIVE LANDSCAPE
- 6.1 Market Share Analysis
- 6.2 Company Profiles (Includes Global Level Overview, Market Level Overview, Core Segments, Financials as Available, Strategic Information, Market Rank/Share, Products and Services, and Recent Developments)
- 6.2.1 Samsung Electronics Co., Ltd.
- 6.2.2 Kioxia Corporation
- 6.2.3 Western Digital Corporation
- 6.2.4 Solidigm (SK hynix Inc.)
- 6.2.5 Micron Technology, Inc.
- 6.2.6 Seagate Technology Holdings plc
- 6.2.7 Kingston Technology Corp.
- 6.2.8 Phison Electronics Corp.
- 6.2.9 Silicon Motion Technology Corp.
- 6.2.10 Marvell Technology, Inc.
- 6.2.11 Huawei Technologies Co., Ltd. (FusionSSD)
- 6.2.12 Inspur Electronic Information Industry Co., Ltd.
- 6.2.13 Lenovo Group Limited (ThinkSystem SSD)
- 6.2.14 Hewlett Packard Enterprise Co.
- 6.2.15 Lightbits Labs Ltd.
- 6.2.16 GRAID Technology Inc.
- 6.2.17 Nimbus Data, Inc.
- 6.2.18 Pure Storage, Inc.
- 6.2.19 Fujitsu Limited
- 6.2.20 Dell Technologies Inc. (Dell EMC Enterprise SSDs)
7 MARKET OPPORTUNITIES AND FUTURE OUTLOOK
- 7.1 White-Space and Unmet-Need Assessment
 2026年全球儲存架構市場報告
 全球資料中心儲存市場(至2032年):依儲存媒體(SSD/HDD)、介面(SATA/SAS/NVMe)、最終用戶(超大規模/雲端服務供應商、企業、政府及公部門)、外形規格(3.5吋/2.5吋/M.2)及容量分類
 資料中心固態硬碟市場規模、佔有率和趨勢分析報告:按外形規格、介面、NAND 技術、儲存容量、最終用戶、地區和細分市場預測(2026-2033 年)
 資料中心儲存市場:2026-2032年全球市場預測(按儲存類型、架構、部署、應用程式和最終用戶分類)磁碟陣列機箱市場按類型、介面類型、散熱類型、部署模式、最終用戶和應用分類 - 全球預測,2026-2032 年
 2025-2029年全球資料中心儲存市場
 2025-2029年全球伺服器與儲存市場
 資料中心儲存市場機會、成長動力、產業趨勢分析及 2025-2034 年預測
 全球資料中心與儲存市場
 日本資料中心儲存:市場佔有率分析、產業趨勢與成長預測(2024-2029)