


 |
市場調查報告書
商品編碼
2043954
硝酸銨鈣:市場佔有率分析、產業趨勢與統計、成長預測(2025-2030 年)Calcium Ammonium Nitrate - Market Share Analysis, Industry Trends & Statistics, Growth Forecasts (2025 - 2030) |
||||||
※ 本網頁內容可能與最新版本有所差異。詳細情況請與我們聯繫。
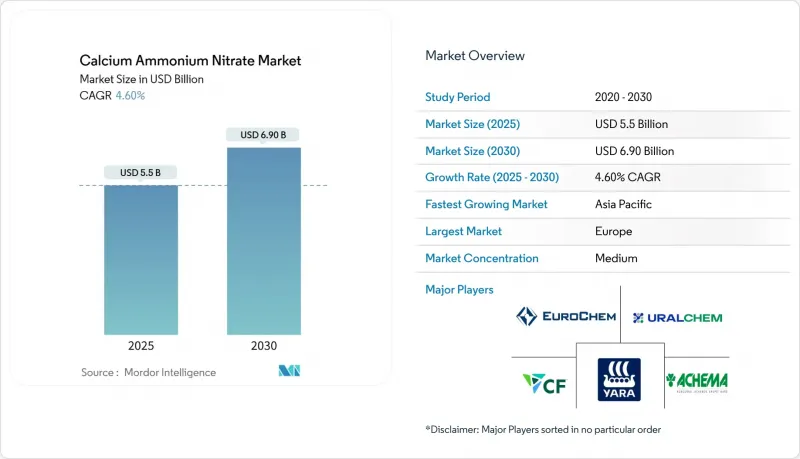
目前硝酸銨鈣市值為55億美元,預計2030年將達到69億美元。
這相當於年複合成長率為 4.6%。
市場擴張主要受歐洲脫碳政策、亞太地區溫室種植面積擴大以及精準施肥技術的推廣應用所驅動,這些因素共同推高了對低碳硝酸鹽產品的需求。歐洲天然氣價格上漲促使生產商投資低碳氨生產流程,而即將實施的碳邊境調節機制(CBAM)將對高碳進口產品施加成本壓力,並加劇國內產品的競爭。亞太地區引領區域成長,主要得益於施肥和灌溉技術的快速普及。歐洲仍然是最大的區域市場,這得益於嚴格的硝酸鹽法規,該法規建議使用無氯肥料。隨著生產商採用灌溉和精準施肥系統,液體配方產品呈現強勁成長動能。同時,由於提倡高效施用量和物流成本上升,再生農業的發展趨勢和運輸安全法規正在抑制整體銷售成長。
全球硝酸銨鈣市場趨勢及洞察
歐洲硝酸鹽使用法規支持低碳肥料的趨勢
2022年生效的歐盟第2019/1009號條例加強了對成分和碳足跡的監管,為受監管的硝酸銨鈣設立了高階產品等級,同時限制了高碳替代品的市場准入。生產商正在投資碳捕獲技術,以實現歐盟到2030年每年儲存5,000萬噸二氧化碳的目標。隨著其他地區也逐漸遵守歐盟標準,受監管的化肥正獲得出口優勢。
過渡到高附加價值園藝用無氯氮源。
高階蔬果生產商更傾向於使用硝酸銨鈣,因為不含氯化物,可以防止鹽分對敏感作物造成損害。在中國,溫室棚面積佔全球60%的面積,而硝酸鹽類肥料是維持土壤健康和提高產量的關鍵。田間試驗表明,在常規氮肥中添加硝酸鈣可以提高石榴坐果率並減少落果。
天然氣製氨原料價格波動
天然氣價格波動持續給硝酸銨鈣生產商帶來巨大的利潤壓力,尤其是歐洲生產商極易受到供應中斷和價格上漲的影響。根據美國能源資訊署 (EIA) 的報告顯示,氨的價格在兩年內上漲了六倍,這主要是由於國際天然氣價格波動直接影響了生產的經濟效益。地緣政治緊張局勢影響天然氣供應,進一步加劇了這種波動,導致歐洲生產商面臨持續高企的能源成本,削弱了其與天然氣資源豐富且成本低廉的地區相比的競爭力。由於全球氨市場高度互聯,區域價格衝擊會迅速波及整個供應鏈,造成下游硝酸銨生產成本結構難以預測。為了應對這項挑戰,生產商正在投資碳捕獲技術並採用可再生能源,以減少對波動性石化燃料的依賴,但這些解決方案需要大量的資本投入和較長的實施週期。
細分市場分析
2024年,顆粒肥料佔總銷售額的60%,主要得益於大規模農地耕作中成熟的施肥方式。根據OCI預測,由於市場需求強勁,2024年硝酸銨鈣的平均價格將達到每噸294美元。目前,液態肥料市場正以6.6%的複合年成長率成長,這主要得益於溫室種植者為追求快速供肥和均勻施肥而採用的肥料灌溉技術。生產商強調,液態肥料與自動注肥泵具有高度相容性,這不僅減少了人工成本,還提高了施肥精度。隨著精密農業在中型農場的普及,預計到2030年,液態硝酸銨鈣的市場規模將快速成長。在微灌技術尚未普及的地區,顆粒肥料仍將繼續使用,從而支持兩種肥料形式的均衡成長。
採用液態肥料標誌著整個農業產業正向數據驅動型農業發生重大轉變。現代感測工具能夠即時監測養分需求,並定時注入液態肥料以防止徑流。這種整合方式能夠在保持產量的同時降低每公頃的施肥量,並符合日益嚴格的硝酸鹽排放法規。在需要批量處理和全年釋放的地區,顆粒狀產品仍然至關重要,這進一步豐富了硝酸銨鈣市場,使其涵蓋各種不同的供應技術。
區域分析
2024年,歐洲仍維持39%的市場佔有率,佔據主導地位,這主要得益於嚴格的硝酸鹽和碳排放政策,這些政策推高了對受監管的硝酸銨鈣的需求。 2030年,隨著市場成熟與監管需求達到平衡,歐洲地區的年複合成長率將維持在2.7%的適度水準。德國和法國是最大的買家,兩國農業集約化程度高,且嚴格遵守環境法規。為了在碳邊境調節機制(CBAM)下維持市場進入,生產商正在優先考慮在氨廠中採用碳捕獲和可再生能源技術。該機制計劃於2026年全面實施。
亞太地區正經歷最快成長,複合年成長率達5.7%,這主要得益於中國溫室種植的擴張以及印度對硝酸鹽肥料的補貼政策。中國北方和印度西部缺水地區灌溉施肥技術的快速普及,推動了對全水溶性硝酸鹽肥料的需求。政府鼓勵精密農業和環境控制農業的政策,也使得高純度肥料備受關注,這將支撐其長期銷售成長。
北美市場呈現穩定成長態勢。玉米和大豆輪作維持了基本的消費基準,而《通膨控制法案》中關於永續性的獎勵正推動生產商轉向低碳氨計畫。受加拿大注重4R營養管理原則以及美國更新運輸安全措施的推動,市場需求正轉向緩釋型和碳認證硝酸鹽。總合上升,其中巴西擴大了種植面積,海灣國家則透過大型企劃來保障糧食安全。
其他好處
- Excel格式的市場預測(ME)表
- 3個月的分析師支持
目錄
第1章:引言
- 研究假設和市場定義
- 調查範圍
第2章:調查方法
第3章執行摘要
第4章 市場狀況
- 市場概覽
- 市場促進因素
- 歐洲硝酸鹽使用法規的趨勢傾向於低碳肥料。
- 高附加價值園藝領域向無氯氮源過渡
- 在缺水地區擴大化肥和灌溉的使用
- 政府對緩釋製劑的獎勵
- 亞太地區溫室的快速擴張
- 低氮氧化物肥料排碳權貨幣化的興起
- 市場限制因素
- 天然氣製氨原料價格波動
- 加強硝酸鹽運輸法規
- 大面積作物中尿素與尿素硝酸銨(UAN)溶液的競爭
- 由於再生農業的廣泛應用,對合成材料的使用受到限制。
- 監理情勢
- 技術展望
- 波特五力分析
- 新進入者的威脅
- 供應商的議價能力
- 買方的議價能力
- 替代品的威脅
- 競爭公司之間的競爭
第5章 市場規模與成長預測
- 依實體形態
- 顆粒狀(乾燥)硝酸銨鈣
- 液態(溶液)硝酸銨鈣
- 按作物類型
- 糧食
- 油籽和豆類
- 水果和蔬菜
- 草坪和觀賞植物
- 透過應用方法
- 土壤施用
- 施肥和灌溉
- 葉面噴布
- 按地區
- 北美洲
- 美國
- 加拿大
- 墨西哥
- 北美其他地區
- 南美洲
- 巴西
- 阿根廷
- 南美洲其他地區
- 歐洲
- 德國
- 法國
- 俄羅斯
- 其他歐洲國家
- 亞太地區
- 中國
- 印度
- 日本
- 亞太其他地區
- 中東
- 沙烏地阿拉伯
- 土耳其
- 其他中東國家
- 非洲
- 南非
- 埃及
- 其他非洲地區
- 北美洲
第6章 競爭情勢
- 市場集中度
- 策略趨勢
- 市佔率分析
- 公司簡介
- Yara International ASA
- EuroChem Group AG
- CF Industries Holdings Inc.
- Achema AB
- Uralchem JSC
- OCI
- Fertiberia SA
- Koch Fertilizer LLC(Koch Ag & Energy Solutions, LLC.)
- Grupa Azoty SA
- Acron Group
- Haifa Chemicals Ltd.
- Yunnan Yuntianhua Co. Ltd.
- Fatima Group
- YILDIRIM Group
- JR Simplot Company
第7章 市場機會與未來展望
The calcium ammonium nitrate market size is currently valued at USD 5.5 billion and is projected to reach USD 6.9 billion by 2030, reflecting a 4.6% CAGR.
Market size growth stems from European decarbonization mandates, Asia-Pacific greenhouse expansion, and precision-driven fertilizer use that tilts demand toward lower-carbon nitrate products . Heightened natural gas prices in Europe are pushing producers to invest in low-carbon ammonia pathways, while the forthcoming Carbon Border Adjustment Mechanism will add cost pressure to high-carbon imports, increasing domestic competitiveness . The Asia-Pacific region leads regional growth, driven by the rapid adoption of fertigation. Meanwhile, Europe remains the largest regional market, supported by stringent nitrate regulations that favor chloride-free fertilizers. Liquid formulations are experiencing strong growth as growers adopt fertigation and precision delivery systems. At the same time, regenerative farming trends and transportation safety rules temper overall volume growth by encouraging efficient application rates and increasing logistics costs.
Global Calcium Ammonium Nitrate Market Trends and Insights
Evolving European Nitrate-Use Regulations Favoring Low-Carbon Fertilizers
The 2022 entry into force of Regulation (EU) 2019/1009 tightened composition and footprint rules, creating a premium tier for compliant calcium ammonium nitrate while limiting market access for higher-carbon alternatives . Producers are investing in carbon capture to meet the European Union's goal of storing 50 million metric tons of CO2 annually by 2030, positioning compliant fertilizers for export advantage as other regions align with European Union (EU) standards.
Shift Toward Chloride-Free Nitrogen Sources for High-Value Horticulture
Premium fruit and vegetable growers favor calcium ammonium nitrate because its chloride-free profile prevents salinity stress in sensitive crops. Controlled-environment agriculture in China, which comprises 60% of global greenhouse area, relies on nitrate-based inputs that preserve soil health and boost yield. Field studies show improved fruit set and reduced drop in pomegranate when calcium nitrate supplements standard nitrogen regimes.
Volatility in Natural-Gas-Derived Ammonia Feedstock Prices
Natural gas price volatility continues to create significant margin pressure for calcium ammonium nitrate producers, with European manufacturers particularly exposed to supply disruptions and price spikes. The United States Energy Information Administration reports that ammonia prices increased sixfold over a two-year period, primarily driven by international natural gas price fluctuations that directly impact production economics. This volatility is compounded by geopolitical tensions affecting gas supplies, with European producers facing sustained high energy costs that undermine their competitive position relative to regions with abundant, low-cost natural gas. The interconnected nature of global ammonia markets means that regional price shocks rapidly transmit across supply chains, creating unpredictable cost structures for downstream calcium ammonium nitrate production. Producers are responding by investing in carbon capture technologies and integrating renewable energy to reduce their dependence on volatile fossil fuel inputs, although these solutions require substantial capital investment and longer implementation timelines.
Other drivers and restraints analyzed in the detailed report include:
- Growing Fertigation Adoption in Water-Scarce Regions
- Government Incentives for Controlled-Release Formulations
- Tightening Nitrate Transport Regulations
For complete list of drivers and restraints, kindly check the Table Of Contents.
Segment Analysis
Granular fertilizers retained 60% of 2024 revenue owing to established soil broadcasting practices across broad-acre crops. OCI reported average calcium ammonium nitrate pricing of USD 294 per metric ton as of 2024, as demand remained steady. The liquid segment now grows at a 6.6% CAGR, propelled by fertigation use among greenhouse growers seeking rapid delivery and uniform nutrient distribution. Producers highlight the compatibility of liquids with automated injection pumps, which reduce labor and improve dosing accuracy. The calcium ammonium nitrate market size for liquid solutions is projected to expand rapidly through 2030 as precision agriculture gains traction on mid-scale farms. Granular products continue serving regions lacking micro-irrigation, supporting balanced growth across both forms.
Liquid adoption marks a broader industry shift toward data-driven farming. Modern sensing tools map real-time nutrient demand, allowing timed liquid injections that prevent leaching. This integration can cut per-hectare application volumes while sustaining yield, aligning with tightening nitrate discharge regulations. Granular materials remain vital in areas that favor bulk handling and season-long release, ensuring the calcium ammonium nitrate market continues to diversify across various delivery technologies.
The Calcium Ammonium Nitrate Market is Segmented by Physical Form (Granular (Dry) CAN and Liquid (Solution) CAN), by Crop Type (Cereals and Grains, and More), by Mode of Application (Soil Application, Fertigation, and Foliar), and by Geography (North America, Europe, Asia-Pacific, South America, Africa, and Middle East). The Market Forecasts are Provided in Terms of Value (USD).
Geography Analysis
Europe maintained a dominant 39% share in 2024, propelled by stringent nitrate and carbon policies that elevate compliant calcium ammonium nitrate demand. Regional growth runs at a moderate 2.7% CAGR to 2030 as market maturity balances regulatory pull. Germany and France, characterized by intensive farming and environmental compliance, are the largest national buyers. Producers prioritize carbon capture and renewable power at ammonia plants to preserve market access under the Carbon Border Adjustment Mechanism, set for full enforcement by 2026.
Asia-Pacific is the fastest-growing region at a 5.7% CAGR, driven by greenhouse expansion in China and India's subsidy regime that supports nitrate blends. Rapid fertigation adoption in water-stressed northern China and western India amplifies demand for fully soluble nitrate fertilizers. Government schemes encouraging precision agriculture and controlled-environment farming shift focus toward high-purity inputs, anchoring long-term volume gains.
North America exhibits steady growth. Corn and soybean rotations maintain baseline consumption, while sustainability incentives under the Inflation Reduction Act push producers toward low-carbon ammonia projects. Canada's emphasis on 4R nutrient stewardship and the United States' transport safety updates shape demand toward controlled-release and carbon-verified nitrates. South America, the Middle East, and Africa together account for a rising share as Brazil scales crop area and Gulf nations pursue food security through greenhouse megaprojects.
- Yara International ASA
- EuroChem Group AG
- CF Industries Holdings Inc.
- Achema AB
- Uralchem JSC
- OCI
- Fertiberia S.A.
- Koch Fertilizer LLC (Koch Ag & Energy Solutions, LLC.)
- Grupa Azoty S.A.
- Acron Group
- Haifa Chemicals Ltd.
- Yunnan Yuntianhua Co. Ltd.
- Fatima Group
- YILDIRIM Group
- J.R. Simplot Company
Additional Benefits:
- The market estimate (ME) sheet in Excel format
- 3 months of analyst support
TABLE OF CONTENTS
1 Introduction
- 1.1 Study Assumptions and Market Definition
- 1.2 Scope of the Study
2 Research Methodology
3 Executive Summary
4 Market Landscape
- 4.1 Market Overview
- 4.2 Market Drivers
- 4.2.1 Evolving European nitrate-use regulations favoring low-carbon fertilizers
- 4.2.2 Shift toward chloride-free nitrogen sources for high-value horticulture
- 4.2.3 Growing fertigation adoption in water-scarce regions
- 4.2.4 Government incentives for controlled-release formulations
- 4.2.5 Rapid greenhouse expansion in Asia-Pacific
- 4.2.6 Emergence of carbon-credit monetization for low-N2O fertilizers
- 4.3 Market Restraints
- 4.3.1 Volatility in natural-gas-derived ammonia feedstock prices
- 4.3.2 Tightening nitrate transport regulations
- 4.3.3 Competition from urea and Urea Ammonium Nitrate (UAN) solutions in broad-acre crops
- 4.3.4 Rising adoption of regenerative agriculture limiting synthetic inputs
- 4.4 Regulatory Landscape
- 4.5 Technological Outlook
- 4.6 Porter's Five Forces Analysis
- 4.6.1 Threat of New Entrants
- 4.6.2 Bargaining Power of Suppliers
- 4.6.3 Bargaining Power of Buyers
- 4.6.4 Threat of Substitutes
- 4.6.5 Intensity of Competitive Rivalry
5 Market Size and Growth Forecasts (Value)
- 5.1 By Physical Form
- 5.1.1 Granular (Dry) CAN
- 5.1.2 Liquid (Solution) CAN
- 5.2 By Crop Type
- 5.2.1 Cereals and Grains
- 5.2.2 Oilseeds and Pulses
- 5.2.3 Fruits and Vegetables
- 5.2.4 Turf and Ornamentals
- 5.3 By Mode of Application
- 5.3.1 Soil Application
- 5.3.2 Fertigation
- 5.3.3 Foliar
- 5.4 By Geography
- 5.4.1 North America
- 5.4.1.1 United States
- 5.4.1.2 Canada
- 5.4.1.3 Mexico
- 5.4.1.4 Rest of North America
- 5.4.2 South America
- 5.4.2.1 Brazil
- 5.4.2.2 Argentina
- 5.4.2.3 Rest of South America
- 5.4.3 Europe
- 5.4.3.1 Germany
- 5.4.3.2 France
- 5.4.3.3 Russia
- 5.4.3.4 Rest of Europe
- 5.4.4 Asia-Pacific
- 5.4.4.1 China
- 5.4.4.2 India
- 5.4.4.3 Japan
- 5.4.4.4 Rest of Asia-Pacific
- 5.4.5 Middle East
- 5.4.5.1 Saudi Arabia
- 5.4.5.2 Turkey
- 5.4.5.3 Rest of Middle East
- 5.4.6 Africa
- 5.4.6.1 South Africa
- 5.4.6.2 Egypt
- 5.4.6.3 Rest of Africa
- 5.4.1 North America
6 Competitive Landscape
- 6.1 Market Concentration
- 6.2 Strategic Moves
- 6.3 Market Share Analysis
- 6.4 Company Profiles (Includes Global Level Overview, Market Level Overview, Core Segments, Financials as Available, Strategic Information, Market Rank/Share for Key Companies, Products and Services, and Recent Developments)
- 6.4.1 Yara International ASA
- 6.4.2 EuroChem Group AG
- 6.4.3 CF Industries Holdings Inc.
- 6.4.4 Achema AB
- 6.4.5 Uralchem JSC
- 6.4.6 OCI
- 6.4.7 Fertiberia S.A.
- 6.4.8 Koch Fertilizer LLC (Koch Ag & Energy Solutions, LLC.)
- 6.4.9 Grupa Azoty S.A.
- 6.4.10 Acron Group
- 6.4.11 Haifa Chemicals Ltd.
- 6.4.12 Yunnan Yuntianhua Co. Ltd.
- 6.4.13 Fatima Group
- 6.4.14 YILDIRIM Group
- 6.4.15 J.R. Simplot Company
7 Market Opportunities and Future Outlook
 硝酸鈣市場:依衍生物類型、等級、形態、通路和應用分類-2026-2032年全球市場預測
 2026年全球硝酸鈣市場報告2026年全球硝酸銨鈣市場報告
 硝酸鈣市場規模、佔有率及成長分析(按生產流程、應用和地區分類)-產業預測(2026-2033 年)
 硝酸銨鈣:全球市佔率及排名、總收入及需求預測(2025-2031年)
 硝酸鈣市場-全球產業規模、佔有率、趨勢、機會和預測(按應用、按工藝、按等級、按地區和競爭細分,2020-2030 年)硝酸銨鈣市場-全球產業規模、佔有率、趨勢、機會與預測、按應用(肥料、炸藥等)、按地區和競爭情況細分,2020-2030 年
 硝酸鈣市場 - 2024 年至 2029 年預測