


 |
市場調查報告書
商品編碼
2043879
電動三輪車:市場佔有率分析、產業趨勢與統計、成長預測(2026-2031)Electric Three-Wheeler - Market Share Analysis, Industry Trends & Statistics, Growth Forecasts (2026 - 2031) |
||||||

※ 本網頁內容可能與最新版本有所差異。詳細情況請與我們聯繫。
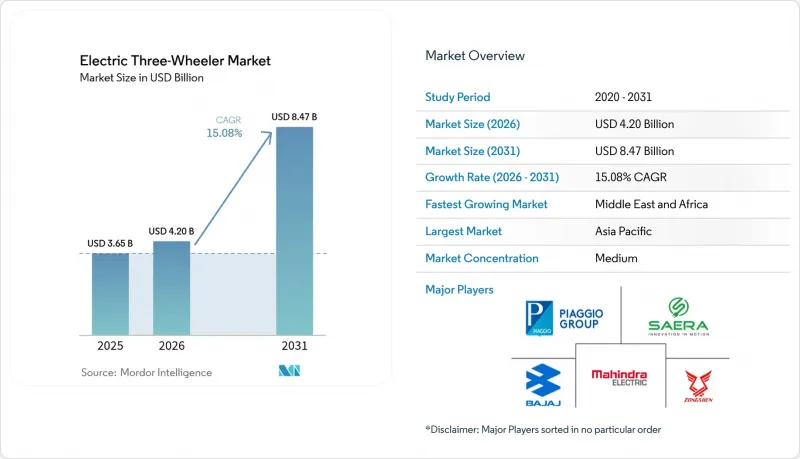
2025 年電動三輪車市場價值 36.5 億美元,預計到 2031 年將達到 84.7 億美元,而 2026 年為 42 億美元,預測期(2026-2031 年)複合年成長率為 15.08%。
政策的快速調整、總擁有成本 (TCO) 方面突破性的成本平等以及資金籌措機制的多元化,正在推動搭乘用和貨運領域的需求成長。印度的「總理電動駕駛計劃」(PM E-DRIVE) 和提案的「FAME-III」計劃、美國《通貨膨脹控制法案》下的商業信貸以及歐盟的「Fit-for-55」一攬子計劃,正共同作用,進一步提升高利用率車輛細分市場已有的價格競爭力。在供給方面,隨著鋰離子電池組價格在2024年年減12%,技術轉型正在加速,與鉛酸電池系統的成本差距正在縮小。基礎設施創新也發揮著至關重要的作用。截至2025年10月,印度的「電池智慧」(Battery Smart) 換電網路將在1400個站點完成5000萬次電池更換,將商用車輛駕駛員的停機時間從數小時縮短至數分鐘。
全球電動三輪車市場趨勢及洞察
不斷擴大的購買獎勵正在推動市場加速成長。
一項協調一致的補貼方案顯著降低了實施成本。印度已根據FAME-III提案累計4,100印度盧比(約4.92億美元)用於電動三輪車,並計分類階段減少撥款,以防止需求急劇下降。美國和歐盟也出現了類似的趨勢,為支持工廠產能投資創造了可預測的政策前景。以往的經驗表明,在先前的獎勵政策實施期間,銷售量成長了近十倍。這提高了確定性,降低了資金籌措成本,並穩定了各地區的電動三輪車市場。
電子商務最後一公里轉型正在重塑需求模式。
小包裹量的激增正促使物流公司從二輪車輛轉向負載容量更大的電動三輪車。與內燃機車輛相比,商用車輛的營運成本最多可降低2.5倍,直接提高了新興市場駕駛者的收入。歐洲和北美的零售商也在試行電動四輪車,這顯示其應用可能會波及亞洲以外的城市。同時,可更換電池將停機時間縮短至兩分鐘以內,進一步提高了資產利用率。
三輪車缺乏專用充電基礎設施
在印度,目前有11,000個公共充電站投入運作,但這僅佔2030年電動三輪車市場所需130萬個充電站的1%。超過17%的故障率正在削弱用戶的信心,即使在英國這樣的成熟地區,也出現了「充電沙漠」。換電站提供了一種部分解決方案,但其推廣需要標準化和資金投入以及激勵措施。
細分市場分析
至2025年,在南亞特特大城市共享出行文化的推動下,搭乘用三輪車將佔電動三輪車市場的81.65%。然而,貨運三輪車的成長速度最快,複合年成長率達18.60%,反映了末端物流的快速發展。因此,預計到2031年,以貨運為驅動的電動三輪車市場規模將快速成長。
不斷提高的車輛利用率正在擴大總擁有成本 (TCO) 的收益,並鼓勵車隊營運商採用「融資+置換」方案,從而顯著減少停機時間。在肯亞等市場,電動駕駛人的收入已經超過了內燃機汽車司機,凸顯了電動卡車的商業性吸引力。儘管由於叫車應用帶來的競爭壓力,客運服務的成長速度有所放緩,但預計其銷售額仍將保持穩定。
由於鉛酸電池組初始成本較低,預計到2025年其市佔率將達到63.90%,但鋰離子電池系統預計將在2031年以20.75%的複合年成長率超越鉛酸電池。價格下降和能量密度標準的提高共同推動了鋰離子電池在電動三輪車市場佔有率的成長。寧德時代(CATL)電池成本的降低(從2023年中期的每千瓦時110美元降至2024年中期的每千瓦時56美元)代表著技術經濟的根本性轉變,並正在加速鋰離子電池的普及應用。
磷酸鋰鐵(LFP)電池憑藉其更安全的熱性能,在需要可預測運作週期的市政部門和宅配車隊中越來越受歡迎。同時,豪華汽車製造商更傾向於使用高能量密度的富鎳電池組,這種電池組可將續航里程提升至200公里以上,例如Montra Super Auto的續航里程就達到了203公里。
區域分析
到2025年,亞太地區將主導電動三輪車市場,佔72.10%的市場。光是印度一國,2023年銷量就將達到58萬輛,較去年成長65%,主要得益於FAME-II補貼政策的推動。由於中國國內電動車供應過剩,中國供應商正將剩餘產能轉移到東南亞,例如雅迪在印尼投資1.5億美元建設的工廠。泰國計劃在2030年建成1450座換電站,為65萬輛二輪車提供服務,凸顯了政府主導的基礎建設的強勁勢頭。
中東和非洲地區是成長最快的地區,複合年成長率高達19.55%。在阿拉伯聯合大公國,受2050年淨零排放目標的推動,電動車普及率從2021年的0.7%飆升至2023年的13%。在非洲市場,兩輪和三輪電動車正成為重要的收入來源;在盧安達,太陽能供電的電池更換站正被用於緩解電網瓶頸。歐洲和北美地區的普及速度相對較慢。微型電動車的進口關稅有所提高,這可能會使美國車隊使用的「Eli ZERO」等車型的價格翻倍。儘管如此,都市區貨運領域的努力以及低速區域的設立,正在為緊湊型三輪汽車開闢新的市場,使其在北美保持11.41%的複合年成長率。
其他好處:
- Excel格式的市場預測(ME)表
- 3個月的分析師支持
目錄
第1章:引言
- 研究假設和市場定義
- 調查範圍
第2章:調查方法
第3章執行摘要
第4章 市場狀況
- 市場概覽
- 市場促進因素
- 擴大購買獎勵
- 電子商務最後一公里配送的快速發展。
- TCO 的快速平價
- 鋰離子電池能量密度提高且價格下降
- 金融科技微租賃平台
- 電池交換站的維護
- 市場限制因素
- 缺乏3W專用充電基礎設施
- 鋰離子電池價格波動與營運資金緊張
- 不同的改裝和型式認可法規
- 安全召回事件導致聲譽風險增加
- 價值/供應鏈分析
- 監理情勢
- 技術展望
- 波特五力模型
- 新進入者的威脅
- 買方的議價能力
- 供應商的議價能力
- 替代品的威脅
- 競爭公司之間的競爭
第5章 市場規模和成長預測(價值和數量)
- 按最終用途
- 客運
- 貨物運輸
- 依電池類型
- 鋰離子
- 鉛酸電池
- 輸出功率(千瓦)
- 小於2千瓦
- 2~4 kW
- 4~6 kW
- 6千瓦或以上
- 按收費模式
- 固定式(插電式)充電
- 更換電池
- 按地區
- 北美洲
- 美國
- 加拿大
- 北美其他地區
- 南美洲
- 巴西
- 阿根廷
- 南美洲其他地區
- 歐洲
- 德國
- 英國
- 法國
- 義大利
- 西班牙
- 俄羅斯
- 其他歐洲地區
- 亞太地區
- 中國
- 印度
- 日本
- 韓國
- 東協(印尼、泰國、越南、菲律賓、馬來西亞)
- 亞太其他地區
- 中東和非洲
- 中東
- 海灣合作理事會(沙烏地阿拉伯、阿拉伯聯合大公國、卡達、阿曼、科威特、巴林)
- 土耳其
- 其他中東國家
- 非洲
- 南非
- 奈及利亞
- 肯亞
- 其他非洲地區
- 中東
- 北美洲
第6章 競爭情勢
- 市場集中度
- 策略趨勢
- 市佔率分析
- 公司簡介
- Mahindra Electric Mobility Ltd
- Bajaj Auto Ltd
- Piaggio & C. SpA
- YC Electric Vehicle Pvt Ltd
- Saera Electric Auto Pvt Ltd
- Kinetic Green Energy & Power Solutions Ltd
- Terra Motors Corp
- Lohia Auto Industries
- Omega Seiki Mobility
- ATUL Auto Ltd
- Euler Motors
- Altigreen Propulsion Labs
- Biliti Electric Inc
- Olectra Greentech Ltd
- TVS Motor Company Ltd
- Bodo Vehicle Group Co Ltd
- E-Tuk Factory BV
- Goenka Electric Motor Vehicles Pvt Ltd
- Chongqing Zongshen Vehicle Co Ltd
第7章 市場機會與未來展望
The electric three-wheeler market size was valued at USD 3.65 billion in 2025 and estimated to grow from USD 4.2 billion in 2026 to reach USD 8.47 billion by 2031, at a CAGR of 15.08% during the forecast period (2026-2031).
Rapid policy convergence, breakthrough total-cost-of-ownership parity, and a deepening pool of financing mechanisms are pulling demand forward in both passenger and goods carrier use cases. India's PM E-DRIVE and the proposed FAME-III programme, the United States Inflation Reduction Act commercial credits, and the EU Fit-for-55 package together sharpen the pricing edge that already exists in high-utilisation fleets. On the supply side, lithium-ion pack prices fell 12% year-over-year in 2024, narrowing the cost delta with lead-acid systems and accelerating the technology transition. Infrastructure innovation also plays a defining role: as of October 2025, Battery Smart, an Indian battery swapping network, has completed 50 million battery swaps at its 1,400 stations, reducing downtime for commercial drivers from hours to mere minutes.
Global Electric Three-Wheeler Market Trends and Insights
Extended Purchase Incentives Drive Market Acceleration
Coordinated subsidy regimes cut acquisition costs sharply. India earmarked INR 4,100 crore (USD 492 million) for electric three-wheelers under the FAME-III proposal, with phased reductions designed to prevent abrupt demand cliffs. Similar momentum builds in the US and EU, creating predictable policy horizons that support factory capacity investment. Historical evidence shows a multiplier of up to 10 times on sales during earlier incentive rounds. The resulting certainty lowers financing costs and steadies the electric three-wheeler market across regions.
E-commerce Last-mile Transformation Reshapes Demand Patterns
Surging parcel volumes are driving logistics operators to shift from two-wheelers to higher-payload three-wheelers in the Electric Three-Wheeler Market. Commercial users realise operating costs up to 2.5x lower than internal-combustion alternatives, directly boosting driver income in emerging markets. Western retailers are also testing electric quadricycles, signalling spill-over into non-Asian cities, while swap-ready batteries further enhance asset utilisation by cutting downtime to under two minutes.
Sparse Dedicated 3-W Charging Infrastructure
India operates 11,000 public chargers, barely 1% of the 1.3 million units required by 2030 in the Electric Three-Wheeler Market. Fault rates exceeding 17% dent user trust, and "charging deserts" appear even in mature regions such as Great Britain. Swap hubs provide a partial remedy, yet scale-up depends on standardisation and concessional capital flows.
Other drivers and restraints analyzed in the detailed report include:
- Rapid TCO Parity Achievement Accelerates Adoption
- Rising Li-ion Energy Density Enables Performance Breakthroughs
- Li-ion Price Volatility Creates Working-Capital queeze
For complete list of drivers and restraints, kindly check the Table Of Contents.
Segment Analysis
Passenger carriers commanded 81.65% of the electric three-wheeler market in 2025, underpinned by an entrenched shared-mobility culture in South-Asian megacities. Yet, goods carriers generate the fastest expansion at an 18.60% CAGR, reflecting the boom in last-mile logistics. The electric three-wheeler market size attributable to goods movement will thus widen rapidly through 2031.
Higher utilisation rates amplify total-cost-of-ownership benefits, encouraging fleet operators to adopt finance-plus-swap bundles that slash downtime. Rider earnings in markets such as Kenya already exceed combustion equivalents, confirming the commercial appeal. Passenger services will still post steady unit volumes, although competitive pressure from ride-hailing apps tempers their growth trajectory.
Lead-acid packs held a 63.90% share in 2025 thanks to their low entry cost, but lithium-ion systems will outpace with a 20.75% CAGR to 2031. The electric three-wheeler market share of lithium-ion batteries rises as price declines intersect with rising energy-density benchmarks. CATL's battery cost reduction from USD 110 per kWh in mid-2023 to USD 56 by mid-2024 represents a fundamental shift in technology economics that accelerates lithium-ion adoption.
LFP chemistries, offering safer thermal characteristics, gain traction in municipal and courier fleets seeking predictable duty cycles. Premium passenger operators favour high-energy nickel-rich packs that extend range above 200 km, as demonstrated by Montra Super Auto's 203 km rating.
The Electric Three-Wheeler Market Report is Segmented by End Use (Passenger Carrier and Goods Carrier), Battery Type (Lithium-Ion and Lead Acid), Power Output (Less Than 2kW, 2 -4 KW, 4 - 6 KW, and Above 6 KW), Charging Model (Fixed (Plug-In) Charging and Battery Swapping), and Geography. The Market Forecasts are Provided in Terms of Value (USD) and Volume (Units).
Geography Analysis
Asia-Pacific dominated the electric three-wheeler market with a 72.10% share in 2025. India alone sold 580,000 units in 2023, a 65% year-over-year surge on the back of FAME-II grants. Chinese suppliers, buoyed by domestic EV oversupply, channel surplus capacity into Southeast Asia, including a USD 150 million Indonesian plant by Yadea. Thailand's target of 1,450 swap stations supporting 650,000 two-wheelers by 2030 underscores state-backed infrastructure momentum.
The Middle East and Africa is the fastest-growing region at 19.55% CAGR. The UAE's penetration jumped from 0.7% in 2021 to 13% in 2023 amid 2050 net-zero goals. African markets adopt two- and three-wheelers as primary income generators; Rwanda leverages solar-powered swap hubs to overcome grid bottlenecks. Europe and North America record more measured uptake. Micro-EV imports face rising tariffs, potentially doubling prices for models such as the Eli ZERO in United States fleets. Nevertheless, urban freight initiatives and low-speed zones open niches for compact three-wheelers, sustaining 11.41% CAGR in North America.
- Mahindra Electric Mobility Ltd
- Bajaj Auto Ltd
- Piaggio & C. SpA
- YC Electric Vehicle Pvt Ltd
- Saera Electric Auto Pvt Ltd
- Kinetic Green Energy & Power Solutions Ltd
- Terra Motors Corp
- Lohia Auto Industries
- Omega Seiki Mobility
- ATUL Auto Ltd
- Euler Motors
- Altigreen Propulsion Labs
- Biliti Electric Inc
- Olectra Greentech Ltd
- TVS Motor Company Ltd
- Bodo Vehicle Group Co Ltd
- E-Tuk Factory BV
- Goenka Electric Motor Vehicles Pvt Ltd
- Chongqing Zongshen Vehicle Co Ltd
Additional Benefits:
- The market estimate (ME) sheet in Excel format
- 3 months of analyst support
TABLE OF CONTENTS
1 Introduction
- 1.1 Study Assumptions & Market Definition
- 1.2 Scope of the Study
2 Research Methodology
3 Executive Summary
4 Market Landscape
- 4.1 Market Overview
- 4.2 Market Drivers
- 4.2.1 Extended purchase incentives
- 4.2.2 E-commerce last-mile boom
- 4.2.3 Rapid TCO parity
- 4.2.4 Rising Li-ion energy density and price fall
- 4.2.5 Fin-tech micro-leasing platforms
- 4.2.6 Battery-swap corridor build-outs
- 4.3 Market Restraints
- 4.3.1 Sparse dedicated 3-W charging infrastructure
- 4.3.2 Li-ion price volatility & working-capital squeeze
- 4.3.3 Fragmented retrofit & homologation rules
- 4.3.4 Heightened safety-recall reputation risk
- 4.4 Value / Supply-Chain Analysis
- 4.5 Regulatory Landscape
- 4.6 Technological Outlook
- 4.7 Porter's Five Forces
- 4.7.1 Threat of New Entrants
- 4.7.2 Bargaining Power of Buyers
- 4.7.3 Bargaining Power of Suppliers
- 4.7.4 Threat of Substitutes
- 4.7.5 Intensity of Competitive Rivalry
5 Market Size & Growth Forecasts (Value and Volume)
- 5.1 By End Use
- 5.1.1 Passenger Carrier
- 5.1.2 Goods Carrier
- 5.2 By Battery Type
- 5.2.1 Lithium-ion
- 5.2.2 Lead Acid
- 5.3 By Power Output (kW)
- 5.3.1 Less than 2 kW
- 5.3.2 2 - 4 kW
- 5.3.3 4 - 6 kW
- 5.3.4 Above 6 kW
- 5.4 By Charging Model
- 5.4.1 Fixed (Plug-in) Charging
- 5.4.2 Battery Swapping
- 5.5 By Geography
- 5.5.1 North America
- 5.5.1.1 United States
- 5.5.1.2 Canada
- 5.5.1.3 Rest of North America
- 5.5.2 South America
- 5.5.2.1 Brazil
- 5.5.2.2 Argentina
- 5.5.2.3 Rest of South America
- 5.5.3 Europe
- 5.5.3.1 Germany
- 5.5.3.2 United Kingdom
- 5.5.3.3 France
- 5.5.3.4 Italy
- 5.5.3.5 Spain
- 5.5.3.6 Russia
- 5.5.3.7 Rest of Europe
- 5.5.4 Asia-Pacific
- 5.5.4.1 China
- 5.5.4.2 India
- 5.5.4.3 Japan
- 5.5.4.4 South Korea
- 5.5.4.5 ASEAN (Indonesia, Thailand, Vietnam, Philippines, Malaysia)
- 5.5.4.6 Rest of Asia-Pacific
- 5.5.5 Middle East & Africa
- 5.5.5.1 Middle East
- 5.5.5.1.1 GCC (Saudi Arabia, UAE, Qatar, Oman, Kuwait, Bahrain)
- 5.5.5.1.2 Turkey
- 5.5.5.1.3 Rest of Middle East
- 5.5.5.2 Africa
- 5.5.5.2.1 South Africa
- 5.5.5.2.2 Nigeria
- 5.5.5.2.3 Kenya
- 5.5.5.2.4 Rest of Africa
- 5.5.5.1 Middle East
- 5.5.1 North America
6 Competitive Landscape
- 6.1 Market Concentration
- 6.2 Strategic Moves
- 6.3 Market Share Analysis
- 6.4 Company Profiles (includes Global Level Overview, Market Level Overview, Core Segments, Financials as Available, Strategic Information, Market Rank/Share for Key Companies, Products and Services, SWOT Analysis, and Recent Developments)
- 6.4.1 Mahindra Electric Mobility Ltd
- 6.4.2 Bajaj Auto Ltd
- 6.4.3 Piaggio & C. SpA
- 6.4.4 YC Electric Vehicle Pvt Ltd
- 6.4.5 Saera Electric Auto Pvt Ltd
- 6.4.6 Kinetic Green Energy & Power Solutions Ltd
- 6.4.7 Terra Motors Corp
- 6.4.8 Lohia Auto Industries
- 6.4.9 Omega Seiki Mobility
- 6.4.10 ATUL Auto Ltd
- 6.4.11 Euler Motors
- 6.4.12 Altigreen Propulsion Labs
- 6.4.13 Biliti Electric Inc
- 6.4.14 Olectra Greentech Ltd
- 6.4.15 TVS Motor Company Ltd
- 6.4.16 Bodo Vehicle Group Co Ltd
- 6.4.17 E-Tuk Factory BV
- 6.4.18 Goenka Electric Motor Vehicles Pvt Ltd
- 6.4.19 Chongqing Zongshen Vehicle Co Ltd
7 Market Opportunities & Future Outlook
- 7.1 White-space & Unmet-Need Assessment

 電動三輪車市場:以三輪車類型、電池類型、應用、國家和地區分類-全球產業分析、市場規模、市場佔有率及2026年至2033年預測
 電動三輪車市場-2026-2032年全球市場預測電動三輪車市場:按推進系統、電池類型、充電基礎設施、應用和銷售管道分類-全球市場預測(2026-2032 年)
 電動三輪車市場分析及預測(至2035年):類型、產品類型、技術、組件、應用、最終用戶、功能、安裝方式、設備、模式電動自行車市場分析及預測(至2035年):類型、產品類型、技術、組件、應用、材料類型、部署模式、最終用戶、功能、安裝模式彈弓/三輪摩托車市場分析及預測(至2035年):類型、產品、技術、應用、最終用戶、功能、安裝類型
 改裝電動三輪車市場-全球產業規模、佔有率、趨勢、機會、預測:按車型、電池容量、電池類型、地區和競爭格局分類,2021-2031年
 電動自行車市場規模、佔有率和趨勢分析報告:按電池、功率輸出、最終用途、地區和細分市場預測(2026-2033 年)
 2026年全球電動三輪車市場報告
 電動三輪車市場:按電池類型、座位數、馬達功率、最終用戶和地區分類