


 |
市場調查報告書
商品編碼
2043874
替代燃料汽車:市場佔有率分析、產業趨勢與統計及成長預測(2026-2031 年)Automotive Alternative Fuel Vehicle - Market Share Analysis, Industry Trends & Statistics, Growth Forecasts (2026 - 2031) |
||||||
※ 本網頁內容可能與最新版本有所差異。詳細情況請與我們聯繫。
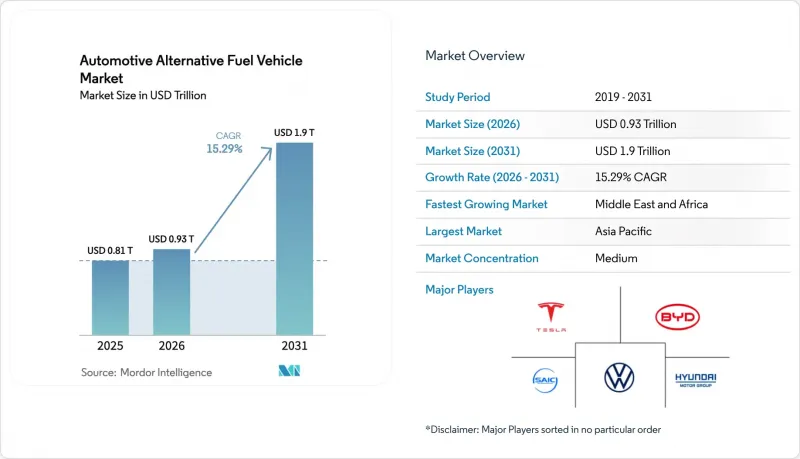
預計替代燃料汽車市場規模將從 2025 年的 8,100 億美元成長到 2026 年的 9,300 億美元,然後從 2026 年到 2031 年以 15.29% 的複合年成長率成長,到 2031 年達到 1.9 兆美元。
美國、歐盟、中國、印度和日本日益嚴格的脫碳法規正在收緊內燃機汽車的上市經濟空間,促使消費者轉向純電池式電動車、氫燃料電池汽車和燃油汽車。預計到2025年,電池組價格將下降,氫氣罐成本將降至每千瓦時12美元,快速充電網路也將在三大洲不斷擴展,從而緩解人們對續航里程和加氫時間的擔憂。車隊營運商正在加快採購以滿足範圍3報告的要求,大型物流公司也越來越依賴替代驅動系統來規避柴油價格波動的影響。同時,汽車製造商正在加速電池供應鏈的在地化,以符合美國的國內含量要求,並規避歐盟2035年內燃機淘汰條款。
全球汽車替代燃料汽車市場趨勢與洞察
政府強制推行脫碳政策和採購獎勵
零排放法規正在收緊汽車製造商的產品週期彈性。美國《通貨膨脹削減法案》將稅額扣抵延長至2032年,並為二手電動車提供獎勵,同時收緊在地採購標準。歐盟已將2025年汽車平均二氧化碳排放目標降至93.6克/公里,每超標1克將被處以95歐元(約112美元)的罰款。這意味著每家汽車製造商可能面臨超過10億歐元(約10億美元)的罰款。中國的雙軌制電動車銷售計畫為每輛售出的電池式電動車獎勵大量可交易積分,實際上為超額完成配額的製造商提供了交叉補貼。印度的生產關聯激勵計畫(PLI)正在投資35億美元用於電池製造,並將範圍擴大到燃料電池摩托車。日本的綠色成長策略涵蓋燃料電池汽車50%的增加成本,並將補貼限制在同時簽約興建加氫站的購車者身上。
電池組和氫氣罐的成本正在迅速下降。
到2025年,磷酸鋰鐵化學、電芯與電池包一體化以及鈉離子技術的進步,將顯著降低電池組的成本,使其較2022年大幅下降。寧德時代(CATL)的「神星Plus」電芯透過快速充電實現了更長的續航里程,充電時間與汽油車的加油時間相當。與金屬內襯氫氣瓶相比,更輕的複合材料IV型氫氣瓶降低了系統成本,使其得以應用於8級卡車。比亞迪延長了保固期限,緩解了二手市場買家對車輛殘值的擔憂。同時,豐田早期固態固態電池原型在能量密度方面取得了顯著提升,但仍受限於電解的生產規模。
高昂的初始價格與內燃機汽車和替代燃料汽車之間的價格差異。
2025年,小型電池式電動車(BEV)轎車的價格高於汽油動力車。這種價格差異歸因於電動車車型為了確保盈利而增加的增強型資訊娛樂和安全功能。另一方面,燃料電池轎車的價格仍然很高,主要是因為每個燃料電池堆都使用了鉑金。然而,產業藍圖的目標是到2028年減少鉑金的使用量。雖然對於年行駛里程高的車隊來說,總擁有成本(TCO)已經趨於穩定,但這導致行駛里程較短的個人車主需要更長的投資回收期。在印度,入門級電動車電池佔車輛建議零售價(MSRP)的很大一部分。這一高比例是由於小容量電池組的產量有限、缺乏規模經濟以及推高零件價格的進口限制造成的。
細分市場分析
電動車在新能源汽車市場中佔最大佔有率,銷量佔比高達60.12%。磷酸鋰鐵的成長速度正在放緩。
儘管氫能平台在2025年僅佔市場佔有率的一小部分,但預計到2031年,隨著主要貨運路線沿線加氫點密度的增加以及鉑金使用量減少導致堆疊成本在2028年下降,氫能平台的年均成長率將達到24.01%。長途貨運、市立公車和港口貨物裝卸設備都非常看重15分鐘的加氫時間,有助於維持受笨重電池限制的資產運轉率。在天然氣自產市場,由於其零售價格比柴油便宜40%,壓縮天然氣(CNG)、液化天然氣(LNG)和液化石油氣(LPG)仍維持著一定的市場佔有率。同時,由於強制性乙醇摻混政策,生質燃料的市場佔有率保持穩定,為燃油車保有量較大的地區提供了過渡方案。
到2025年,乘用車將佔據大部分收入,並佔替代燃料汽車市場佔有率的56.33%。然而,隨著財政獎勵的減少以及中等收入家庭推遲購車以等待價格進一步趨於平衡,乘用車市場的成長速度正在放緩。中型和重型卡車將以最快的速度成長,到2031年複合年成長率將達到19.23%。這主要得益於零售商和第三方物流業者的合約採購,他們希望保護其貨運價格免受柴油價格波動的影響。
專用充電站可容納兆瓦級充電樁和700巴氫氣泵,將長途運輸的投資回收期縮短至三年以內。在印度和東南亞,兩輪和三輪車輛的銷售佔據絕對主導地位,因為在這些地區,電池更換網路克服了家用充電的障礙。輕型商用貨車進一步證明,再生煞車和走走停停的駕駛循環能夠顯著降低能源成本,加速了宅配業者轉型為電氣化的藍圖。
區域分析
預計到2025年,亞太地區將成為全球新能源汽車銷量最高的地區,佔全球交貨量的38.12%。這主要得益於中國新能源汽車1649萬輛的註冊量以及印度摩托車電動化的快速發展。北京的「雙積分」政策要求汽車製造商在2026年前達到一定的新能源汽車產量,迫使合資企業要麼擴大生產平台,要麼購買積分。這種壓力實際上促使政府對國內電池技術企業提供津貼。印度的「生產連結獎勵計畫計畫(PLI)」已撥款35億美元用於電池工廠的本地化建設,多個邦還增加了購車補貼,使得電動摩托車的每公里總成本低於汽油車。日本的氫能發展藍圖包括建造加氫站,並對每輛燃料電池汽車的價格差額提供50%的補貼,但其註冊量仍未達到預期目標。韓國正透過調整政策,將購車補貼與特定價格區間的車輛掛鉤,從而扶持其本土品牌現代化和起亞。
中東和非洲地區雖然市場規模相對較小,但預計到2031年將以17.24%的複合年成長率成長。沙烏地阿拉伯公共投資基金正在資助興建Ceer品牌組裝廠,目標是到2030年實現年產50萬輛。阿拉伯聯合大公國(阿拉伯聯合大公國)計劃在2030年建成大量公共充電站,並透過允許零排放車輛免費停車來促進高階市場的普及。南非豐富的鉑金資源推動了氫燃料試點車隊在採礦作業中的應用,與風扇相比,氫燃料無需柴油即可降低地下隧道的通風成本。埃及和土耳其正利用關稅豁免吸引與中國企業的合作,以供應價格適中的電動車並擴大其本地供應商生態系統。北非沿海地區的風能和太陽能資源也為面向歐盟合成燃料市場的綠色氫能計畫奠定了基礎。
北美和歐洲在2025年的銷量中均佔據了相當大的市場佔有率。在美國,電動車銷量大幅成長,稅額扣抵(前提是在地採購)。加拿大也推出了類似的稅收優惠政策,加速了東西向充電走廊的建設。在歐洲,電動車註冊量顯著成長,其中挪威的註冊率超過90%,遠高於其他國家,這主要歸功於該國增值稅(VAT)。德國的「適合55歲人群」(Fit-for-55)政策迫使大眾等汽車製造商承諾對電氣化進行大量投資,而寶馬和梅賽德斯-奔馳則專注於利潤更高的混合動力汽車,直到基礎設施發展前景更加明朗。巴西憑藉靈活燃料汽車的運作和27%乙醇混合燃料的引入,繼續保持其在液態生質燃料領域的領先地位,但由於電池組的進口關稅和充電樁短缺,電動車的普及率仍然很低。
其他好處:
- Excel格式的市場預測(ME)表
- 3個月的分析師支持
目錄
第1章:引言
- 研究假設和市場定義
- 調查範圍
第2章:調查方法
第3章執行摘要
第4章 市場狀況
- 市場概覽
- 市場促進因素
- 政府強制推行脫碳政策和採購獎勵
- 電池組和氫氣罐的成本正在迅速下降。
- 擴大電動車充電/氫氣/壓縮天然氣加氣通道
- 大型物流和電子商務公司為實現車輛電氣化所做的努力
- 針對傳統內燃機車輛的合成替代型電子燃料的商業試點項目
- 擴大二手電池在固定式儲能系統的應用。
- 市場限制因素
- 與內燃機汽車相比,多種替代燃料產品線有較高的初始成本和價格差異。
- 新興市場高功率充電對電網穩定性的限制。
- 氫能和先進生質燃料供應鏈的基礎設施缺口
- 關鍵礦物(鋰、鎳、鈷、鉑)供應鏈的波動性
- 價值/供應鏈分析
- 監理情勢
- 技術展望
- 波特五力模型
- 新進入者的威脅
- 買方的議價能力
- 供應商的議價能力
- 替代品的威脅
- 競爭公司之間的競爭
第5章 市場規模及成長預測(價值(美元)及數量(單位))
- 按燃料類型
- CNG/LNG/LPG/汽車燃氣
- 電動車(EV)
- 氫燃料電池汽車(FCEV)
- 生質燃料(乙醇、生質柴油)
- 車輛類型
- 摩托車
- 三輪車
- 搭乘用車
- 輕型商用車
- 中型和大型卡車
- 巴士和長途汽車
- 非公路/建築和農業設備
- 透過推進技術
- 混合
- 系列混合動力
- 並聯混合
- 電池式電動車
- 燃料電池電動車
- 雙燃料(CNG-汽油/LPG-汽油)
- 混合
- 最終用戶
- 個人用戶
- 車隊營運商
- 政府和地方政府的交通運輸
- 其他
- 按地區
- 北美洲
- 美國
- 加拿大
- 北美其他地區
- 南美洲
- 巴西
- 阿根廷
- 南美洲其他地區
- 歐洲
- 德國
- 英國
- 法國
- 義大利
- 西班牙
- 俄羅斯
- 其他歐洲地區
- 亞太地區
- 中國
- 日本
- 印度
- 韓國
- 亞太其他地區
- 中東和非洲
- 沙烏地阿拉伯
- 阿拉伯聯合大公國
- 埃及
- 土耳其
- 南非
- 其他中東和非洲地區
- 北美洲
第6章 競爭情勢
- 市場集中度
- 策略趨勢
- 市佔率分析
- 公司簡介
- Tesla Inc.
- BYD Co. Ltd.
- Toyota Motor Corporation
- Volkswagen AG
- Hyundai Motor Company
- BMW AG
- Mercedes-Benz Group AG
- Ford Motor Company
- General Motors Company
- Honda Motor Co., Ltd.
- Nissan Motor Co., Ltd.
- Kia Corporation
- SAIC Motor Corp.
- Stellantis NV
- Volvo Group
- Tata Motors Ltd.
- Audi AG
- Maruti Suzuki Ltd.
第7章 市場機會與未來展望
The automotive alternative fuel vehicle market size is expected to grow from USD 0.81 trillion in 2025 to USD 0.93 trillion in 2026 and is forecast to reach USD 1.90 trillion by 2031 at a 15.29% CAGR over 2026-2031.
Intensifying decarbonization mandates in the United States, the European Union, China, India, and Japan are compressing the economic window for new internal-combustion launches, nudging buyers toward battery-electric, hydrogen, and gaseous-fuel platforms. Falling battery-pack prices in 2025, alongside hydrogen-tank costs sliding to USD 12 per kilowatt-hour, and fast-charging corridors scaling in three continents together neutralize historical range-anxiety and refueling-time objections. Fleet operators are accelerating purchases to meet Scope 3 reporting obligations, and logistics majors increasingly treat alternative drivetrains as a hedge against diesel-price volatility. Meanwhile, automakers are racing to localize battery supply chains to comply with the United States domestic-content rules and to sidestep the European Union's 2035 combustion-engine sunset clause.
Global Automotive Alternative Fuel Vehicle Market Trends and Insights
Government Decarbonization Mandates and Purchase Incentives
Zero-emission regulations are compressing automaker product-cycle latitude. The United States Inflation Reduction Act extends credits through 2032 and introduces an incentive for used EVs while tightening local-content thresholds. The European Union's fleet-average CO2 target dropped to 93.6 g/km in 2025, with penalties of EUR 95 (~USD 112) per excess gram, which can accumulate to over EUR 1 billion (~USD 1 billion) per carmaker . China's dual-credit scheme awards significant tradable points per battery-electric sale, effectively cross-subsidizing manufacturers that outpace quotas. India's PLI plan channels USD 3.5 billion into cell manufacturing and widens eligibility to fuel-cell two-wheelers. Japan's Green Growth Strategy covers 50% of the incremental cost of fuel-cell cars and ties subsidies to buyers subscribing to certified hydrogen stations.
Rapid Decline in Battery-Pack and H2-Tank Costs
By 2025, advancements in lithium-iron-phosphate chemistry, cell-to-pack integration, and sodium-ion technology significantly reduced battery-pack costs compared to 2022. CATL's Shenxing Plus cells now offer extended range with rapid charging, matching the refueling time of gasoline vehicles. Composite type-IV hydrogen cylinders, being lighter than their metal-lined counterparts, have lowered system costs, enabling adoption in class-8 trucks. BYD has extended warranties to cover longer distances, alleviating concerns about residual values for secondary-market purchasers. Meanwhile, Toyota's early-stage solid-state prototypes have achieved notable energy density improvements, though they're still limited by the scale of electrolyte production.
High Upfront Price Gap vs. ICE Parity Across Several Alt-Fuel Lines
In 2025, compact battery-electric sedans were priced higher than their gasoline counterparts. This price difference stemmed from enhanced infotainment and safety packages added to the electric models to safeguard profit margins. Meanwhile, fuel-cell sedans remained expensive, primarily due to the use of platinum in each stack. However, industry roadmaps aim to reduce platinum usage by 2028. While fleets covering significant distances annually achieved total-cost-of-ownership parity, private owners driving shorter distances faced extended payback periods. In India, entry-level EV batteries constituted a substantial portion of the vehicle's MSRP. This high percentage is attributed to limited small pack volumes, which hinder economies of scale, and import restrictions that drive up component prices.
Other drivers and restraints analyzed in the detailed report include:
- Expansion of EV-Charging / H2-CNG Refueling Corridors
- Fleet-Electrification Commitments by Logistics and E-Commerce Majors
- Grid-Stability Limits on High-Power Charging in Emerging Markets
For complete list of drivers and restraints, kindly check the Table Of Contents.
Segment Analysis
Electric vehicles generated the largest slice of the automotive alternative fuel vehicle market, accounting for 60.12% of revenue. Cost declines in lithium-iron-phosphate cells, fast-charging corridors, and widespread dealer familiarity anchor near-term dominance. Yet growth moderates as early-adopter consumer pools saturate and subsidies step down in several large economies.
Hydrogen platforms, though only a nominal share of 2025 volume, are forecast to compound at 24.01% annually to 2031 as refueling density improves on major freight corridors and as platinum-loading reductions shave the stack cost by 2028. Long-haul trucking, municipal buses, and port-handling equipment value the 15-minute refuel window, retaining asset utilization that bulky batteries would otherwise curtail. CNG, LNG, and LPG retain a niche share, buoyed by 40% pump-price discounts versus diesel in markets with domestic gas production. Meanwhile, mandated ethanol blends keep biofuels at a steady share, supplying a transition solution for regions with vast existing combustion fleets.
Passenger cars dominated revenue in 2025, representing 56.33% of the automotive alternative fuel vehicle market share. Growth, however, flattens as fiscal incentives taper and middle-income households delay purchases pending further price parity. Medium and heavy-duty trucks grow the fastest at a 19.23% CAGR through 2031, underpinned by contractual purchase agreements by retailers and 3PL operators eager to insulate freight rates from diesel volatility.
Dedicated depots allow megawatt chargers or 700-bar hydrogen pumps, compressing payback periods below three years in high-mileage lanes. Two-wheelers and three-wheelers capture outsized unit volumes in India and Southeast Asia, where battery-swap networks sidestep home-charging hurdles. Light commercial vans further illustrate that regenerative braking plus stop-start duty cycles slash energy costs, enticing parcel couriers to commit to electrification road-maps.
The Automotive Alternative Fuel Vehicle Market Report is Segmented by Fuel Type (CNG/LNG/LPG/Autogas, Electric Vehicles, and More), Vehicle Type (Two-Wheelers, Three-Wheelers, and More), Propulsion Technology (Hybrid, Battery-Electric, and More), End-User (Private Users, Fleet Operators, and More), and Geography. The Market Forecasts are Provided in Terms of Both Value (USD) and Volume (Units).
Geography Analysis
Asia-Pacific generated the largest regional turnover in 2025, equal to 38.12% of deliveries, propelled by China's 16.49 million new-energy-vehicle registrations and India's rapidly electrifying two-wheeler segment. Beijing's dual-credit policy obliges automakers to achieve a significant NEV output in 2026, forcing joint-ventures either to ramp proprietary platforms or buy credits, a pressure that effectively subsidizes domestic battery specialists. India's Production-Linked Incentive scheme disburses USD 3.5 billion to localize cell factories, while several states top up purchase grants, enabling electric scooters to underprice gasoline rivals in total cost per kilometer. Japan's hydrogen-roadmap underwrites both station roll-outs and 50% of the incremental price gap per fuel-cell car, yet registrations still trail headline targets. South Korea aligns its policy by linking purchase rebates to specific price range vehicles, nurturing domestic brands Hyundai and Kia.
The Middle East and Africa region, although a small base, is forecast to advance at 17.24% CAGR through 2031. Saudi Arabia's Public Investment Fund finances the Ceer brand's assembly complex, targeting 500,000 annual units by 2030. The United Arab Emirates earmarks a significant number of public chargers by 2030 and permits free parking for zero-emission cars, stimulating premium-segment uptake. South Africa's platinum endowment fosters hydrogen pilot fleets in mining operations, where eliminating diesel ventilates underground shafts more cheaply than fans. Egypt and Turkey leverage tariff exemptions to attract Chinese partnerships that deliver affordable EVs and expand local supplier ecosystems. North African coastal wind and solar resources also underpin green-hydrogen projects aimed at EU synthetic-fuel markets.
North America and Europe each captured a notable share of 2025 revenue. The United States recorded a significant number of EV sales, lifted by the Inflation Reduction Act's generous consumer credits, albeit conditioned on localized battery content. Canada mirrors tax incentives and accelerates East-to-West charging corridor build-outs. Europe posted notable registrations, with Norway uniquely above 90% due to VAT exemptions. Germany's Fit-for-55 policy forces OEMs such as Volkswagen to pledge a significant investment toward electrification, whereas BMW and Mercedes hedge with higher-margin hybrids until infrastructure certainties improve . Brazil continues to exemplify liquid-biofuel leadership, operating flex-fuel cars and blending ethanol at 27%, though EV take-up remains low due to import tariffs on battery packs and charger scarcity.
- Tesla Inc.
- BYD Co. Ltd.
- Toyota Motor Corporation
- Volkswagen AG
- Hyundai Motor Company
- BMW AG
- Mercedes-Benz Group AG
- Ford Motor Company
- General Motors Company
- Honda Motor Co., Ltd.
- Nissan Motor Co., Ltd.
- Kia Corporation
- SAIC Motor Corp.
- Stellantis N.V.
- Volvo Group
- Tata Motors Ltd.
- Audi AG
- Maruti Suzuki Ltd.
Additional Benefits:
- The market estimate (ME) sheet in Excel format
- 3 months of analyst support
TABLE OF CONTENTS
1 Introduction
- 1.1 Study Assumptions and Market Definition
- 1.2 Scope of the Study
2 Research Methodology
3 Executive Summary
4 Market Landscape
- 4.1 Market Overview
- 4.2 Market Drivers
- 4.2.1 Government Decarbonization Mandates and Purchase Incentives
- 4.2.2 Rapid Decline in Battery-Pack and H2-Tank Costs
- 4.2.3 Expansion of EV-Charging / H2-CNG Refueling Corridors
- 4.2.4 Fleet-Electrification Commitments by Logistics and E-Commerce Majors
- 4.2.5 Commercial Pilots of Synthetic Drop-in E-Fuels for Legacy ICE Fleets
- 4.2.6 Growing Adoption of Second-Life Batteries for Stationary Storage
- 4.3 Market Restraints
- 4.3.1 High Upfront Price Gap vs. ICE Parity Across Several Alt-Fuel Lines
- 4.3.2 Grid-Stability Limits on High-Power Charging in Emerging Markets
- 4.3.3 Infrastructure Gaps for H2 and Advanced-Biofuel Supply Chains
- 4.3.4 Volatility in Critical-Mineral Supply Chains (Li, Ni, Co, Pt)
- 4.4 Value / Supply-Chain Analysis
- 4.5 Regulatory Landscape
- 4.6 Technological Outlook
- 4.7 Porter's Five Forces
- 4.7.1 Threat of New Entrants
- 4.7.2 Bargaining Power of Buyers
- 4.7.3 Bargaining Power of Suppliers
- 4.7.4 Threat of Substitutes
- 4.7.5 Competitive Rivalry
5 Market Size & Growth Forecasts (Value (USD) and Volume (Units))
- 5.1 By Fuel Type
- 5.1.1 CNG / LNG / LPG / Autogas
- 5.1.2 Electric Vehicles (EV)
- 5.1.3 Hydrogen Fuel-Cell (FCEV)
- 5.1.4 Biofuels (Ethanol, Biodiesel)
- 5.2 By Vehicle Type
- 5.2.1 Two-Wheelers
- 5.2.2 Three-Wheelers
- 5.2.3 Passenger Cars
- 5.2.4 Light Commercial Vehicles
- 5.2.5 Medium and Heavy-Duty Trucks
- 5.2.6 Buses and Coaches
- 5.2.7 Off-Highway / Construction and Agri Equipment
- 5.3 By Propulsion Technology
- 5.3.1 Hybrid
- 5.3.1.1 Series Hybrid
- 5.3.1.2 Parallel Hybrid
- 5.3.2 Battery-Electric
- 5.3.3 Fuel-Cell Electric
- 5.3.4 Dual-Fuel (CNG-Gasoline / LPG-Gasoline)
- 5.3.1 Hybrid
- 5.4 By End-User
- 5.4.1 Private Users
- 5.4.2 Fleet Operators
- 5.4.3 Government and Municipal Transport
- 5.4.4 Others
- 5.5 By Geography
- 5.5.1 North America
- 5.5.1.1 United States
- 5.5.1.2 Canada
- 5.5.1.3 Rest of North America
- 5.5.2 South America
- 5.5.2.1 Brazil
- 5.5.2.2 Argentina
- 5.5.2.3 Rest of South America
- 5.5.3 Europe
- 5.5.3.1 Germany
- 5.5.3.2 United Kingdom
- 5.5.3.3 France
- 5.5.3.4 Italy
- 5.5.3.5 Spain
- 5.5.3.6 Russia
- 5.5.3.7 Rest of Europe
- 5.5.4 Asia-Pacific
- 5.5.4.1 China
- 5.5.4.2 Japan
- 5.5.4.3 India
- 5.5.4.4 South Korea
- 5.5.4.5 Rest of Asia-Pacific
- 5.5.5 Middle East and Africa
- 5.5.5.1 Saudi Arabia
- 5.5.5.2 United Arab Emirates
- 5.5.5.3 Egypt
- 5.5.5.4 Turkey
- 5.5.5.5 South Africa
- 5.5.5.6 Rest of the Middle East and Africa
- 5.5.1 North America
6 Competitive Landscape
- 6.1 Market Concentration
- 6.2 Strategic Moves
- 6.3 Market Share Analysis
- 6.4 Company Profiles (Includes Global Level Overview, Market Level Overview, Core Segments, Financials as Available, Strategic Information, Market Rank/Share for Key Companies, Products and Services, SWOT Analysis, and Recent Developments)
- 6.4.1 Tesla Inc.
- 6.4.2 BYD Co. Ltd.
- 6.4.3 Toyota Motor Corporation
- 6.4.4 Volkswagen AG
- 6.4.5 Hyundai Motor Company
- 6.4.6 BMW AG
- 6.4.7 Mercedes-Benz Group AG
- 6.4.8 Ford Motor Company
- 6.4.9 General Motors Company
- 6.4.10 Honda Motor Co., Ltd.
- 6.4.11 Nissan Motor Co., Ltd.
- 6.4.12 Kia Corporation
- 6.4.13 SAIC Motor Corp.
- 6.4.14 Stellantis N.V.
- 6.4.15 Volvo Group
- 6.4.16 Tata Motors Ltd.
- 6.4.17 Audi AG
- 6.4.18 Maruti Suzuki Ltd.
7 Market Opportunities and Future Outlook
- 7.1 White-space and Unmet-Need Assessment
 汽車燃料電池汽車市場預測至2034年-全球車輛類型、燃料電池類型、氫氣儲存方式、續航里程、應用及區域分析
 汽車燃料市場:市場規模、佔有率和趨勢分析(按燃料類型、車輛類型和地區分類),細分市場預測(2026-2033 年)
 替代燃料汽車市場:按推進系統、續航里程、車輛類型和應用分類-2026-2032年全球市場預測汽車燃油系統市場:依燃油類型、組件類型、車輛類型和銷售管道分類-2026-2032年全球市場預測
 替代燃料汽車和混合動力汽車市場:按燃料類型、車輛類型、車輛等級和地區分類(2026-2034 年)
 替代燃料汽車市場:按燃料類型、車輛類型和地區分類
 2026年全球替代燃料汽車市場報告
 替代燃料汽車市場規模、佔有率、成長及全球產業分析:按類型、應用和地區分類,並預測至2026-2034年
 替代燃料汽車市場-全球產業規模、佔有率、趨勢、機會和預測,按燃料類型、車輛類型、地區和競爭格局分類,2020-2030年預測
 替代燃料汽車(AFV):全球市場佔有率和排名、總銷量和需求預測(2025-2031 年)