


 |
市場調查報告書
商品編碼
2043871
礬土:市佔率分析、產業趨勢與統計、成長預測(2026-2031)Bauxite - Market Share Analysis, Industry Trends & Statistics, Growth Forecasts (2026 - 2031) |
||||||

※ 本網頁內容可能與最新版本有所差異。詳細情況請與我們聯繫。
預計礬土市場將從 2025 年的 2.9613 億噸和 2026 年的 3.0762 億噸成長到 2031 年的 3.7211 億噸,2026 年至 2031 年的年複合成長率(CAGR)為 3.88%。
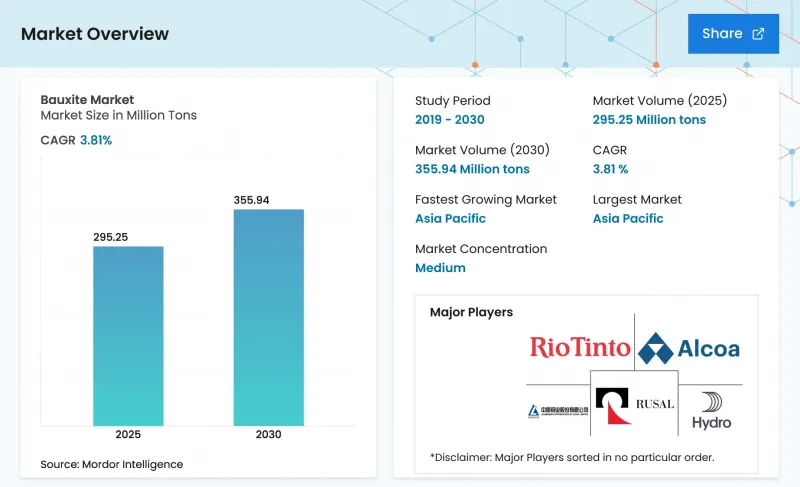
脫碳政策,特別是歐盟的碳邊境調節機制(CBAM),正迫使鋁供應鏈優先選擇價格較高的可追溯低碳礦石。電弧爐的日益普及推動了耐火材料的需求,進而增加了對能夠承受劇烈熱循環的高純度氧化鋁磚的需求。從礦場到冶煉廠的整合趨勢正在加速發展,力拓集團於2024年收購幾內亞博克西特公司(Compagnie de Boxite de Guinea)的股份便是一個例證。此舉確保了內部供應,並圖企業策略從傳統的現貨採購模式轉向其他模式。同樣,印度和歐洲的舉措正在將紅土這種礦產品轉化為有價值的稀土元素和建築材料,從而維持礦山獲利能力並提高財務回報。
全球礬土市場趨勢及洞察
小型鋼鐵廠向氧化鋁基耐火磚過渡
2024年,全球電弧爐(EAF)部署量激增。這些在粗鋼生產中發揮關鍵作用的新型電弧爐設施,其爐襯已從傳統的鎂碳材料轉向高鋁磚。 2025年,JSW鋼鐵公司的耐火材料競標表明,其更傾向於活性二氧化矽含量低於2%的礬土,凸顯了業界對純度的重視。與綜合鋼廠相比,東南亞模組化小型鋼廠的每噸產量耐火材料消耗量增加。這種需求的成長推高了高鋁礦石的現貨價格,使其高於冶金礦石。由於全球合格礦山不到10座,供應緊張推動了貿易,並促進了選礦流程的改進。因此,專注於耐火材料精礦的礦業公司比散裝礦石的礦業公司獲得了更高的毛利率。
印度和東協政府主導的基礎設施獎勵策略
印度雄心勃勃的國家基礎設施計劃,其願景延伸至2030年,為交通、能源和城市發展項目撥出了大量資金。這項措施促使印度上調了2025-2026會計年度預算中國內鋁需求預測。同時,東協的互聯互通計劃,著重於連接關鍵的鐵路、港口和電網,預計將改變礬土的年度通路。這些原本運往出口碼頭的礬土,現在將流入區域提煉中心。例如,越南隆城機場正在使用馬來西亞氧化鋁製成的鋁覆材,這便是需求激增的一個例子。此外,印尼禁止原礦出口的政策也引發了國內冶煉廠建設計畫的激增。這些冶煉廠目前處理本地礬土,顯著減少了海運。總而言之,這些努力正在推動供應鏈效率的提高、區域溢價的提升以及礬土市場需求前景的改善。
能源成本波動推高了燃燒利潤率。
氧化鋁提煉是高耗能工藝,每噸氧化鋁的耗電量龐大。 2025年底,歐洲現貨電力價格較2023年水準顯著上漲。這一漲幅降低了利潤率,並導致德國和法國的工廠停產。在美鋁公司位於奎納納的工廠,2025年能源成本急劇上升,對息稅折舊攤提前利潤(EBITDA)造成了負面影響。那些苦苦掙扎於成本飆升且無法獲得可再生能源購電協議(PPA)的生產商面臨著永久關閉的風險。因此,貿易正轉向中東低關稅的煉廠,歐洲礬土市場的流動性也日益緊張。
細分市場分析
預計2026年至2031年預測期內,耐火材料需求將以4.72%的複合年成長率成長。冶金氧化鋁佔出貨量的77.12%,但由於中國逐步淘汰高成本冶煉設施,其成長速度放緩。耐火材料,尤其是高Al₂O₃含量的耐火磚,價格較高。這種溢價是合理的,因為這些耐火磚可以延長電弧爐(EAF)的使用壽命,並減少代價高昂的停機時間。合格材料的供應限制使利潤率保持穩定。水泥和磨料是小眾市場,但也受益於需求的成長。在水泥領域,對速凝鈣礬土水泥(CAC)的需求推動了溫和成長;在磨料領域,半導體拋光應用的需求推動了成長。
預計到2031年,礬土應用領域鋁土礦的市佔率將萎縮,而耐火材料和特種化學品領域將擴大。為此,供應商正投入大量資金,轉向生產耐火材料級鋁土礦。這一策略轉變凸顯了鋁土礦行業更廣泛的趨勢,即在各個應用領域從“數量”轉向“品質”,這將進一步擴大礬土市場的價格差距。
本礬土市場報告按應用領域(冶金氧化鋁、水泥、耐火材料、磨料及其他)、等級(冶金級、化工級、耐火材料和磨料級)以及地區(亞太地區、北美地區、歐洲地區、南美地區以及中東和非洲地區)進行細分。市場預測以噸為單位。
區域分析
到2025年,亞太地區將佔全球鋁產量的54.44%,預計在2026年至2031年的預測期內將以4.32%的複合年成長率成長。這一成長得益於中國強勁的氧化鋁產量和不斷成長的鋁需求,而鋁需求的成長主要由印度的基礎設施建設規劃所驅動。中國嚴重依賴進口,先前大量礬土,主要來自幾內亞。然而,由於出口限制,來自印尼的供應量已大幅下降。在印度,潘奇帕特馬利礦的運作及其產能的擴大,顯著降低了該國對進口的依賴,並表明全部區域正在轉向使用國產礦石。
北美在2025年的需求趨勢中也佔據了重要地位。美國主要依靠從牙買加和巴西進口來增強提煉能力。加拿大沃德勒伊提煉依賴澳洲礦石,墨西哥擠壓產業則進口氧化鋁,這些都凸顯了該地區近岸外包的趨勢。
與此同時,歐洲的影響力正在下降。能源成本上漲導致德國和法國一系列產能關閉,原礦也轉移到了中東那些經濟效益更高的工廠。歐盟的碳邊境調節機制(CBAM)鼓勵進口經認證的低碳產品。自2023年以來,此類進口量顯著增加,到2025年,大部分礬土採購都將採用第三方碳檢驗。
以巴西為首的南美洲在海上貿易中扮演著至關重要的角色,其主要貿易路線通往中國和北美。挪威海德魯公司(Norsk Hydro)不斷擴建的帕拉戈米納斯(Paragominas)礦場處於領先地位,該公司雄心勃勃地計劃在2028年實現碳中和採礦,並積極推進太陽能發電項目。阿根廷在中國資金的支持下,計劃在2029年前擴大巴約魯科山脈(Sierra de Bajoruco)計畫的產量。
在中東和非洲地區,幾內亞預計2025年將做出重大貢獻,成為全球供應鏈的重要參與者。然而,由於新的課稅成長和強制性國內加工,這一趨勢正在改變。位於阿拉伯聯合大公國的Al-Tawira冶煉廠加工來自幾內亞的礦石,其與天然氣掛鉤的現金成本高於歐洲市場水平,從而推動了該地區的成長。
其他好處:
- Excel格式的市場預測(ME)表
- 3個月的分析師支持
目錄
第1章:引言
- 研究假設和市場定義
- 調查範圍
第2章:調查方法
第3章執行摘要
第4章 市場狀況
- 市場概覽
- 市場促進因素
- 小型鋼鐵廠向氧化鋁基耐火磚過渡
- 印度和東協政府主導的基礎設施獎勵策略
- OEM供應穩定計畫(投資自有礦場)
- 透過有效利用赤泥和等離子體技術,可以消除廢棄物堆積。
- 基於區塊鏈的低碳礬土可追溯性溢價
- 市場限制因素
- 能源成本波動推高了射擊利潤率。
- 環境、社會及公司治理(ESG)主導的新建待開發區資本配置限制
- 地緣政治資源民族主義與出口課稅波動
- 價值鏈分析
- 波特五力模型
- 供應商的議價能力
- 買方的議價能力
- 新進入者的威脅
- 替代品的威脅
- 競爭公司之間的競爭
- 生產分析
第5章 市場規模與成長預測
- 透過使用
- 冶金氧化鋁
- 水泥
- 耐火材料
- 磨料
- 其他用途
- 按年級
- 冶金
- 化學
- 耐火材料
- 磨料
- 按地區
- 亞太地區
- 中國
- 印度
- 日本
- 韓國
- 亞太其他地區
- 北美洲
- 美國
- 加拿大
- 墨西哥
- 歐洲
- 德國
- 英國
- 義大利
- 法國
- 其他歐洲地區
- 南美洲
- 巴西
- 阿根廷
- 南美洲其他地區
- 中東和非洲
- 沙烏地阿拉伯
- 南非
- 其他中東和非洲
- 亞太地區
第6章 競爭情勢
- 市場集中度
- 策略趨勢
- 市佔率(%)/排名分析
- 公司簡介
- Alcoa Corporation
- Aluminum Corporation of China Limited
- Bauxite Mining
- Emirates Global Aluminium PJSC
- Grafit Madencilik AS
- Guinea Bauxite Company
- Hindalco Industries Ltd.
- Iran Alumina Company
- Jamalco
- Metalcorp
- Metlen Energy and Metals
- Norsk Hydro ASA
- Queensland Alumina Limited
- Rio Tinto
- RusAL
- Vimetco NV
第7章 市場機會與未來展望
The Bauxite Market size is projected to expand from 296.13 million tons in 2025 and 307.62 million tons in 2026 to 372.11 million tons by 2031, registering a CAGR of 3.88% between 2026 to 2031.
Decarbonization policies, especially the EU's Carbon Border Adjustment Mechanism, are pushing aluminum supply chains to prioritize traceable low-carbon ore, which fetches premium prices. With the rise of electric-arc furnaces, there is an escalating demand for refractory-grade materials, amplifying the need for high-purity alumina bricks capable of withstanding intense heat cycles. The trend of mine-to-mill integration is gaining momentum, as demonstrated by Rio Tinto's 2024 acquisition of a stake in Compagnie des Bauxites de Guinee, ensuring a captive supply and marking a strategic pivot from traditional spot procurement. Similarly, initiatives in India and Europe are transforming red mud, a mining byproduct, into valuable rare-earth elements and construction materials, thereby prolonging mine viability and enhancing financial returns.
Global Bauxite Market Trends and Insights
Shift Toward Alumina-Based Refractory Bricks in Steel Mini-Mills
In 2024, the global installation of electric-arc furnaces (EAF) surged. Each new EAF unit, pivotal in crude steel production, now relies on high-alumina bricks, marking a departure from traditional magnesia-carbon linings. In 2025, JSW Steel's refractories tender highlighted a preference for bauxite with less than 2% reactive silica, emphasizing the industry's focus on purity. Modular mini-mills in the Southeast Asia region are now consuming refractories at a higher rate per ton of output than their integrated counterparts. This increased demand has driven spot prices for high-alumina ore above those of metallurgical variants. With fewer than a dozen qualified mines worldwide, the constrained supply has tightened trade dynamics and spurred beneficiation upgrades. As a result, miners focusing on refractory-grade concentrates are achieving significant gross-margin premiums over bulk ore.
Government-Backed Infrastructure Stimulus in India and ASEAN
India's National Infrastructure Pipeline, with its ambitious vision extending to 2030, has allocated substantial funds for transportation, energy, and urban projects. This initiative has prompted an upward revision in domestic aluminum demand forecasts for the FY 2025-26 budget. Concurrently, ASEAN's connectivity blueprint, with its focus on vital rail, port, and grid connections, is set to reroute annual bauxite. Once destined for export terminals, this bauxite will now flow into regional refining hubs. Highlighting the surging demand, Vietnam's Long Thanh airport is sourcing its aluminum cladding from Malaysian alumina. Additionally, Indonesia's prohibition on raw-ore exports has triggered a surge of domestic refinery projects. These refineries, now processing local bauxite, have significantly reduced seaborne volumes. Collectively, these initiatives are streamlining supply chains, amplifying regional premiums, and enhancing demand visibility in the Bauxite market.
Volatile Energy Costs Inflating Calcination Margins
Alumina refining is energy-intensive, consuming an amount of electricity per ton. By late 2025, European spot power prices increased significantly compared to 2023 levels. This rise reduced profit margins, resulting in capacity shutdowns in Germany and France. Alcoa's Kwinana plant experienced a significant increase in energy costs in 2025, negatively impacting its EBITDA. Producers struggling with elevated costs and lacking renewable Power Purchase Agreements (PPAs) face the risk of permanent closure. As a result, trade is shifting toward low-tariff refineries in the Middle-East, while liquidity in the European Bauxite market tightens.
Other drivers and restraints analyzed in the detailed report include:
- Supply-Security Programs by OEMs (Captive Mine Investments)
- Plasma-Based Red-Mud Valorization Unlocking Waste Stockpiles
- ESG-Driven Capital Rationing for New Greenfield Mines
For complete list of drivers and restraints, kindly check the Table Of Contents.
Segment Analysis
Refractory demand is projected to grow at a CAGR of 4.72% during the forecast period of 2026-2031. Metallurgical alumina, which held a dominant 77.12% of the volume, experienced a deceleration in its growth rate, a consequence of China's phased retirement of its high-cost smelting capacities. Refractories, especially those with high Al2O3 bricks, command a premium. This premium is justified as these bricks extend the lifespan of Electric Arc Furnaces (EAFs), leading to fewer costly operational stoppages. A constrained supply of qualified materials has stabilized profit margins. While cement and abrasives hold niche positions, they benefit from rising demands: rapid-setting Calcium Aluminate Cement (CAC) in cement and semiconductor polishing in abrasives, driving modest growth.
By 2031, the Bauxite market's share for metallurgical use is set to wane, with refractories and specialty chemicals increasingly claiming the volumes. In response, suppliers are channeling significant capital expenditures towards upgrading to refractory-grade materials. This strategic pivot highlights a broader industry trend: a shift in focus from quantity to quality across diverse application segments, deepening the price divergence in the Bauxite market.
The Bauxite Market Report is Segmented by Application (Alumina for Metallurgical Purposes, Cement, Refractories, Abrasives, and Other Applications), Grade (Metallurgical, Chemical, Refractory, and Abrasive), and Geography (Asia-Pacific, North America, Europe, South America, and Middle-East and Africa). The Market Forecasts are Provided in Terms of Volume (Tons).
Geography Analysis
Asia-Pacific, accounting for 54.44% of global volume in 2025, is set to grow at a 4.32% CAGR through the forecast period of 2026-2031. This growth is fueled by China's robust alumina output and rising aluminum demand, largely driven by infrastructure initiatives in India. China, which heavily relies on imports, sourced a significant volume of bauxite, predominantly from Guinea. However, following a ban, Indonesia's contribution saw a sharp decline. India's expanded Panchpatmali, now with increased capacity, has notably lessened the nation's dependence on imports, signaling a regional pivot towards domestic ore.
North America also made its mark in the 2025 demand landscape. The United States leaned on imports, mainly from Jamaica and Brazil, to bolster its refining capacity. Canada's Vaudreuil refinery, reliant on Australian ore, and Mexico's extrusion sector, which brought in alumina, highlight the region's trend towards near-shoring.
Meanwhile, Europe's influence is waning. Rising energy costs led to capacity closures in Germany and France, causing a shift of raw ore to more economically viable plants in the Middle-East. The European Union's Carbon Border Adjustment Mechanism (CBAM) is advocating for certified low-carbon imports. A noteworthy uptick from 2023, a large segment of 2025's bauxite acquisitions came with third-party carbon verification.
South America, spearheaded by Brazil, played a pivotal role in the seaborne trade, primarily directing shipments to China and North America. Norsk Hydro's expanded Paragominas is at the forefront, championing solar power endeavors with an ambitious goal of carbon-neutral mining by 2028. Argentina, with Chinese financial backing, is setting its sights on ramping up output at the Sierra de Bahoruco project by 2029.
The Middle-East and Africa, with Guinea making significant contributions in 2025, are key players in the global supply chain. Yet, with new levy hikes and domestic processing mandates, the dynamics are evolving. The UAE's Al Taweelah refinery, processing Guinean ore, boasts gas-linked cash costs that outpace European rates, propelling the region's growth.
- Alcoa Corporation
- Aluminum Corporation of China Limited
- Bauxite Mining
- Emirates Global Aluminium PJSC
- Grafit Madencilik A.S.
- Guinea Bauxite Company
- Hindalco Industries Ltd.
- Iran Alumina Company
- Jamalco
- Metalcorp
- Metlen Energy and Metals
- Norsk Hydro ASA
- Queensland Alumina Limited
- Rio Tinto
- RusAL
- Vimetco NV
Additional Benefits:
- The market estimate (ME) sheet in Excel format
- 3 months of analyst support
TABLE OF CONTENTS
1 Introduction
- 1.1 Study Assumptions and Market Definition
- 1.2 Scope of the Study
2 Research Methodology
3 Executive Summary
4 Market Landscape
- 4.1 Market Overview
- 4.2 Market Drivers
- 4.2.1 Shift toward alumina-based refractory bricks in steel mini-mills
- 4.2.2 Government-backed infrastructure stimulus in India and ASEAN
- 4.2.3 Supply-security programs by OEMs (captive mine investments)
- 4.2.4 Plasma-based red-mud valorisation unlocking waste stockpiles
- 4.2.5 Blockchain-enabled traceability premiums for low-carbon bauxite
- 4.3 Market Restraints
- 4.3.1 Volatile energy costs inflating calcination margins
- 4.3.2 ESG-driven capital rationing for new green-field mines
- 4.3.3 Geostrategic resource nationalism and export-levy volatility
- 4.4 Value Chain Analysis
- 4.5 Porter's Five Forces
- 4.5.1 Bargaining Power of Suppliers
- 4.5.2 Bargaining Power of Buyers
- 4.5.3 Threat of New Entrants
- 4.5.4 Threat of Substitutes
- 4.5.5 Competitive Rivalry
- 4.6 Production Analysis
5 Market Size and Growth Forecasts (Volume)
- 5.1 By Application
- 5.1.1 Alumina for Metallurgical Purposes
- 5.1.2 Cement
- 5.1.3 Refractories
- 5.1.4 Abrasives
- 5.1.5 Other Applications
- 5.2 By Grade
- 5.2.1 Metallurgical
- 5.2.2 Chemical
- 5.2.3 Refractory
- 5.2.4 Abrasive
- 5.3 By Geography
- 5.3.1 Asia-Pacific
- 5.3.1.1 China
- 5.3.1.2 India
- 5.3.1.3 Japan
- 5.3.1.4 South Korea
- 5.3.1.5 Rest of Asia-Pacific
- 5.3.2 North America
- 5.3.2.1 United States
- 5.3.2.2 Canada
- 5.3.2.3 Mexico
- 5.3.3 Europe
- 5.3.3.1 Germany
- 5.3.3.2 United Kingdom
- 5.3.3.3 Italy
- 5.3.3.4 France
- 5.3.3.5 Rest of Europe
- 5.3.4 South America
- 5.3.4.1 Brazil
- 5.3.4.2 Argentina
- 5.3.4.3 Rest of South America
- 5.3.5 Middle-East and Africa
- 5.3.5.1 Saudi Arabia
- 5.3.5.2 South Africa
- 5.3.5.3 Rest of Middle-East and Africa
- 5.3.1 Asia-Pacific
6 Competitive Landscape
- 6.1 Market Concentration
- 6.2 Strategic Moves
- 6.3 Market Share(%)/Ranking Analysis
- 6.4 Company Profiles (includes Global Overview, Market Overview, Core Segments, Financials, Strategic Information, Products and Services, Recent Developments)
- 6.4.1 Alcoa Corporation
- 6.4.2 Aluminum Corporation of China Limited
- 6.4.3 Bauxite Mining
- 6.4.4 Emirates Global Aluminium PJSC
- 6.4.5 Grafit Madencilik A.S.
- 6.4.6 Guinea Bauxite Company
- 6.4.7 Hindalco Industries Ltd.
- 6.4.8 Iran Alumina Company
- 6.4.9 Jamalco
- 6.4.10 Metalcorp
- 6.4.11 Metlen Energy and Metals
- 6.4.12 Norsk Hydro ASA
- 6.4.13 Queensland Alumina Limited
- 6.4.14 Rio Tinto
- 6.4.15 RusAL
- 6.4.16 Vimetco NV
7 Market Opportunities and Future Outlook
- 7.1 White-space and Unmet-need Assessment

 礬土市場-2026-2032年全球市場預測
 礬土市場:按產品、應用和地區分類
 燒結礬土市場規模、佔有率和成長分析:按產品密度/等級、粒度/目數範圍、應用和地區分類-2026-2033年產業預測礬土水泥市場:2026-2032年全球市場預測(依產品種類、等級、製造技術、應用、終端用戶產業及銷售管道)礬土開採市場:2026-2032年全球預測,依最終用途產業、製程、產品類型通路通路分類
 全球礬土市場:市場規模、佔有率和趨勢分析(按產品、應用和地區分類),細分市場預測(2026-2033 年)
 日本礬土開採市場規模、佔有率、趨勢和預測(按礦石/礦床類型、品位、加工階段、最終用途行業和地區分類),2026-2034年工業耐火級礬土市場依純度、製造流程、形態、應用及最終用途產業分類,全球預測(2026-2032年)
 煅燒鋁土礦市場規模、佔有率、成長及全球產業分析:依類型、應用、區域洞察及預測(2026-2034 年)
 礬土市場規模、佔有率和成長分析(按等級類型、應用和地區分類)-2026-2033年產業預測