


 |
市場調查報告書
商品編碼
2043869
預測圖:市場佔有率分析、產業趨勢與統計、成長預測(2026-2031 年)Projection Mapping - Market Share Analysis, Industry Trends & Statistics, Growth Forecasts (2026 - 2031) |
||||||
※ 本網頁內容可能與最新版本有所差異。詳細情況請與我們聯繫。
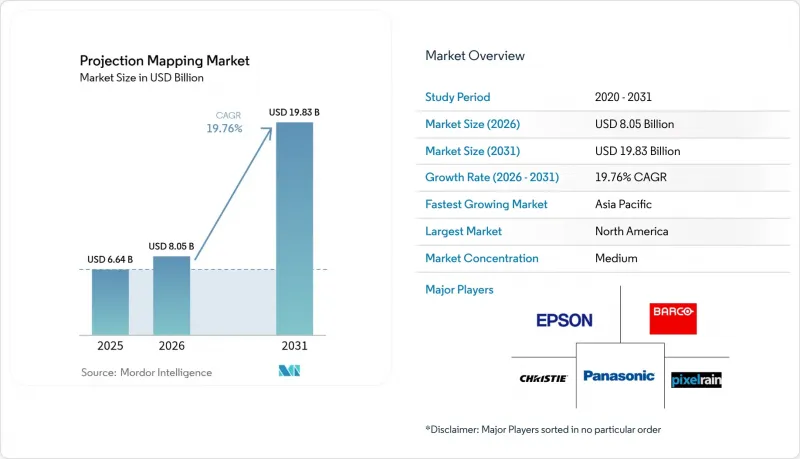
預計投影映射市場將從 2025 年的 66.4 億美元和 2026 年的 80.5 億美元成長到 2031 年的 198.3 億美元,2026 年至 2031 年的年複合成長率(CAGR)為 19.76%。
高亮度雷射投影機的普及、每流明成本的降低以及即時人工智慧生成內容工作流程的出現,正加速其在公共地標、主題樂園和零售旗艦店的應用。在日本、沙烏地阿拉伯和阿拉伯聯合大公國等國的智慧城市計畫中,由於預期可預測的旅遊收入以及基於攝影機的自動校準減少了現場工作量,投影映射正被重新定位為永久性基礎設施。品牌正將廣告預算轉向身臨其境型外牆投影,其社群媒體分享率超過15比1,在敘事深度和記憶衝擊力方面超越了靜態LED顯示器。硬體供應商現在將雲端內容平台與投影機捆綁銷售,這些平台可以監控運作和能耗,從而產生持續的業務收益,並將投影機停機時間減少高達50%。
全球投影映射市場趨勢及洞察
身臨其境型廣告與實況活動體驗
品牌正將廣告支出從靜態廣告看板轉向外觀廣告,以產生更高的互動指標和大量的用戶原創社群內容。可口可樂的「皮卡迪利廣場燈光宣傳活動」和阿迪達斯的「牛津街外牆廣告」都證明,在複雜的表面上講述故事可以營造電影般的深度,同時也能證明LED廣告的單次曝光成本是合理的。主題樂園也採用了類似的策略。奧蘭多環球影城的「CineSational」電影秀讓遊客平均停留時間延長了22分鐘,直接帶動了餐飲銷售額的成長。體育場館走廊也開始引入互動投影,將走道空間轉化為吸引贊助商的媒體平台;而日本的免費入場節慶活動則展示了一種以贊助商主導的盈利模式。永久性裝置可以降低每次活動的搭建成本,從而在多年周期內提高投資報酬率。
我們推出了一款高亮度雷射投影機。
亮度超過 25,000 流明的 RGB 雷射引擎擁有 20,000 小時的使用壽命,顯著降低了維護頻率,並可實現無人值守的屋頂安裝。 Panasonic-RQ50K 系列產品涵蓋了東京都政府大樓 13,905平方公尺,無需現場人員即可實現夜間照明。科視數位 (Christie Digital) 在一些傳統燈泡照明設備白天無法運作的場館中部署了 45,000 流明的型號。雷射產品的價格溢價已降至 1.8 倍,五年總擁有成本 (TCO) 方面,雷射系統更具優勢。中東地區的大型企劃為了控制其 10 年的服務預算,指定只採購雷射產品。
高昂的初始設定和內容成本
一套安裝在2500平方公尺外牆上的永久性公共設施系統需要80萬至150萬美元的造價,這使得只有市政當局、財富500強企業和頂級博物館才能負擔得起。雖然租賃方案成本效益高,但會導致70%至80%的閒置時間,從而壓縮了設備的利潤空間。內容創作仍然是勞力密集的,製作一個10分鐘的節目,每年的成本可能高達4萬至8萬美元。諸如設備即服務(EaaS)和旅遊稅債券之類的資金籌措模式目前僅限於北美和西歐。缺乏標準化的投資報酬率(ROI)基準進一步拖延了價格敏感地區的預算核准。
細分市場分析
2025年,硬體銷售額佔總銷售額的61.83%,反映了投影機、鏡頭和媒體伺服器等設備的資本密集特性。另一方面,軟體銷售額正以21.11%的複合年成長率成長,這得益於雲端平台降低了現場人事費用並實現了播放清單的即時更新。訂閱式授權將一次性銷售轉化為可預測的經常性收入,而遠端診斷則顯著減少了停機時間。 Disguise、Dataton和PanasonicAcroSign等公司的產品現在都捆綁了分析儀表板,用於監控亮度漂移和功耗,幫助場館滿足ISO 50001報告要求。競爭性的雲端套件正在整合觀眾熱圖功能,為場館提供可獲利的資料包,供贊助商使用。由於大多數投影機OEM廠商現在都預先安裝了校準工具,軟體鎖定效應正在將定價權轉移到平台所有者手中。
在預測期內,許多中型博物館將選擇放棄購買投影機,轉而租賃硬體,同時投資購買永久的雲端軟體許可。這項轉變將推動軟體在投影映射市場的佔有率達到數位電子看板領域前所未有的水平,這與先前在廣播圖形領域觀察到的SaaS轉型如出一轍。預計整合生成式人工智慧的平台將收取更高的價格,進一步擴大軟體和硬體之間的收入差距。
到2025年,3D裝置將佔總支出的55.72%,因為觀眾現在需要智慧型手機無法複製的多感官沉浸式體驗。結合投影映射、觸覺回饋、氣味擴散和無人機同步技術的設施通常會對夜間遊客收取額外30至50美元。這些4D形式正以20.82%的複合年成長率成長,它們延長了遊客的停留時間,並帶動了零售和餐飲等相關消費。博物館利用2D疊加技術來製作成本敏感的教育展覽,但人工智慧深度估計插件正在將傳統的2D圖庫轉化為接近3D的內容,從而延長其資產的使用壽命。
身臨其境型體驗專案能有效阻止隨意錄製,從而幫助營運商保護智慧財產權並最大限度地減少未經授權的線上傳播。這種獨特性有助於維持較高的平均票價,預計到2031年,4D技術將在投影映射市場中佔據更大的佔有率。雖然歷史街區出於安全考慮禁止燃放煙火,但大多數4D特效,例如風力噴射和氣味,都符合相關規定,只要文件齊全,獲得許可也相對容易。
區域分析
日本將投影映射技術制度化並納入城市政策,正以21.66%的複合年成長率推動亞太地區的成長。在中東,主權國家正透過相關專案資助大規模部署,這些專案結合了光纖回程傳輸和GPU邊緣節點。北美仍將是2025年最大的收入來源,但隨著其成長模式從新硬體部署轉向內容更新周期,其成長率已穩定在個位數中段。
在歐洲,相關實施工作正穩步推進,主要集中在文化遺產旅遊領域。然而,歐盟指令2024/1619對亮度及運作時間有所限制,延長了許可證的核准流程。儘管如此,巴塞隆納和阿姆斯特丹等地的市政試點計畫已證明,自適應調光演算法能夠在遵守相關規定的同時,維持遊客流量。
在印度、韓國和東南亞,投影機價格的下降,加上文化遺產旅遊的發展,正在創造新的機會。南美洲和非洲由於預算限制和缺乏整合商而發展滯後,但巴西世界盃相關基礎設施和埃及考古展覽等項目表明,一旦資金籌措機製成熟,投影機的普及率未來將會提高。
其他好處:
- Excel格式的市場預測(ME)表
- 3個月的分析師支持
目錄
第1章:引言
- 研究假設和市場定義
- 調查範圍
第2章:調查方法
第3章執行摘要
第4章 市場狀況
- 市場概覽
- 市場促進因素
- 身臨其境型廣告與實況活動體驗
- 高亮度雷射投影機的普及
- 智慧城市地標照明計劃
- 由於採用了RGB雷射引擎,每流明成本更低
- 即時人工智慧內容生成工作流程
- XR階段對互補映射的需求
- 市場限制因素
- 高昂的初始設定和內容成本
- 由於每個站點都需要進行複雜的校準,因此會造成延誤。
- 光害/歷史建築立面相關規定
- 雷射二極體供應鏈的不穩定性
- 價值鏈分析
- 技術展望
- 波特五力模型
- 新進入者的威脅
- 買方的議價能力
- 供應商的議價能力
- 替代品的威脅
- 競爭程度
- 宏觀經濟因素的影響
第5章 市場規模與成長預測
- 報價
- 硬體
- 軟體
- 按尺寸
- 2D
- 3D
- 4D/身臨其境型
- 亮度等級(ANSI lm)
- 不足10,000流明
- 10,000~25,000 lm
- 超過25000流明
- 透過投影技術
- DLP
- LCD
- LCoS 和其他
- 透過繪製目標表面
- 建築立面
- 室內牆壁和地板
- 物品和產品
- 水幕和自然地形
- 透過使用
- 大型設施和外觀
- 活動和節慶
- 主題樂園與景點
- 體育場館和競技場
- 文化遺產地
- 商業設施(零售、商業、教育)
- 其他用途
- 按地區
- 北美洲
- 美國
- 加拿大
- 墨西哥
- 南美洲
- 巴西
- 阿根廷
- 南美洲其他地區
- 歐洲
- 德國
- 法國
- 英國
- 義大利
- 其他歐洲地區
- 亞太地區
- 中國
- 日本
- 韓國
- 印度
- 亞太其他地區
- 中東
- 沙烏地阿拉伯
- 阿拉伯聯合大公國
- 其他中東國家
- 非洲
- 南非
- 埃及
- 其他非洲地區
- 北美洲
第6章 競爭情勢
- 市場集中度
- 策略趨勢
- 市佔率分析
- 公司簡介
- Panasonic Corporation
- Seiko Epson Corporation
- Barco NV
- Christie Digital Systems USA, Inc.
- BenQ Corporation(Qisda)
- ViewSonic Corporation
- Vivitek(Delta Electronics)
- NEC Display Solutions(Sharp)
- Disguise Technologies Limited
- Dataton AB
- HeavyM(Digital Essence SAS)
- Green Hippo Ltd
- Resolume BV
- Blackmagic Design Pty Ltd
- Avolites Ltd
- GarageCube SA(MadMapper)
- Pixel Rain Digital
- Digital Projection Ltd
- Optoma Europe Limited(Coretronic)
- Sony Corporation
- LG Electronics Inc.
- Lightform Inc.
- Lumitrix sro
- Vioso GmbH
第7章 市場機會與未來展望
The projection mapping market size is projected to expand from USD 6.64 billion in 2025 and USD 8.05 billion in 2026 to USD 19.83 billion by 2031, registering a CAGR of 19.76% between 2026 to 2031.
Widespread adoption of high-brightness laser projectors, falling cost-per-lumen metrics, and real-time generative-AI content workflows are accelerating deployments across civic landmarks, theme parks, and retail flagships. Municipal smart-city programs in Japan, Saudi Arabia, and the UAE are reclassifying projection mapping as permanent infrastructure, assured of predictable tourism dividends and lower on-site labor enabled by camera-based auto-calibration. Brands are reallocating advertising budgets toward immersive facade takeovers that deliver social-media amplification ratios exceeding 15:1, outpacing static LED in narrative depth and memorability. Hardware vendors now bundle cloud content platforms that monitor uptime and energy consumption, creating recurring service revenue and reducing projector downtime by up to 50%.
Global Projection Mapping Market Trends and Insights
Immersive Advertising And Live-Event Experiences
Brands are shifting spend from static billboards to facade takeovers that generate superior engagement metrics and large volumes of user-generated social content. Coca-Cola's Piccadilly Lights activation and Adidas's Oxford Street wrap proved that storytelling across complex surfaces matches LED cost-per-impression while delivering cinematic depth. Theme parks duplicate the approach; Universal Orlando Resort's CineSational show extended average guest dwell time by 22 minutes, directly lifting food-and-beverage sales. Stadium corridors now feature interactive projections that convert circulation space into sponsorable media, while free-admission festivals in Japan demonstrate sponsorship-led monetization models. Permanent installations benefit from lower per-event setup costs, improving ROI over multiyear cycles.
High-Brightness Laser Projectors Adoption
RGB laser engines exceeding 25,000 lumens provide 20,000-hour lifespans, slashing maintenance visits and enabling unmanned rooftop arrays. Panasonic's PT-RQ50K series covers 13,905 square meters on the Tokyo Metropolitan Government Building and operates nightly without on-site staff. Christie Digital deploys 45,000-lumen models in arenas where daylight readability was once impossible with lamp-based units. The laser price premium has narrowed to 1.8X, and total cost of ownership now favors laser in five-year models. Middle East megaprojects specify laser-only procurement to contain ten-year service budgets.
High Up-Front Installation And Content Costs
A permanent civic installation on a 2,500-square-meter facade demands USD 0.8-1.5 million, restricting adoption to municipalities, Fortune 500 brands, and tier-1 museums. Rental deployments cost less but suffer 70-80% idle time, eroding fleet margins. Content creation stays labor-intensive; a 10-minute show can incur USD 40,000-80,000 in creative fees each year. Financing models such as equipment-as-a-service and tourism-tax bonds remain confined to North America and Western Europe. Lack of standardized ROI benchmarks further slows budget approvals in price-sensitive regions.
Other drivers and restraints analyzed in the detailed report include:
- Smart-City Landmark Illumination Programs
- Real-Time Generative-AI Content Workflows
- Complex Site-Specific Calibration Delays
For complete list of drivers and restraints, kindly check the Table Of Contents.
Segment Analysis
Hardware accounted for 61.83% of 2025 revenue, reflecting the capital-intensive nature of projectors, lenses, and media servers. Software, however, is rising at a 21.11% CAGR because cloud platforms cut on-site labor and enable real-time playlist updates. Subscription licensing converts one-time sales into predictable annuities while remote diagnostics slash downtime. Disguise, Dataton, and Panasonic's AcroSign now ship bundled analytics dashboards that monitor brightness drift and power draw, helping venues meet ISO 50001 reporting requirements. Competing cloud suites integrate audience heat-mapping, offering venues monetizable data packages for sponsors. As most projector OEMs now preload calibration tools, software lock-in is shifting pricing power toward platform owners.
Over the forecast window, many mid-sized museums will forgo outright projector ownership, instead renting hardware while investing in perpetual cloud software seats. That pivot will raise software's share of the projection mapping market to levels last seen in digital signage, mirroring the SaaS transition previously observed in broadcast graphics. Platforms embedding generative AI are expected to command premium fees, further widening the revenue gap between code and metal.
3D installations held 55.72% of 2025 spending, yet audiences now seek multisensory immersion that smartphones cannot replicate. Venues bundling haptics, fragrance diffusion, and synchronized drones with projection mapping routinely charge night-time visitor premiums of USD 30-50. Such 4D formats, growing at a 20.82% CAGR, bolster guest stay times and ancillary spend on retail and food. Museums leverage 2D overlays for cost-sensitive educational exhibits, but AI depth-estimation plugins are turning legacy 2D libraries into quasi-3D content, extending the life of assets.
Because immersive attractions discourage casual recording, operators protect intellectual property and minimize free online leaks. That exclusivity sustains higher average ticket values, ensuring 4D will capture incremental share of the projection mapping market size by 2031. Although safety regulations in heritage districts limit pyrotechnics, most 4D effects, such as wind jets and scent, comply when properly documented, easingan permitting.
The Projection Mapping Market Report is Segmented by Offering (Hardware, and Software), Dimension (2D, 3D, and More), Brightness Class (Less Than 10, 000 Lm and More), Projection Technology (DLP, LCD, and More), Mapping Surface (Building Facades, Indoor Walls and Floors, and More), Application (Large Venues and Facades, Events and Festivals, and More), and Geography. The Market Forecasts are Provided in Terms of Value (USD).
Geography Analysis
Asia-Pacific leads growth with a 21.66% CAGR as Japan institutionalizes projection mapping within urban policy, and the Middle East funds mega-installations through sovereign programs that bundle fiber backhaul and GPU edge nodes. North America, while still the largest revenue contributor in 2025, is transitioning from new hardware rollouts toward content refresh cycles, stabilizing growth at mid-single-digit rates.
Europe maintains steady adoption anchored in heritage tourism, yet EU Directive 2024/1619 imposes brightness caps and operating-hour limits that lengthen permitting timelines. Municipal pilots in Barcelona and Amsterdam nonetheless demonstrate that adaptive-dimming algorithms can comply with regulations while maintaining visitor flow.
Emerging opportunities arise in India, South Korea, and Southeast Asia, where declining projector prices intersect with heritage-tourism initiatives. South America and Africa lag due to budget constraints and a scarcity of integrators, though World Cup legacy infrastructure in Brazil and archaeological showcases in Egypt hint at future uptake once financing tools mature.
- Panasonic Corporation
- Seiko Epson Corporation
- Barco NV
- Christie Digital Systems USA, Inc.
- BenQ Corporation (Qisda)
- ViewSonic Corporation
- Vivitek (Delta Electronics)
- NEC Display Solutions (Sharp)
- Disguise Technologies Limited
- Dataton AB
- HeavyM (Digital Essence SAS)
- Green Hippo Ltd
- Resolume BV
- Blackmagic Design Pty Ltd
- Avolites Ltd
- GarageCube SA (MadMapper)
- Pixel Rain Digital
- Digital Projection Ltd
- Optoma Europe Limited (Coretronic)
- Sony Corporation
- LG Electronics Inc.
- Lightform Inc.
- Lumitrix s.r.o.
- Vioso GmbH
Additional Benefits:
- The market estimate (ME) sheet in Excel format
- 3 months of analyst support
TABLE OF CONTENTS
1 INTRODUCTION
- 1.1 Study Assumptions and Market Definition
- 1.2 Scope of the Study
2 RESEARCH METHODOLOGY
3 EXECUTIVE SUMMARY
4 MARKET LANDSCAPE
- 4.1 Market Overview
- 4.2 Market Drivers
- 4.2.1 Immersive Advertising and Live-Event Experiences
- 4.2.2 High-Brightness Laser Projectors Adoption
- 4.2.3 Smart-City Landmark Illumination Programs
- 4.2.4 Declining Cost-Per-Lumen from RGB Laser Engines
- 4.2.5 Real-Time Generative-AI Content Workflows
- 4.2.6 XR Stage Demand for Complementary Mapping
- 4.3 Market Restraints
- 4.3.1 High Up-Front Installation and Content Costs
- 4.3.2 Complex Site-Specific Calibration Delays
- 4.3.3 Light-Pollution / Heritage-Facade Regulation
- 4.3.4 Laser-Diode Supply-Chain Volatility
- 4.4 Value Chain Analysis
- 4.5 Technological Outlook
- 4.6 Porter's Five Forces
- 4.6.1 Threat of New Entrants
- 4.6.2 Bargaining Power of Buyers
- 4.6.3 Bargaining Power of Suppliers
- 4.6.4 Threat of Substitutes
- 4.6.5 Degree of Competition
- 4.7 Impact of Macroeconomic Factors
5 MARKET SIZE AND GROWTH FORECASTS (VALUE)
- 5.1 By Offering
- 5.1.1 Hardware
- 5.1.2 Software
- 5.2 By Dimension
- 5.2.1 2D
- 5.2.2 3D
- 5.2.3 4D / Immersive
- 5.3 By Brightness Class (ANSI lm)
- 5.3.1 Less Than 10,000 lm
- 5.3.2 10,000 - 25,000 lm
- 5.3.3 Greater Than 25,000 lm
- 5.4 By Projection Technology
- 5.4.1 DLP
- 5.4.2 LCD
- 5.4.3 LCoS and Others
- 5.5 By Mapping Surface
- 5.5.1 Building Facades
- 5.5.2 Indoor Walls and Floors
- 5.5.3 Objects and Products
- 5.5.4 Water Screens and Natural Terrain
- 5.6 By Application
- 5.6.1 Large Venues and Facades
- 5.6.2 Events and Festivals
- 5.6.3 Theme Parks and Attractions
- 5.6.4 Sports Arenas and Stadiums
- 5.6.5 Cultural and Heritage Sites
- 5.6.6 Commercial Spaces (Retail, Corporate, Education)
- 5.6.7 Other Application
- 5.7 By Geography
- 5.7.1 North America
- 5.7.1.1 United States
- 5.7.1.2 Canada
- 5.7.1.3 Mexico
- 5.7.2 South America
- 5.7.2.1 Brazil
- 5.7.2.2 Argentina
- 5.7.2.3 Rest of South America
- 5.7.3 Europe
- 5.7.3.1 Germany
- 5.7.3.2 France
- 5.7.3.3 United Kingdom
- 5.7.3.4 Italy
- 5.7.3.5 Rest of Europe
- 5.7.4 Asia-Pacific
- 5.7.4.1 China
- 5.7.4.2 Japan
- 5.7.4.3 South Korea
- 5.7.4.4 India
- 5.7.4.5 Rest of Asia-Pacific
- 5.7.5 Middle East
- 5.7.5.1 Saudi Arabia
- 5.7.5.2 United Arab Emirates
- 5.7.5.3 Rest of Middle East
- 5.7.6 Africa
- 5.7.6.1 South Africa
- 5.7.6.2 Egypt
- 5.7.6.3 Rest of Africa
- 5.7.1 North America
6 COMPETITIVE LANDSCAPE
- 6.1 Market Concentration
- 6.2 Strategic Moves
- 6.3 Market Share Analysis
- 6.4 Company Profiles (includes Global-Level Overview, Market-Level Overview, Core Segments, Financials as available, Strategic Information, Market Rank / Share for Key Companies, Products and Services, and Recent Developments)
- 6.4.1 Panasonic Corporation
- 6.4.2 Seiko Epson Corporation
- 6.4.3 Barco NV
- 6.4.4 Christie Digital Systems USA, Inc.
- 6.4.5 BenQ Corporation (Qisda)
- 6.4.6 ViewSonic Corporation
- 6.4.7 Vivitek (Delta Electronics)
- 6.4.8 NEC Display Solutions (Sharp)
- 6.4.9 Disguise Technologies Limited
- 6.4.10 Dataton AB
- 6.4.11 HeavyM (Digital Essence SAS)
- 6.4.12 Green Hippo Ltd
- 6.4.13 Resolume BV
- 6.4.14 Blackmagic Design Pty Ltd
- 6.4.15 Avolites Ltd
- 6.4.16 GarageCube SA (MadMapper)
- 6.4.17 Pixel Rain Digital
- 6.4.18 Digital Projection Ltd
- 6.4.19 Optoma Europe Limited (Coretronic)
- 6.4.20 Sony Corporation
- 6.4.21 LG Electronics Inc.
- 6.4.22 Lightform Inc.
- 6.4.23 Lumitrix s.r.o.
- 6.4.24 Vioso GmbH
7 MARKET OPPORTUNITIES AND FUTURE OUTLOOK
- 7.1 White-Space and Unmet-Need Assessment
 投影映射市場:2026-2032年全球市場預測(按交付方式、類型、技術、安裝方式、內容格式、應用程式和場地設定分類)
 投影映射系統市場:按類型、應用和地區分類
 2026年全球投影映射市場報告
 投影映射市場分析及至2035年預測:按類型、產品類型、服務、技術、組件、應用、部署類型、最終用戶和安裝類型分類
 全球市場規模、佔有率、趨勢和成長分析預測報告(2026-2034年)3D投影映射市場:按產品、安裝類型、投影技術、解析度、應用和最終用戶分類,全球預測(2026-2032年)
 投影映射市場規模、佔有率和成長分析(按產品、尺寸、投影距離、應用和地區分類)-2026-2033年產業預測