


 |
市場調查報告書
商品編碼
2043865
數位化教室:市場佔有率分析、產業趨勢與統計、成長預測(2026-2031)Digital Classroom - Market Share Analysis, Industry Trends & Statistics, Growth Forecasts (2026 - 2031) |
||||||
※ 本網頁內容可能與最新版本有所差異。詳細情況請與我們聯繫。
數位課堂市場預計將從 2025 年的 1,581 億美元成長到 2026 年的 1,777.1 億美元,然後在 2031 年達到 3,188.2 億美元,2026 年至 2031 年的複合年成長率為 12.40%。
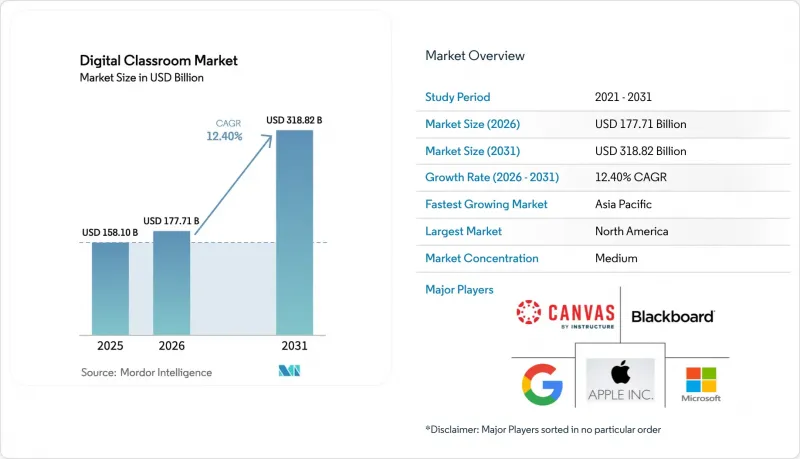
北美在2025年佔據了62.21%的市場佔有率,而亞太地區預計將在2026年至2031年間以17.52%的複合年成長率成長。這一成長主要得益於政府投資以及大規模學習群體對雲端技術的日益普及。教育機構正向以平台為中心的模式轉型,採用雲端原生管治、合規治理和高耐用性設備。 FERPA和GDPR等法規結構正在影響採購流程,重點在於可審計性、身分管理和資料最小化。 Instructure在2024年斥資48億美元進行的收購旨在加強其在數位課堂市場的產品創新並拓展全球業務,這表明行業整合正在加劇。
全球數位化課堂市場趨勢與洞察
寬頻的普及和價格適中的設備的出現,正在擴大數位課堂市場的准入範圍。
由於價格親民、雲端最佳化的設備以及跨地區和跨收入階層網路連接的改善,數位化教室市場正在蓬勃發展。為了確保預算可預測性並避免因設備同時停止支援而造成的教學中斷,學區現在傾向於分階段升級而非一次性購買。谷歌對ChromeOS的擴展支援有助於降低整體擁有成本,同時保持安全性和可管理性。低地球軌道衛星正在擴大偏遠學校的覆蓋範圍,提供適合即時教學和雲端協作的頻寬和低延遲。人工智慧驅動的互動式顯示器透過實現即時協作、轉錄和內容搜尋,增強了互聯教室的功能。不斷提升的連接性和設備可靠性支援混合使用模式,即使在基礎設施受限或維護期間也能確保教學的連續性。這些進步正在將教室轉變為滿足現代教育需求的動態協作環境。
政府對數位化學習的投資正在加速其在整個教育系統中的普及應用。
政府計畫正在加速數位化平台和內容轉型,並支持對數位課堂市場和教師培訓的投資。 2026年1月,美國教育部撥款1.69億美元用於FIPSE津貼,其中5,000萬美元用於旨在改善教學和學習成果的人工智慧舉措。 2025會計年度,關鍵K-12計畫的津貼被重新分配,重點轉向必要的平台和合規服務,同時優先考慮高等教育領域的人工智慧投資。歐盟的《數位教育行動計畫(2027)》著重於數位技能、教師培訓和基礎設施,目標是到2030年使80%的公民具備基本的數位技能。印度的政策得到了預算撥款的支持,以擴大設備、內容和培訓的獲取管道,從而實現新的能力目標。聯合國教科文組織致力於促進全球知識共用,減少重複工作,並支持可擴展的政策和平台模式。
ESSER 計畫結束後,美國 K-12 教育預算大幅資金籌措,限制了對數位學習的持續投資,造成了資金方面的挑戰。
ESSER資金的到期導致學區可支配預算緊張,進而引發了對數位教室輔助工具更新的更多關注。聯邦政府2025會計年度來自Title I、Title II-A和Title IV-B津貼的儲備金總合約70億美元,加速了強制性平台、多年期合約和更嚴格的採購標準的轉變。儘管伊利諾伊州的學區幾乎用完了所有救濟資金,但芝加哥公立學校仍面臨2026會計年度的虧損,迫使其裁員和進行營運重組。 LMS、SIS和身分管理服務等核心系統對於合規性和日常營運至關重要,其穩定性仍然優於可支配合約。疫情期間部署的設備老化加劇了硬體更新周期的壓力,要求分階段更新和更嚴格的生命週期管理。能夠提供可衡量的效率提升、合規性文件和穩健的整合藍圖的供應商,在留住客戶方面更具優勢。
細分市場分析
2025年,數位課堂市場中軟體將佔42.31%的佔有率。這主要得益於雲端學習平台、協作工具以及用於教學和學生管理的分析工具的普及應用。產業正朝著LMS、SIS和ERP系統的整合解決方案轉型,這將減少管理工作並提升分析能力。服務全球2億學習者的Canvas已於2024年轉型為私人公司,旨在加速產品開發並拓展其全球業務。 PowerSchool為超過5000萬名學生提供支持,並展示了整合平台在考勤管理、評估和干涉計劃方面的優勢。這些趨勢凸顯了籌資策略的重要性,這些策略應減少供應商多樣性,優先考慮隱私保護,並為數位教室中的分析和人工智慧奠定基礎。
VR和AR頭顯是成長最快的硬體細分市場,這主要得益於實驗室、醫療和職業訓練中身臨其境型模擬的應用,預計到2031年,其複合年成長率將達到19.56%。內容、課程和評估一致性的提升是推動這一成長的主要因素。互動式顯示器正在發展成為人工智慧驅動的協作中心,具備即時摘要和會議紀要創建等功能。出貨趨勢表明,用戶更傾向於大尺寸設備和共用數位畫布。在數位教室市場,設備策略的重點在於提高可維修性、延長電池壽命和最佳化設備管理,以最大限度地減少停機時間並穩定成本。
數位教室市場按組件(硬體、軟體、服務)、部署模式(雲端、本地部署)、最終用戶(小學、初中、高中、高等教育機構、企業和專業培訓機構、政府和非營利組織)以及地區(北美、南美、亞太、歐洲、中東和非洲)進行細分。市場預測以十億美元為單位。
區域分析
北美地區憑藉先進的IT基礎設施、穩定的平台夥伴關係以及高額的生均技術投入,預計到2025年將佔據數位教室市場62.21%的佔有率。為因應《教育援助和安全緊急救濟法案》(ESSER)的到期,各學區致力於整合關鍵平台和供應商。這增加了轉換成本,有利於那些在合規性和身分整合方面具有優勢的供應商。聯邦政府對高等教育科技的支援仍在繼續,2026年FIPSE津貼將為旨在改善關鍵領域教育和學習的人工智慧舉措提供5000萬美元。 Canvas和PowerSchool在教育和學生營運中繼續發揮核心作用,多年期合約確保了市場的穩定性。監管合規性,例如《家庭教育權利和隱私法案》(FERPA),正在影響供應商的選擇和資料管理,從而推動了對可審計文件和強大隱私控制的需求。
在亞太地區,預計2026年至2031年間,該地區的複合年成長率將達到17.52%,主要得益於各國數位化教育計畫加速了設備、平台和技能的普及應用。印度正致力於在其龐大的學校系統中建立數位化基礎設施和能力,這與國家政策和預算優先事項相符。該地區的市場成長得益於集中採購和日益普及的行動優先學習模式。在中國,集中化的課堂數位化和教育科技領域的協調採購正在重塑國內供應商的市場佔有率和供應鏈。這些措施正在提升設備、內容和分析方面的規模經濟效益,並與人工智慧驅動的學習目標相契合。
在歐洲,現代化進程與嚴格的隱私和安全措施相結合,凸顯了混合架構和歐盟託管服務的必要性。歐盟的數位教育計畫設定了2030年的技能目標,並推動教師培訓和學校能力建設。跨境網路促進了擴充性工具和最佳實踐的共用。歐洲學校網路舉措展示了混合式教師培訓如何透過學校實施分析和自適應學習來改善課堂教學。在偏遠地區,衛星通訊和邊緣服務與光纖網路擴展相輔相成,確保了可靠的接入,並緩解了「最後一公里」的挑戰。這些因素正在推動符合教育需求和監管要求的平台和服務的持續採購。
其他好處:
- Excel格式的市場預測(ME)表
- 3個月的分析師支持
目錄
第1章:引言
- 研究假設和市場定義
- 調查範圍
第2章:調查方法
第3章執行摘要
第4章 市場狀況
- 市場概覽
- 市場促進因素
- 寬頻的普及和價格適中的設備的出現,正在擴大數位課堂市場的准入範圍。
- 政府對數位化學習的投資正在加速其在整個教育系統中的普及應用。
- 雲端原生 LMS 生態系統正在迅速擴展,提供更高的整合性和柔軟性。
- 人工智慧驅動的個人化學習分析正在提高學生的參與度和學習成果。
- 設備即服務 (DaaS) 模式簡化了 K-12 教育機構的採購流程。
- 低地球軌道衛星通訊使得即使在偏遠地區和缺乏足夠教育基礎設施的學校也能實現數位化課堂。
- 市場限制因素
- ESSER 計畫結束後,美國 K-12 教育面臨資金籌措挑戰,限制了對數位學習的持續投資。
- 教師數位技能的差距正在減緩技術在課堂上的有效應用。
- 更嚴格的資料隱私法規增加了教育平台的合規負擔。
- 與電子廢棄物相關的永續性壓力正在使學校的硬體更換週期變得更加複雜。
- 價值/供應鏈分析
- 監理情勢
- 技術展望
- 波特五力模型
- 新進入者的威脅
- 供應商的議價能力
- 買方的議價能力
- 替代品的威脅
- 產業間競爭
第5章 市場規模與成長預測
- 按組件
- 硬體
- 互動式平板顯示器
- 筆記型電腦和 Chromebook
- 藥片
- VR/AR頭顯
- 教室機器人
- 軟體
- 學習管理系統
- 課堂協作工具
- 評估與考試監考平台
- 內容創作和數位課程
- 課室管理軟體
- 服務
- 硬體
- 部署模式
- 雲
- 現場
- 最終用戶
- 小學、國中和高中
- 高等教育
- 企業和專業培訓
- 政府和非營利組織
- 按地區
- 北美洲
- 加拿大
- 美國
- 墨西哥
- 南美洲
- 巴西
- 秘魯
- 智利
- 阿根廷
- 南美洲其他地區
- 亞太地區
- 印度
- 中國
- 日本
- 澳洲
- 韓國
- 東南亞(新加坡、馬來西亞、泰國、印尼、越南、菲律賓)
- 亞太其他地區
- 歐洲
- 英國
- 德國
- 法國
- 西班牙
- 義大利
- 比荷盧經濟聯盟(比利時、荷蘭、盧森堡)
- 北歐國家(丹麥、芬蘭、冰島、挪威、瑞典)
- 其他歐洲地區
- 中東和非洲
- 阿拉伯聯合大公國
- 沙烏地阿拉伯
- 南非
- 奈及利亞
- 其他中東和非洲地區
- 北美洲
第6章 競爭情勢
- 市場集中度
- 策略趨勢
- 市佔率分析
- 公司簡介
- Google LLC
- Microsoft Corporation
- Apple Inc.
- Instructure Inc.(Canvas)
- Blackboard Inc.
- D2L Corporation(Brightspace)
- Zoom Video Communications
- Lenovo Group Ltd.
- HP Inc.
- Dell Technologies Inc.
- Acer Inc.
- ViewSonic Corporation
- SMART Technologies ULC
- Promethean World Ltd.
- Samsung Electronics Co. Ltd.
- LG Electronics Inc.
- Panasonic Corporation
- Pearson plc
- BYJU'S
- Coursera Inc.
- Kahoot!ASA
- Edmodo LLC
- Nearpod Inc.
- ClassIn(Eeo Technology)*
第7章 市場機會與未來展望
The digital classroom market size is expected to grow from USD 158.1 billion in 2025 to USD 177.71 billion in 2026 and is forecast to reach USD 318.82 billion by 2031 at a 12.40% CAGR over 2026-2031.
North America accounted for a 62.21% market share in 2025, while Asia-Pacific is expected to grow at a 17.52% CAGR from 2026 to 2031. Growth is driven by government investments and increased cloud adoption among large learner populations. Institutions are adopting cloud-native platforms, compliance-ready governance, and durable devices, shifting to platform-centric models. Regulatory frameworks like FERPA and GDPR influence procurement, emphasizing auditability, identity management, and data minimization. Consolidation is evident with Instructure's USD 4.8 billion acquisition in 2024, aimed at enhancing product innovation and scaling global operations in the digital classroom market.
Global Digital Classroom Market Trends and Insights
Broadband expansion and affordable devices are widening access to the Digital Classroom Market
The digital classroom market is growing due to affordable, cloud-optimized devices and improved connectivity across regions and income levels. Districts now prefer rolling refresh schedules over bulk purchases to ensure predictable budgeting and avoid disruptions caused by simultaneous device end-of-life events. Google's extended ChromeOS support helps reduce total ownership costs while maintaining security and manageability. Low Earth orbit satellites are expanding coverage to remote schools, offering bandwidth and latency suitable for real-time instruction and cloud collaboration. Interactive displays with AI features enable live collaboration, transcription, and content search, enhancing the functionality of connected classrooms. Improved connectivity and device reliability support hybrid usage models, ensuring continuity even during infrastructure limitations or maintenance. These advancements are transforming classrooms into dynamic, collaborative environments that meet modern educational needs.
Government investment in digital learning is accelerating adoption across education systems
Government programs are accelerating the shift to digital platforms and content, supporting investments and teacher training in the digital classroom market. The United States Department of Education allocated USD 169 million in FIPSE awards in January 2026, with USD 50 million directed toward AI initiatives to improve instruction and outcomes. FY25 grant withholdings in key K-12 programs redirected focus to essential platforms and compliance services, while higher education investments prioritized AI. The European Union's Digital Education Action Plan (2027) targets digital skills, educator training, and infrastructure, aiming for 80% of citizens to achieve basic digital skills by 2030. India's policies, backed by budget allocations, expand access to devices, content, and training aligned with new competency goals. UNESCO's initiatives promote global knowledge-sharing, reducing duplication, and supporting scalable policy and platform models.
Funding challenges from the post-ESSER budget cliff in the United States K-12 are limiting sustained investment in digital learning
The expiration of ESSER funding tightened discretionary budgets for districts, increasing scrutiny on renewing supplemental tools in the digital classroom market. Federal withholdings from Title I-C, Title II-A, and Title IV-B grants in FY25 totaled nearly USD 7 billion, driving a shift toward essential platforms, multi-year contracts, and stricter procurement criteria. Illinois districts reported nearly full utilization of relief funds, while Chicago Public Schools faced a 2026 budget deficit, leading to staffing cuts and operational changes. Core systems like LMS, SIS, and identity services, critical for compliance and daily operations, remain more resilient than discretionary contracts. Aging pandemic-era devices add pressure on hardware replacement cycles, prompting rolling refreshes and stricter lifecycle management. Vendors offering measurable efficiency gains, compliance documentation, and stable integration roadmaps are better positioned to retain accounts.
Other drivers and restraints analyzed in the detailed report include:
- Cloud-native LMS ecosystems are scaling rapidly, enhancing integration and flexibility
- AI-driven personalized learning analytics are improving engagement and learning outcomes
- The digital-skills gap among teachers is slowing the effective integration of classroom technologies
For complete list of drivers and restraints, kindly check the Table Of Contents.
Segment Analysis
Software accounted for 42.31% of the digital classroom market share in 2025, driven by the adoption of cloud learning platforms, collaboration tools, and analytics for managing instruction and student operations. The industry has shifted to integrated solutions combining LMS, SIS, and ERP systems, reducing administrative tasks and improving analytics. Canvas, serving 200 million learners globally, transitioned to private ownership in 2024 to accelerate product development and expand its global reach. PowerSchool supports over 50 million students, showcasing the benefits of a unified platform for attendance, assessment, and intervention planning. These trends emphasize procurement strategies that reduce vendor diversity, prioritize privacy, and establish a foundation for analytics and AI in digital classrooms.
VR and AR headsets are the fastest-growing hardware subsegment, with a projected 19.56% CAGR through 2031, driven by immersive simulations in labs, healthcare, and vocational training. Improved alignment between content, curriculum, and assessment supports this growth. Interactive displays are evolving into AI-enabled collaboration hubs with features like real-time summarization and transcript capture. Shipment trends indicate a preference for larger formats and shared digital canvases. Device strategies now focus on repairability, extended battery life, and fleet management to minimize downtime and stabilize costs in the digital classroom market.
The Digital Classroom Market is Segmented by Components (hardware, Software, Services), Deployment Mode (cloud, On-Premises), End User (K-12 Schools, Higher Education, Corporate and Professional Training, Government and Non-Profit), and Geography (North America, South America, Asia-Pacific, Europe, Middle East and Africa). Market Forecasts are Provided in Terms of USD Billion.
Geography Analysis
North America held a 62.21% share of the digital classroom market in 2025, supported by advanced IT infrastructure, stable platform partnerships, and high per-student technology investments. Districts addressed the ESSER expiration by focusing on essential platforms and vendor consolidation, which increased switching costs and benefited providers with strong compliance and identity integrations. Federal support for higher education technology continues, with FIPSE grants in 2026 allocating USD 50 million to AI initiatives aimed at improving teaching and learning in key disciplines. Canvas and PowerSchool remain central to instruction and student operations, with multi-year agreements ensuring market stability. Regulatory compliance, such as FERPA, influences vendor selection and data management, driving demand for audit-ready documentation and robust privacy controls.
Asia-Pacific is expected to grow at a 17.52% CAGR from 2026 to 2031, driven by national digital education plans that accelerate the adoption of devices, platforms, and skills. India emphasizes digital infrastructure and competency-building across its extensive school systems, aligning with national policy and budget priorities. The region's market growth is supported by centralized procurement and increasing mobile-first learning behaviors. In China, centralized classroom digitization and coordinated procurement in education technology are shaping domestic vendor shares and supply chains. These efforts enhance scale effects in devices, content, and analytics, aligning with AI-enabled learning objectives.
Europe combines modernization with strict privacy and security enforcement, emphasizing hybrid architecture and European Union-hosted services. The European Union's Digital Education Plan sets 2030 skill targets and promotes teacher training and school capacity building. Cross-border networks facilitate the sharing of scalable tools and practices. European School net initiatives demonstrate how hybrid professional development enhances classroom practices as schools adopt analytics and adaptive learning. In remote areas, satellite and edge services complement fiber expansions, ensuring consistent access and mitigating last-mile challenges. These factors drive steady procurement of platforms and services aligned with instructional and regulatory needs.
- Google LLC
- Microsoft Corporation
- Apple Inc.
- Instructure Inc. (Canvas)
- Blackboard Inc.
- D2L Corporation (Brightspace)
- Zoom Video Communications
- Lenovo Group Ltd.
- HP Inc.
- Dell Technologies Inc.
- Acer Inc.
- ViewSonic Corporation
- SMART Technologies ULC
- Promethean World Ltd.
- Samsung Electronics Co. Ltd.
- LG Electronics Inc.
- Panasonic Corporation
- Pearson plc
- BYJU'S
- Coursera Inc.
- Kahoot! ASA
- Edmodo LLC
- Nearpod Inc.
- ClassIn (Eeo Technology)*
Additional Benefits:
- The market estimate (ME) sheet in Excel format
- 3 months of analyst support
TABLE OF CONTENTS
1 Introduction
- 1.1 Study Assumptions & Market Definition
- 1.2 Scope of the Study
2 Research Methodology
3 Executive Summary
4 Market Landscape
- 4.1 Market Overview
- 4.2 Market Drivers
- 4.2.1 Broadband expansion and affordable devices are widening access to the Digital Classroom Market
- 4.2.2 Government investment in digital learning is accelerating adoption across education systems
- 4.2.3 Cloud-native LMS ecosystems are scaling rapidly, enhancing integration and flexibility
- 4.2.4 AI-driven personalized learning analytics are improving engagement and learning outcomes
- 4.2.5 Device-as-a-Service models are simplifying procurement for K-12 institutions
- 4.2.6 Low-orbit satellite connectivity is enabling digital classrooms in remote and underserved schools
- 4.3 Market Restraints
- 4.3.1 Funding challenges from the post-ESSER budget cliff in the United States K-12 are limiting sustained investment in digital learning
- 4.3.2 The digital-skills gap among teachers is slowing the effective integration of classroom technologies
- 4.3.3 Stricter data-privacy regulations are adding compliance burdens for education platforms
- 4.3.4 Sustainability pressures tied to e-waste are complicating hardware refresh cycles in schools
- 4.4 Value / Supply-Chain Analysis
- 4.5 Regulatory Landscape
- 4.6 Technological Outlook
- 4.7 Porter's Five Forces
- 4.7.1 Threat of New Entrants
- 4.7.2 Bargaining Power of Suppliers
- 4.7.3 Bargaining Power of Buyers
- 4.7.4 Threat of Substitutes
- 4.7.5 Industry Rivalry
5 Market Size & Growth Forecasts
- 5.1 By Component (Value)
- 5.1.1 Hardware
- 5.1.1.1 Interactive Flat-Panel Displays
- 5.1.1.2 Laptops and Chromebooks
- 5.1.1.3 Tablets
- 5.1.1.4 VR/AR Headsets
- 5.1.1.5 Classroom Robotics
- 5.1.2 Software
- 5.1.2.1 Learning Management Systems
- 5.1.2.2 Classroom Collaboration Tools
- 5.1.2.3 Assessment and Proctoring Platforms
- 5.1.2.4 Content Authoring and Digital Curriculum
- 5.1.2.5 Classroom Management Software
- 5.1.3 Services
- 5.1.1 Hardware
- 5.2 By Deployment Mode
- 5.2.1 Cloud
- 5.2.2 On-premise
- 5.3 By End-user
- 5.3.1 K-12 Schools
- 5.3.2 Higher Education
- 5.3.3 Corporate and Professional Training
- 5.3.4 Government and Non-profit
- 5.4 By Geography
- 5.4.1 North America
- 5.4.1.1 Canada
- 5.4.1.2 United States
- 5.4.1.3 Mexico
- 5.4.2 South America
- 5.4.2.1 Brazil
- 5.4.2.2 Peru
- 5.4.2.3 Chile
- 5.4.2.4 Argentina
- 5.4.2.5 Rest of South America
- 5.4.3 Asia-Pacific
- 5.4.3.1 India
- 5.4.3.2 China
- 5.4.3.3 Japan
- 5.4.3.4 Australia
- 5.4.3.5 South Korea
- 5.4.3.6 South East Asia (Singapore, Malaysia, Thailand, Indonesia, Vietnam, and Philippines)
- 5.4.3.7 Rest of Asia-Pacific
- 5.4.4 Europe
- 5.4.4.1 United Kingdom
- 5.4.4.2 Germany
- 5.4.4.3 France
- 5.4.4.4 Spain
- 5.4.4.5 Italy
- 5.4.4.6 BENELUX (Belgium, Netherlands, and Luxembourg)
- 5.4.4.7 NORDICS (Denmark, Finland, Iceland, Norway, and Sweden)
- 5.4.4.8 Rest of Europe
- 5.4.5 Middle East And Africa
- 5.4.5.1 United Arab of Emirates
- 5.4.5.2 Saudi Arabia
- 5.4.5.3 South Africa
- 5.4.5.4 Nigeria
- 5.4.5.5 Rest of Middle East And Africa
- 5.4.1 North America
6 Competitive Landscape
- 6.1 Market Concentration
- 6.2 Strategic Moves
- 6.3 Market Share Analysis
- 6.4 Company Profiles (includes Global level Overview, Market level overview, Core Segments, Financials as available, Strategic Information, Market Rank/Share for key companies, Products & Services, and Recent Developments)
- 6.4.1 Google LLC
- 6.4.2 Microsoft Corporation
- 6.4.3 Apple Inc.
- 6.4.4 Instructure Inc. (Canvas)
- 6.4.5 Blackboard Inc.
- 6.4.6 D2L Corporation (Brightspace)
- 6.4.7 Zoom Video Communications
- 6.4.8 Lenovo Group Ltd.
- 6.4.9 HP Inc.
- 6.4.10 Dell Technologies Inc.
- 6.4.11 Acer Inc.
- 6.4.12 ViewSonic Corporation
- 6.4.13 SMART Technologies ULC
- 6.4.14 Promethean World Ltd.
- 6.4.15 Samsung Electronics Co. Ltd.
- 6.4.16 LG Electronics Inc.
- 6.4.17 Panasonic Corporation
- 6.4.18 Pearson plc
- 6.4.19 BYJU'S
- 6.4.20 Coursera Inc.
- 6.4.21 Kahoot! ASA
- 6.4.22 Edmodo LLC
- 6.4.23 Nearpod Inc.
- 6.4.24 ClassIn (Eeo Technology)*
7 Market Opportunities & Future Outlook
- 7.1 White-space & Unmet-need Assessment


