


 |
市場調查報告書
商品編碼
2043828
稀土元素:市場佔有率分析、產業趨勢與統計、成長預測(2026-2031)Rare Earth Elements - Market Share Analysis, Industry Trends & Statistics, Growth Forecasts (2026 - 2031) |
||||||

※ 本網頁內容可能與最新版本有所差異。詳細情況請與我們聯繫。
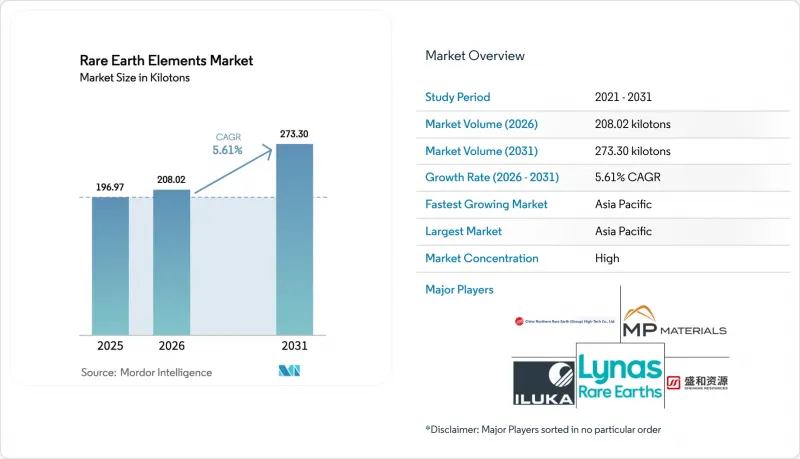
預計到 2025 年,稀土元素市場將達到 196.97 千噸,到 2026 年將達到 208.02 千噸,到 2031 年將達到 273.30 千噸,2026 年至 2031 年的複合年成長率為 5.61%。
此次擴張主要受電動車牽引馬達、離岸風力發電機和電網級清潔能源基礎設施等相關結構性需求的驅動,但加工瓶頸和政策驅動的供應衝擊正在減緩成長。儘管對鏑和鋱替代品的研究面臨技術限制,但工業自動化的持續普及、航太領域積層製造技術的應用以及日益嚴格的全球排放標準正在推動進一步的需求。在供應方面,對中國在採礦和分離方面的過度依賴加劇了價格波動,導致策略性囤積和多年期現貨供應協議的出現。這些措施雖然穩定了短期供應,但也推高了採購成本。歐美生產商之間日益增強的垂直整合,以及美國、澳洲和歐盟政府的獎勵,預示著中游生產能力將向區域化方向發展,這將逐步重塑稀土元素市場格局,直至2031年。
全球稀土元素市場趨勢及洞察
可再生能源對渦輪磁鐵的需求
釹鐵硼磁鐵因其優異的重量功率比,在直驅風力發電機和電池式電動車中備受青睞,是鐵氧體磁體的理想選擇。預計磁鐵對稀土元素的需求將顯著成長,主要驅動力來自風力發電和交通運輸行業。每台3兆瓦離岸風力發電機都需要使用釹、镨和鏑,而全球離岸風力發電產業正經歷強勁的成長。電動車的發展勢頭不可阻擋,預計未來幾年其出貨量將大幅成長。然而,鏑的供應仍面臨挑戰,目前絕大多數鏑來自中國的離子黏土礦床。此外,儘管人們正在積極尋找替代品,但在不影響熱穩定性的前提下,很難將鏑含量降低到閾值以下。這種對磁鐵的強勁需求將鞏固稀土元素在2031年之前的市場地位。
綠色科技對稀土元素的依賴
脫碳政策正將稀土元素融入能源轉型的基礎中。從為氫燃料電池提供動力的氧化鈰催化劑到為固體照明提供照明的釔磷光體,這些元素都發揮著至關重要的作用。儘管歐盟的「Fit for 55」舉措和美國的「通膨控制法案」都在促進國內採購,但它們並未充分解決加工能力不足的問題。鎳氫電池對鑭的需求已經趨於穩定。然而,隨著新興市場排放法規的日益嚴格,汽車催化劑對氧化鈰的需求仍然強勁。這其中蘊含著戰略風險,因為潔淨科技的應用速度可能超過中國以外地區產能的擴張速度,使汽車製造商容易受到集中式供應鏈的限制。
中國政策導致價格波動
2025年10月,中國政府擴大了出口限制並推出了含量標準。這些新規要求下游製造商對其成品中所含所有稀土元素的來源進行認證。受此影響,歐洲進口商面臨氧化鏑價格飆升,渦輪機原始設備製造商被迫緊急重新談判供應合約。這些限制措施被暫時中止至2026年11月,開創了先例。此後,許多廠商以溢價簽署了多年期承購契約,凸顯了稀土元素市場對中國政策變化的極度敏感性。
細分市場分析
預計到2025年,輕稀土元素將佔總產量的87.18%,並在2031年之前以5.92%的複合年成長率成長。氧化鈰是汽車催化劑的關鍵成分,在歐7和國六排放標準的日益嚴格推動下,其需求保持穩定。鑭是鎳氫電池的必需元素,預計其每年消費量也將保持穩定。同時,釹和镨的產量成長主要受磁鐵需求驅動。重稀土元素雖然在總產量中所佔比例較小,但價格卻很高。這主要是由於鏑、鋱和釔缺乏可規模化生產的替代品,限制了其供應。鏑是成長最快的元素,預計其複合年成長率將達到7.26%,主要得益於電動車和離岸風力發電機高溫磁鐵的需求。
中國在稀土供應領域的主導地位加劇了價格敏感度。江西和廣西壯族自治區的離子黏土礦床佔據了全球鏑產量的大部分,使西方原始設備製造商面臨政策風險。澳洲的布朗斯嶺(Brown's Range)和諾蘭斯(Nolans)等專案為供應來源多元化帶來了一線希望,但在獲得許可和資金籌措方面仍面臨挑戰。因此,能夠供應單一重稀土元素氧化物的生產商仍擁有強大的定價權,鞏固了稀土元素市場的溢價結構。
鈰主要應用於觸媒轉換器和玻璃拋光領域,預計2025年將佔據元素金屬市場38.16%的佔有率,並在2031年之前保持其銷量領先地位。預測顯示,鈰的主導地位將持續到2031年。釹和镨合計佔據較大的市場佔有率,並在中國、日本和美國的永久磁鐵生產中發揮至關重要的作用。鑭主要用於流體分解催化劑和鎳氫電池。鏑的市佔率較小,單價較高,年複合成長率為7.26%。這表明鏑極為重要,尤其是在製造用於電動車驅動馬達和風力發電機的高溫磁鐵方面。鋱和釔的市佔率較少(鋱用於綠色磷光體,釔用於陶瓷和LED),且都面臨類似的供應限制。
由於年產量有限,鈧在市場上每公斤價格最高,這反映了其稀缺性以及從各種產品中回收鈧的難度。然而,隨著加拿大和美國的回收設施投入運作,鈧的應用範圍可能會從客艙支架擴展到更大的航太結構部件,從而有可能提高其在稀土元素市場的佔有率。
《稀土元素市場報告》依產品類型(輕稀土元素和重稀土元素)、元素(鈰、釹、鋱、鏑、铽、釔、鈧及其他元素)、應用(催化劑、陶瓷等)、終端用戶產業(清潔能源、家用電子電器等)及地區(亞太地區、北美、歐洲等)進行細分。市場預測以噸為單位。
區域分析
截至2025年,亞太地區將佔全球產量的86.29%,預計2031年將維持其主導地位,年複合成長率為5.97%。中國生產氧化物,並擁有大部分分離產能。這種主導地位使中國能夠利用出口限制,導致2025年10月起歐洲鏑價格大幅上漲。澳洲正在成為中國以外的主要供應國。 Arafura公司的Nolans專案計劃在2027年之前生產釹镨氧化物。同時,Ilka Resources公司正在建造一座用於生產混合碳酸鹽的精煉廠。為了降低對外國的依賴,日本和韓國分別與Linus公司和MP Materials公司簽訂了多年協議。
在北美,供應鏈本地化正穩步推進。芒廷帕斯(Mountain Pass)於2024年開始生產濃縮鈾,並在2025年第三季停止對中國的出口,將其原料轉運至加州的一家分離廠。重質土壤選礦廠計畫於2026年中期投產,該計畫獲得了美國國防部的大量資金支持。能源燃料公司(Energy Fuels)位於懷特梅薩(White Mesa)的冶煉廠先前專注於鈾礦生產,現已轉型加工獨居石。同時,U-Core公司正在阿拉斯加建造RapidSX工廠。
儘管歐洲在2025年將展現出顯著的市場佔有率,但仍高度依賴進口。這主要是由於《基本原料法》設定了2030年採礦、加工和回收的宏偉目標。 LKAB公司的Per Geijer礦床擁有龐大的氧化物蘊藏量,但其開發仍需10年時間。 Cyclic Materials和Urban Mining Company的試點回收計畫旨在解決此短缺問題,但該地區缺乏任何商業規模的分離設施。南美洲和中東/非洲地區加起來僅佔總量的一小部分。然而,巴西和南非正著眼於2030年後可能達到的潛在產能。
其他好處:
- Excel格式的市場預測(ME)表
- 3個月的分析師支持
目錄
第1章:引言
- 研究假設和市場定義
- 調查範圍
第2章:調查方法
第3章執行摘要
第4章 市場狀況
- 市場概覽
- 市場促進因素
- 可再生能源渦輪磁鐵的要求
- 「綠色技術」對稀土元素的依賴程度
- 電池應用需求不斷成長
- 航太製造中鈧鋁合金的應用
- 家用電子電器需求旺盛
- 市場限制因素
- 中國政策導致的價格波動
- 中國政策轉變導致價格波動
- 稀土元素供應不穩定
- 價值鏈分析
- 波特五力模型
- 供應商的議價能力
- 消費者議價能力
- 新進入者的威脅
- 替代品的威脅
- 競爭程度
- 供應分析
- 監理政策分析
- 貿易分析
- 價格趨勢分析
- 生產成本分析
第5章 市場規模及成長預測(數量)
- 依產品類型
- 輕稀土元素
- 重稀土元素
- 按元素
- 鈰
- 氧化物
- 硫化物
- 其他化合物
- 釹
- 合金
- 鑭
- 合金
- 氧化物
- 其他化合物
- 鎝
- 鋱
- 釔
- 鈧
- 其他元素(例如釷和釤)
- 鈰
- 透過使用
- 催化劑
- 陶瓷
- 磷光體
- 玻璃和拋光
- 冶金
- 磁鐵
- 其他用途(例如空氣淨化)
- 按最終用途行業分類
- 清潔能源
- 家用電子產品
- 航太/國防
- 工業自動化
- 衛生保健
- 其他終端用戶產業(冶金、農業等)
- 按地區
- 亞太地區
- 中國
- 印度
- 日本
- 韓國
- 澳洲
- 亞太其他地區
- 北美洲
- 美國
- 加拿大
- 墨西哥
- 歐洲
- 德國
- 英國
- 法國
- 義大利
- 北歐國家
- 其他歐洲地區
- 南美洲
- 巴西
- 阿根廷
- 南美洲其他地區
- 中東和非洲
- 沙烏地阿拉伯
- 阿拉伯聯合大公國
- 南非
- 其他中東和非洲
- 亞太地區
第6章 競爭情勢
- 市場集中度
- 策略趨勢
- 市佔率(%)/排名分析
- 公司簡介
- Appia REU
- Arafura Rare Earths
- China Rare Earth Group Resources Technology Co., Ltd.
- China Rare Earth Holdings Limited
- ChinaTungsten
- Energy Fuels Inc.
- Iluka Resources Limited
- Jiangxi Copper Corporation
- Lynas Rare Earths Ltd
- Mitsubishi Corporation RtM Japan Ltd.
- MP Materials
- Northern Minerals
- Northern Rare Earth
- Rio Tinto
- Shenghe Resources Holding Co., Ltd.
- Texas Mineral Resources Corp.
- Ucore Rare Metals Inc.
- Yuyan Rare Earth New Materials Co., Ltd.
第7章 市場機會與未來展望
The Rare Earth Elements Market size is projected to be 196.97 kilotons in 2025, 208.02 kilotons in 2026, and reach 273.30 kilotons by 2031, growing at a CAGR of 5.61% from 2026 to 2031.
Structural demand tied to electric-vehicle traction motors, offshore wind turbines, and grid-scale clean-energy infrastructure underpins this expansion, while lingering processing bottlenecks and policy-induced supply shocks temper the growth trajectory. Ongoing industrial automation roll-outs, additive-manufacturing adoption in aerospace, and tightening global emission standards provide additional demand pull, even as substitution research for dysprosium and terbium remains technically constrained. On the supply side, heavy reliance on China for both mining and separation amplifies price volatility, prompting strategic stockpiling and multi-year offtake agreements that stabilize short-term volumes but inflate procurement costs. Intensifying vertical integration among Western producers, alongside government incentives in the United States, Australia, and the European Union, signals a shift toward regionalized midstream capacity that will progressively reshape the Rare Earth Elements market through 2031.
Global Rare Earth Elements Market Trends and Insights
Renewable-Energy Turbine Magnet Requirement
Neodymium-iron-boron magnets, favored by direct-drive wind turbines and battery-electric vehicles, offer unparalleled weight-to-power ratios compared to ferrite alternatives. Demand for magnet-grade rare earths is expected to grow significantly, predominantly driven by wind energy and mobility sectors. Each 3 MW offshore turbine incorporates neodymium-praseodymium and dysprosium, with global offshore installations experiencing substantial growth. The momentum in electric vehicles is undeniable, with shipments projected to increase significantly in the coming years. However, dysprosium supply poses a challenge, with a staggering majority sourced from China's ionic-clay deposits. Moreover, while efforts to find substitutes are ongoing, they've struggled to dip below a content threshold without jeopardizing thermal stability. This robust demand for magnets solidifies the position of the Rare Earth Elements market through 2031.
Dependency of Green Technology on Rare Earth Elements
Decarbonization policies are weaving rare earth elements into the fabric of the energy transition. From cerium oxide catalysts powering hydrogen fuel cells to yttrium phosphors illuminating solid-state lighting, these elements play a pivotal role. While the European Union's 'Fit for 55' initiative and the U.S. 'Inflation Reduction Act' champion domestic sourcing, they fall short in addressing the processing gap. Demand for lanthanum in nickel-metal-hydride batteries has eased. However, as emission norms tighten in emerging markets, demand for cerium oxide in automotive catalysts remains steady. This presents a strategic risk: the pace of clean-tech adoption might outstrip the growth of non-Chinese capacities, potentially leaving OEMs vulnerable to a concentrated supply chain.
Chinese Policy-Induced Price Volatility
In October 2025, Beijing expanded its export controls, introducing a content threshold. This new rule mandates that downstream producers certify the source of every rare earth atom in their finished goods. As a result, European importers witnessed a dramatic surge in dysprosium oxide prices, compelling turbine OEMs to scramble and renegotiate their supply contracts. While these controls faced a suspension until November 2026, the move set a precedent. It led to multi-year offtake deals being struck at premiums, underscoring the Rare Earth Elements market's heightened sensitivity to shifts in Chinese policy.
Other drivers and restraints analyzed in the detailed report include:
- Growing Demand from Battery Applications
- Scandium-Aluminum Alloys in Aerospace Manufacturing
- Inconsistent Supply of Rare Earth Elements
For complete list of drivers and restraints, kindly check the Table Of Contents.
Segment Analysis
Light rare earths captured 87.18% of volume in 2025 and are set to grow at a 5.92% CAGR through 2031. Cerium oxide, a key player in automotive catalysts, maintains a stable demand, bolstered by tightening Euro 7 and China VI standards. Lanthanum, essential for nickel-metal-hydride batteries, sees consistent consumption yearly. Meanwhile, neodymium-praseodymium production has exemplified the magnet-driven demand. Although heavy rare earths make up a smaller portion of the volume, they command premium prices. This is largely due to dysprosium, terbium, and yttrium's lack of scalable substitutes and their constrained supply. Dysprosium, the fastest-growing element, will track a 7.26% CAGR on the back of high-temperature magnet demand for EVs and offshore turbines.
China's dominance in supply heightens price sensitivity. Ionic-clay deposits in Jiangxi and Guangxi provinces produce a significant portion of the world's dysprosium, putting Western OEMs at risk of policy shocks. While Australian projects like Browns Range and Nolans offer a glimmer of diversification, they grapple with lengthy permitting and financing challenges. Consequently, producers capable of delivering separated heavy oxides retain significant pricing power, solidifying the premium structure in the Rare Earth Elements market.
Cerium commanded 38.16% of the elemental share in 2025, driven by catalytic-converter and glass-polishing uses, and will remain volume leader through 2031. Forecasts indicate cerium will maintain its leadership position through 2031. Neodymium and praseodymium, together accounting for a significant portion of the market, play pivotal roles in the production of permanent magnets across China, Japan, and the U.S. Lanthanum finds its primary applications in fluid-cracking catalysts and nickel-metal-hydride batteries. Dysprosium, despite constituting a smaller share of the market, enjoys a high unit value and a 7.26% CAGR. This underscores dysprosium's critical importance in formulating high-temperature magnets, especially for electric vehicle traction motors and wind turbines. Terbium and yttrium, while occupying smaller market niches-terbium in green phosphors and yttrium in ceramics and LEDs-both grapple with similar supply constraints.
Scandium, with limited annual production, commands the highest price per kilogram in the market, a testament to its rarity and challenges in byproduct recovery. However, should recovery circuits in Canada and the U.S. become operational, scandium's applications could broaden from cabin brackets to encompass larger aerospace structural components, potentially expanding its presence in the Rare Earth Elements market.
The Rare Earth Elements Market Report is Segmented by Product Type (Light and Heavy), Element (Cerium, Neodymium, Lanthanum, Dysprosium, Terbium, Yttrium, Scandium, and Other Elements), Application (Catalysts, Ceramics, and More), End-Use Industry (Clean Energy, Consumer Electronics, and More), and Geography (Asia-Pacific, North America, Europe, and More). Market Forecasts are Provided in Terms of Volume (Tons).
Geography Analysis
Asia-Pacific accounted for 86.29% of global volume in 2025 and will maintain dominance with a 5.97% CAGR to 2031. China produced oxides and commanded the majority of the separation capacity. This dominance allowed China to exert export-control leverage, causing European dysprosium prices to surge significantly post-October 2025. Australia is positioning itself as the leading non-Chinese supplier. Arafura's Nolans project aims to produce neodymium-praseodymium oxide by 2027. Concurrently, Iluka Resources is progressing with a refinery targeting mixed-carbonate output. To mitigate their reliance, Japan and South Korea have inked multi-year contracts with Lynas and MP Materials.
North America is making strides to localize its supply. Mountain Pass, having produced concentrate in 2024, halted exports to China in Q3 2025, redirecting its feed to a separation plant in California. A significant equity stake from the Department of Defense is backing a heavy-earth circuit, targeting output by mid-2026. Energy Fuels' White Mesa mill, traditionally focused on uranium, pivoted to process monazite. Meanwhile, Ucore is in the process of establishing a RapidSX plant in Alaska.
Despite its market presence in 2025, Europe remains heavily reliant on imports. This is in light of the Critical Raw Materials Act, which sets ambitious targets for extraction, processing, and recycling by 2030. While LKAB's Per Geijer deposit boasts significant oxide reserves, its development is a decade away. Pilot recycling initiatives from Cyclic Materials and Urban Mining Company seek to address the shortfall, yet the region lacks any commercial-scale separator. Both South America and the Middle East-Africa regions combined accounted for a minimal share of the total volume. However, Brazil and South Africa are eyeing potential capacities that could materialize post-2030.
- Appia REU
- Arafura Rare Earths
- China Rare Earth Group Resources Technology Co., Ltd.
- China Rare Earth Holdings Limited
- ChinaTungsten
- Energy Fuels Inc.
- Iluka Resources Limited
- Jiangxi Copper Corporation
- Lynas Rare Earths Ltd
- Mitsubishi Corporation RtM Japan Ltd.
- MP Materials
- Northern Minerals
- Northern Rare Earth
- Rio Tinto
- Shenghe Resources Holding Co., Ltd.
- Texas Mineral Resources Corp.
- Ucore Rare Metals Inc.
- Yuyan Rare Earth New Materials Co., Ltd.
Additional Benefits:
- The market estimate (ME) sheet in Excel format
- 3 months of analyst support
TABLE OF CONTENTS
1 Introduction
- 1.1 Study Assumptions and Market Definition
- 1.2 Scope of the Study
2 Research Methodology
3 Executive Summary
4 Market Landscape
- 4.1 Market Overview
- 4.2 Market Drivers
- 4.2.1 Renewable-Energy Turbine Magnet Requirement
- 4.2.2 Dependency of 'Green Technology' on Rare Earth Elements
- 4.2.3 Growing demand from battery applications
- 4.2.4 Scandium-Aluminum Alloys Adoption in Aerospace Manufacturing
- 4.2.5 High Demand in Consumer Electronics
- 4.3 Market Restraints
- 4.3.1 Chinese Policy-Induced Price Volatility
- 4.3.2 Price Volatility Linked to Chinese Policy Shifts
- 4.3.3 Inconsistent Supply of Rare Earth Elements
- 4.4 Value Chain Analysis
- 4.5 Porter's Five Forces
- 4.5.1 Bargaining Power of Suppliers
- 4.5.2 Bargaining Power of Consumers
- 4.5.3 Threat of New Entrants
- 4.5.4 Threat of Substitutes
- 4.5.5 Degree of Competition
- 4.6 Supply Analysis
- 4.7 Regulatory Policy Analysis
- 4.8 Trade Analysis
- 4.9 Price Trend Analysis
- 4.10 Production Cost Analysis
5 Market Size and Growth Forecasts ( Volume)
- 5.1 By Product Type
- 5.1.1 Light Rare Earth Elements
- 5.1.2 Heavy Rare Earth Elements
- 5.2 By Element
- 5.2.1 Cerium
- 5.2.1.1 Oxide
- 5.2.1.2 Sulfide
- 5.2.1.3 Other Compounds
- 5.2.2 Neodymium
- 5.2.2.1 Alloy
- 5.2.3 Lanthanum
- 5.2.3.1 Alloy
- 5.2.3.2 Oxide
- 5.2.3.3 Other Compounds
- 5.2.4 Dysprosium
- 5.2.5 Terbium
- 5.2.6 Yttrium
- 5.2.7 Scandium
- 5.2.8 Other Elements (Promethium, Samarium, etc.)
- 5.2.1 Cerium
- 5.3 By Application
- 5.3.1 Catalysts
- 5.3.2 Ceramics
- 5.3.3 Phosphors
- 5.3.4 Glass and Polishing
- 5.3.5 Metallurgy
- 5.3.6 Magnets
- 5.3.7 Other Applications (Air Cleaning, etc.)
- 5.4 By End-use Industry
- 5.4.1 Clean Energy
- 5.4.2 Consumer Electronics
- 5.4.3 Aerospace and Defense
- 5.4.4 Industrial Automation
- 5.4.5 Healthcare
- 5.4.6 Other End-user Industries (Metallurgy, agriculture, etc.)
- 5.5 By Geography
- 5.5.1 Asia-Pacific
- 5.5.1.1 China
- 5.5.1.2 India
- 5.5.1.3 Japan
- 5.5.1.4 South Korea
- 5.5.1.5 Australia
- 5.5.1.6 Rest of Asia-Pacific
- 5.5.2 North America
- 5.5.2.1 United States
- 5.5.2.2 Canada
- 5.5.2.3 Mexico
- 5.5.3 Europe
- 5.5.3.1 Germany
- 5.5.3.2 United Kingdom
- 5.5.3.3 France
- 5.5.3.4 Italy
- 5.5.3.5 Nordics
- 5.5.3.6 Rest of Europe
- 5.5.4 South America
- 5.5.4.1 Brazil
- 5.5.4.2 Argentina
- 5.5.4.3 Rest of South America
- 5.5.5 Middle-East and Africa
- 5.5.5.1 Saudi Arabia
- 5.5.5.2 United Arab Emirates
- 5.5.5.3 South Africa
- 5.5.5.4 Rest of Middle-East and Africa
- 5.5.1 Asia-Pacific
6 Competitive Landscape
- 6.1 Market Concentration
- 6.2 Strategic Moves
- 6.3 Market Share (%)/Ranking Analysis
- 6.4 Company Profiles (includes Global level Overview, Market level overview, Core Segments, Financials as available, Strategic Information, Market Rank/Share for key companies, Products and Services, and Recent Developments)
- 6.4.1 Appia REU
- 6.4.2 Arafura Rare Earths
- 6.4.3 China Rare Earth Group Resources Technology Co., Ltd.
- 6.4.4 China Rare Earth Holdings Limited
- 6.4.5 ChinaTungsten
- 6.4.6 Energy Fuels Inc.
- 6.4.7 Iluka Resources Limited
- 6.4.8 Jiangxi Copper Corporation
- 6.4.9 Lynas Rare Earths Ltd
- 6.4.10 Mitsubishi Corporation RtM Japan Ltd.
- 6.4.11 MP Materials
- 6.4.12 Northern Minerals
- 6.4.13 Northern Rare Earth
- 6.4.14 Rio Tinto
- 6.4.15 Shenghe Resources Holding Co., Ltd.
- 6.4.16 Texas Mineral Resources Corp.
- 6.4.17 Ucore Rare Metals Inc.
- 6.4.18 Yuyan Rare Earth New Materials Co., Ltd.
7 Market Opportunities and Future Outlook
- 7.1 White-space and Unmet-need Assessment
- 7.2 Growing innovations in exploration and mining technologies

 稀土元素市場規模、佔有率、成長、全球產業分析、區域趨勢及2026年至2034年預測
 稀土元素市場-2026-2032年全球市場預測全球稀土元素市場規模、佔有率、趨勢和成長分析報告(2026-2034年)
 稀土元素市場規模、佔有率、趨勢和預測:按應用和地區分類,2026-2034年
 2026年全球稀土元素市場報告日本稀土元素市場規模、佔有率、趨勢及按應用和地區分類的預測(2026-2034年)
 全球稀土元素市場:產業分析、規模、佔有率、成長、趨勢與預測(2025-2032)
 重稀土元素:全球市佔率及排名、總收入及需求預測(2025-2031年)
 稀土 (REE) 回收市場預測(至 2032 年):按來源、元素類型、技術、應用和地區分類的全球分析
 稀土元素市場-全球產業規模、佔有率、趨勢、機會及預測(細分、按類型、按應用、按地區、按競爭,2020-2030 年預測)