


 |
市場調查報告書
商品編碼
2035146
新加坡資料中心:市場佔有率分析、產業趨勢與統計及成長預測(2026-2031 年)Singapore Data Center - Market Share Analysis, Industry Trends & Statistics, Growth Forecasts (2026 - 2031) |
||||||
※ 本網頁內容可能與最新版本有所差異。詳細情況請與我們聯繫。
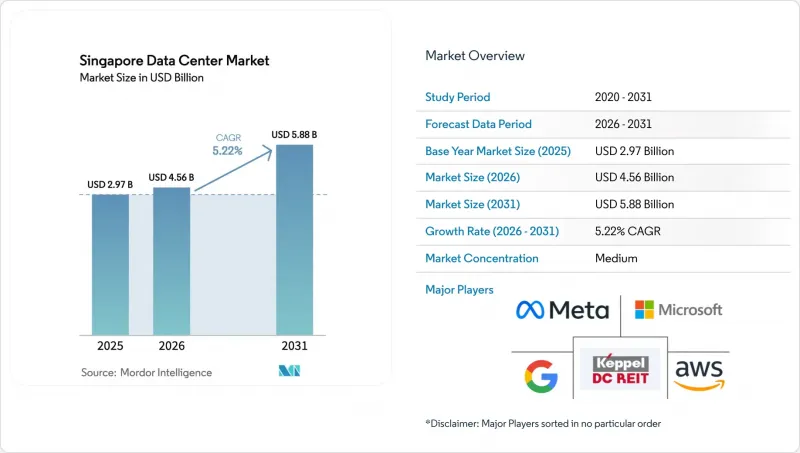
2025年新加坡資料中心市場價值為43.3億美元,預計在預測期(2026-2031年)內將以5.22%的複合年成長率成長,從2026年的45.6億美元成長到2031年的58.8億美元。
就IT負載容量而言,預計市場將從2025年的2970兆瓦成長到2030年的3010兆瓦,預測期間(2025-2030年)的複合年成長率(CAGR)為0.28%。市場佔有率和預測均以兆瓦(MW)為單位計算和報告。儘管土地和電力供應受限,但人工智慧最佳化的基礎設施、超大規模資料中心業者的持續資本投資以及新加坡作為東南亞連接樞紐的地位,都在支撐市場需求。亞馬遜網路服務(AWS)120億新元的擴張計畫和Google累計50億新元的投資承諾進一步鞏固了這一成長勢頭,這兩項舉措都印證了新加坡在東南亞雲端部署領域的主導地位。海底電纜鋪設、密集的運營商中立生態系統以及「綠色」設計的快速核准流程,持續吸引新的工作負載。同時,「綠色資料中心藍圖」促使營運商致力於實現低於1.3的電源使用效率(PUE)。目前,GPU密度高的機架耗電量為40-60kW,推動了浸沒式和液冷技術的維修,在營運效率和永續性方面圖了資料中心的競爭力。在此背景下,營運商在柔佛和巴淡島推行跨境策略,放寬了當地的容量限制,同時由於新加坡無與倫比的網路密度和監管穩定性,仍然對新加坡的機架收取高價。
新加坡資料中心市場趨勢與洞察
超大規模資料中心業者雲端營運商對雲端基礎設施的投資激增
亞馬遜史上規模最大的120億新元專案將於2030年前完成,這將進一步擴大在該地區15年的企業發展,在多個可用區擴展GPU叢集、儲存和低延遲邊緣節點。微軟於2025年3月宣布的AI Pinnacle舉措的擴展也與此趨勢相符,該計畫將基礎設施擴張與人才技能提升相結合。這些數十億美元的投資吸引了交換架構、電池和先進冷卻系統供應商,並在新加坡資料中心市場引發了連鎖的資本投資。如此規模的投資表明,即使超大規模資料中心業者資料中心營運商正在向泰國和馬來西亞等衛星區域擴張,他們仍然將新加坡視為東南亞不可替代的控制中心。因此,批發託管業務的預訂已排至2027年,預租價格達到多年來的最高水平,現有業主也正在增強其議價能力。已經獲得電力容量和土地的營運商正在以溢價收益將稀缺容量貨幣化,進一步提高了後進企業的進入門檻。
人工智慧賦能的高密度機架需求
NVIDIA DGX H100底盤在 8U 機架空間內功耗高達 10.2kW,而 Blackwell B200 單卡功耗超過 1000 瓦,使得機架密度高達 40-60kW,對傳統的水冷系統構成了挑戰。透過與 Nscale 和 Bridge Alliance 的合作,新加坡電信 (Singtel) 提供 GPU 即服務 (GPUaaS) 套餐,該套餐採用直接晶片液冷和浸沒式冷卻艙,並安裝在新加坡電信 (STT Singapore 6) 機房內,從而將 PUE 值保持在 1.03 的低位。新加坡科技工程 (ST Engineering) 位於 Jalan Boon Lay 的機房(計劃於 2027 年交付)標配多種冷卻方案,以滿足不同的加速器發展藍圖。承包AI 機櫃的需求使得業者能夠獲得比標準託管空間高出 10-15% 的價格溢價,即使在可用兆瓦數有限的情況下也能提高每千瓦的收益。金融服務和先進製造業的租戶擴大指定使用液冷式閒置頻段,而 2020 年之前投入運作的設施正在經歷維修週期。
土地和電力供應有限
像泰盛這樣的成熟工業園區,目前的租金已超過每平方英尺每年200新元,迫使企業採用垂直堆疊式設計,從而挑戰樓層承重和電梯容量的極限。能源市場管理局(ESA)將新建設的電力配額限制在每年約200兆瓦,這一上限已在早期許可申請階段就已確定,因此阻礙了新企業的進入。位於北部20公里的柔佛州正利用這項過剩需求,在2025年第二季核准了42個項目,並透過可再生能源配額提供電價獎勵。新加坡現有業者維持對延遲敏感的機架的高價,這些機架必須安裝在市內,同時透過跨境園區部署來確保選擇。然而,土地和電力短缺引發了人們對交付時間延長、緊急成本增加以及如果鄰近市場提前提供替代容量,租戶流失風險增加的擔憂。
細分市場分析
到2025年,大型資料中心將佔新加坡資料中心市場佔有率的16.10%。這反映了專為超大規模資料中心業者資料中心和獨立電腦室設計的機構園區的激增。這些設施具備多維冗餘、現場公用設施以及毗鄰運營商機房的位置,儘管表面上的成長速度有所放緩,但仍保持著較高的租金水平。同時,隨著企業在保持管治控制的同時實現邊緣分析的在地化,中型資料中心預計將以1.17%的複合年成長率成長。平均密度為10-15千瓦的垂直設計最佳化了有限的土地,並充分利用了高層建築中機械、電氣和管道設施的整合;這種模式已在泰盛(Thai Seng)進行了試點。大型和超大型資料中心雖然只佔總容量的25%,但它們透過強制要求48小時的儲能緩衝和園區規模的熱回收循環,正在影響設計標準。
小規模的資料中心正日益專注於為政府機構和演算法交易公司提供高安全性、空氣間隙部署方案。監管障礙,例如新建項目必須獲得「綠建築標誌白金級」認證,推高了5兆瓦以下資料中心的單位資本支出(CAPEX),迫使業主與房地產投資信託基金(REITs)合作資金籌措。從2025年到2030年,新增供應將更集中在夾層擴建和未開發空間的維修,而非新建案。因此,新加坡的資料中心市場將維持啞鈴狀結構:一端是規模龐大的超大規模資料中心,另一端是緊湊型、注重合規性的節點,兩者都由待開發區發展的二級服務生態系統提供支援。
三級資料中心佔新加坡總容量的 82.55%,憑藉其成本和可維護性的最佳平衡,鞏固了新加坡在資料中心市場的主導地位。金融機構和 SaaS 供應商認為,三級資料中心結合雙區域容錯移轉即可滿足需求。然而,四級資料中心預計將以 2.48% 的複合年成長率成長,因為人工智慧訓練中斷可能會中斷長達數週的模型開發週期,造成巨大的機會成本。經 Uptime Institute 認證的四級資料中心在新加坡的租金溢價為 15-20%,但空置率仍維持在 2% 以下。
目前,一級和二級資料中心主要用於部署、開發和測試以及非關鍵工作負載,但隨著客戶服務等級協定 (SLA) 的標準化,這些資料中心也在逐步維修冗餘功能。 GPU叢集放大單點故障 (SPOF) 的影響,因此營運商需要實施四級資料中心的功能,例如獨立電源路徑和雙冷卻迴路。雖然從長遠來看,分階段過渡到四級資料中心是可能,但三級資料中心仍將在成本敏感型領域佔據主導地位,使新加坡資料中心市場能夠保持抵禦國際競爭對手的能力。
《新加坡資料中心市場報告》按資料中心規模(大型、超大型、中型、巨型、小規模)、層級(Tier 1 和 Tier 2、Tier 3、Tier 4)、資料中心類型(超大規模/本地部署、企業/邊緣、託管)、最終用戶(銀行、金融服務和保險 (BFSI)、IT 和 ITES、電子商務、政府、其他地區(新加坡地區)以及 ITES、電子商務區進行市場預測以 IT 負載容量 (MW) 為單位。
其他好處:
- Excel格式的市場預測(ME)表
- 3個月的分析師支持
目錄
第1章:引言
- 研究假設和市場定義
- 調查範圍
第2章:調查方法
第3章執行摘要
第4章 市場狀況
- 市場概覽
- 市場促進因素
- 超大規模資料中心業者雲端營運商對雲端基礎設施的投資激增
- 具備人工智慧功能的高密度機架的需求
- 擴大海底電纜登陸點將促進互聯互通。
- 綠色資料中心藍圖/電力分配獎勵
- 邊緣運算和5G主導的企業工作負載本地化
- 主權運算和金融科技監管正在推動島嶼託管的發展。
- 市場限制因素
- 土地和電力供應有限
- 高昂的電費正在影響營運成本。
- 嚴格的 PUE 標準和永續性要求正在推高資本支出 (CAPEX)。
- 人工智慧/高效能運算營運人員短缺
- 市場展望
- IT負載能力
- 高架空間
- 託管收入
- 已安裝機架數量
- 機架空間利用率
- 海底電纜
- 主要行業趨勢
- 智慧型手機用戶
- 每部智慧型手機的數據流量
- 行動資料通訊速度
- 寬頻資料通訊速度
- 光纖網路
- 法規結構
- 價值鍊和通路分析
- 監理情勢
- 技術展望
- 波特五力分析
- 新進入者的威脅
- 供應商的議價能力
- 買方的議價能力
- 替代品的威脅
- 競爭公司之間的競爭
第5章 市場規模及成長預測(兆瓦)
- 按資料中心規模
- 大規模
- 巨大的
- 中號
- 百萬
- 小規模
- 層級類型
- 一級和二級
- 三級
- 第四級
- 依資料中心類型
- 超大規模/自建
- 企業/邊緣運算
- 搭配
- 未使用
- 使用
- 零售共址
- 批發託管
- 最終用戶
- BFSI
- 資訊科技與資訊科技服務
- 電子商務
- 政府
- 製造業
- 媒體與娛樂
- 溝通
- 其他最終用戶
- 透過熱點
- 裕廊
- 太仙
- 林地
- 新加坡其他地區
第6章 競爭情勢
- 市場集中度
- 策略趨勢
- 市佔率分析
- 公司簡介
- Amazon Web Services Inc.
- Google LLC
- Microsoft Corporation
- Meta Platforms Inc.
- Keppel DC REIT Management Pte Ltd.
- Equinix Inc.
- STT GDC Pte Ltd.
- Digital Realty Trust Inc.
- Singapore Telecommunications Ltd.(Nxera)
- AirTrunk Operating Pty Ltd.
- SAP SE
- Tencent Cloud Computing(Beijing)Co. Ltd.
- Global Switch Holdings Limited
- 1-Net Singapore Pte Ltd.
- Princeton Digital Group
第7章 市場機會與未來展望
The Singapore Data Center Market size was valued at USD 4.33 billion in 2025 and estimated to grow from USD 4.56 billion in 2026 to reach USD 5.88 billion by 2031, at a CAGR of 5.22% during the forecast period (2026-2031).
In terms of the IT load capacity, the market is expected to grow from 2.97 thousand megawatts in 2025 to 3.01 thousand megawatts by 2030, at a CAGR of 0.28% during the forecast period (2025-2030). The market segment shares and estimates are calculated and reported in terms of MW. Artificial-intelligence-optimized infrastructure, sustained hyperscaler capital expenditure, and Singapore's role as Southeast Asia's connectivity hub anchor demand even as land and power constraints tighten supply. Momentum is reinforced by Amazon Web Services' SGD 12 billion expansion pledge and Google's cumulative USD 5 billion commitment, both of which underline the city-state's primacy for regional cloud deployments. Subsea cable build-outs, a dense carrier-neutral ecosystem, and expedited permitting for "green" designs continue to attract new workloads, while the Green Data Centre Roadmap keeps operators focused on power-usage effectiveness targets of less than 1.3. GPU-rich racks now draw 40-60 kW, prompting immersion and liquid cooling retrofits that differentiate facilities on operating efficiency and sustainability credentials. Against this backdrop, operators pursue cross-border strategies in Johor and Batam to mitigate local capacity caps yet still price Singapore racks at a premium due to unparalleled network density and regulatory stability.
Singapore Data Center Market Trends and Insights
Heightened Hyperscaler Cloud CapEx Surge
Amazon's record SGD 12 billion program, earmarked through 2030, extends its 15-year presence and scales GPU clusters, storage, and low-latency edge nodes across multiple availability zones. Microsoft's March 2025 expansion of the AI Pinnacle initiative aligns with this trajectory by pairing infrastructure additions with workforce upskilling commitments. Such multi-billion-dollar commitments crowd-in suppliers of switching fabric, battery-energy storage, and advanced cooling, creating a capex multiplier across the Singapore data center market. The scale of spend suggests that hyperscalers view Singapore as an irreplaceable Southeast Asian control plane, even as they activate satellite regions in Thailand and Malaysia. Consequently, wholesale-colocation pipelines are booked out through 2027, pushing pre-lease rates to multi-year highs and consolidating bargaining power among established landlords. Operators that already hold power allocations and land parcels monetize scarce capacity at premium yields, reinforcing barriers to entry for latecomers.
AI-Ready High-Density Rack Demand
NVIDIA DGX H100 chassis consumes up to 10.2 kW in 8U, and Blackwell B200 cards exceed 1,000 watts each, escalating rack densities to 40-60 kW and challenging legacy chilled-water systems. Singtel, through partnerships with Nscale and Bridge Alliance, is offering GPU-as-a-Service bundles that utilize direct-to-chip liquid cooling and immersion pods hosted in STT Singapore 6, achieving a PUE as low as 1.03. ST Engineering's Jalan Boon Lay build, slated for 2027 delivery, bakes in manifold cooling options to accommodate heterogeneous accelerator roadmaps. Demand for turnkey AI cages has enabled operators to capture a 10-15% pricing premium versus standard colocation footprints, boosting revenue per kW even as available megawatts remain capped. Financial services and advanced manufacturing tenants increasingly specify liquid-ready whitespace, prompting retrofit cycles in facilities commissioned before 2020.
Limited Land and Power Supply Constraints
Industrial-zoned plots in mature hubs, such as Tai Seng, now exceed SGD 200 per square foot annually, compelling vertical stack designs that push the floor loading and elevator capacity engineering envelopes. The Energy Market Authority restricts new-build allocations to roughly 200 MW per year, a cap already pre-committed by projects in early-stage permitting, thus stalling greenfield entrants. Johor, located 20 kilometers north, capitalizes on overflow by approving 42 projects in Q2 2025 and offering tariff relief via renewable-energy quotas. Singapore incumbents secure optionality through cross-border campuses while preserving premium price points for latency-sensitive racks that must reside within city limits. However, the land-and-power squeeze elongates delivery lead times, inflates contingency budgets, and amplifies tenant churn risk if alternative capacity opens sooner in neighboring markets.
Other drivers and restraints analyzed in the detailed report include:
- Subsea Cable Landing Expansion Boosting Interconnection
- Green Data Centre Roadmap Power Allocation Incentives
- High Electricity Tariffs Impacting OPEX
For complete list of drivers and restraints, kindly check the Table Of Contents.
Segment Analysis
Large facilities captured 16.10% of the Singapore data center market share in 2025, reflecting the prevalence of institutional-grade campuses designed for hyperscaler pods and sovereign compute enclosures. Their multidimensional redundancy, on-site utilities, and carrier-hotel-adjacent footprints sustain premium lease rates despite slower headline growth. Medium-sized sites, however, are forecast to expand at a 1.17% CAGR as enterprises regionalize edge analytics while retaining governance control. Vertical designs with an average density of 10-15 kW optimize scarce land and leverage high-rise mechanical, electrical, and plumbing stacks, an approach already piloted in Tai Seng. Massive and mega-scale categories, despite occupying only 25% of the capacity, influence design norms by mandating 48-hour energy-storage buffers and campus-scale heat-recovery loops.
Smaller footprints are increasingly specializing in high-security, air-gapped deployments for government agencies and algorithmic trading firms. Regulatory hurdles, including Green Mark Platinum for new build permits, raise unit CAPEX for sub-5 MW sites, nudging owners to partner with REITs for financing. Between 2025 and 2030, supply additions focus on mezzanine expansions and white-space retrofits rather than greenfield acreage. Consequently, the Singapore data center market maintains a barbell structure: sprawling hyperscale blocks at one end and compact, compliance-driven nodes at the other, each supported by a thriving secondary services ecosystem.
Tier 3 installations comprised 82.55% of total capacity and underpin the Singapore data center market share leadership due to their sweet-spot balance between cost and concurrently maintainable operations. Financial institutions and software-as-a-service vendors view Tier 3 as sufficient when paired with dual-region failover. Nevertheless, Tier 4 is expected to record a 2.48% CAGR, as AI training outages can derail multi-week model development cycles and incur heavy opportunity costs. Uptime-Institute-verified Tier 4 halls command 15-20% rental premiums yet enjoy sub-2% vacancy in Singapore.
Tier 1 and Tier 2 footprints now primarily cater to staging, development-test, and non-critical workloads, but even these sites are gradually being retrofitted with higher redundancy as clients standardize their service-level agreements. GPU clusters magnify the repercussions of single-point-of-failure, pressuring operators to deploy independent electrical paths and twin cooling loops characteristic of Tier 4. Over the long term, a measured migration toward Tier 4 is likely, but cost-sensitive segments will preserve the bulk of Tier 3 dominance, which keeps the Singapore data center market resilient against offshore competition.
The Singapore Data Center Market Report is Segmented by Data Center Size (Large, Massive, Medium, Mega, and Small), Tier Type (Tier 1 and 2, Tier 3, and Tier 4), Data Center Type (Hyperscale/Self-built, Enterprise/Edge, and Colocation), End User (BFSI, IT and ITES, E-Commerce, Government, and More), and Hotspot (Jurong, Tai Seng, Woodlands, and Rest of Singapore). The Market Forecasts are Provided in Terms of IT Load Capacity (MW).
List of Companies Covered in this Report:
- Amazon Web Services Inc.
- Google LLC
- Microsoft Corporation
- Meta Platforms Inc.
- Keppel DC REIT Management Pte Ltd.
- Equinix Inc.
- STT GDC Pte Ltd.
- Digital Realty Trust Inc.
- Singapore Telecommunications Ltd. (Nxera)
- AirTrunk Operating Pty Ltd.
- SAP SE
- Tencent Cloud Computing (Beijing) Co. Ltd.
- Global Switch Holdings Limited
- 1-Net Singapore Pte Ltd.
- Princeton Digital Group
Additional Benefits:
- The market estimate (ME) sheet in Excel format
- 3 months of analyst support
TABLE OF CONTENTS
1 INTRODUCTION
- 1.1 Study Assumptions and Market Definition
- 1.2 Scope of the Study
2 RESEARCH METHODOLOGY
3 EXECUTIVE SUMMARY
4 MARKET LANDSCAPE
- 4.1 Market Overview
- 4.2 Market Drivers
- 4.2.1 Heightened hyperscaler cloud CapEx surge
- 4.2.2 AI-ready high-density rack demand
- 4.2.3 Subsea-cable landing expansion boosting interconnection
- 4.2.4 Green Data Centre Roadmap power-allocation incentives
- 4.2.5 Edge- and 5G-led enterprise workload localization
- 4.2.6 Sovereign compute and fintech regulations driving on-island hosting
- 4.3 Market Restraints
- 4.3.1 Limited land and power-supply constraints
- 4.3.2 High electricity tariffs impacting OPEX
- 4.3.3 Strict PUE and sustainability mandates raising CAPEX
- 4.3.4 Talent shortage for AI/HPC operations
- 4.4 Market Outlook
- 4.4.1 IT Load Capacity
- 4.4.2 Raised Floor Space
- 4.4.3 Colocation Revenue
- 4.4.4 Installed Racks
- 4.4.5 Rack Space Utilization
- 4.4.6 Submarine Cable
- 4.5 Key Industry Trends
- 4.5.1 Smartphone Users
- 4.5.2 Data Traffic Per Smartphone
- 4.5.3 Mobile Data Speed
- 4.5.4 Broadband Data Speed
- 4.5.5 Fiber Connectivity Network
- 4.5.6 Regulatory Framework
- 4.6 Value Chain and Distribution Channel Analysis
- 4.7 Regulatory Landscape
- 4.8 Technological Outlook
- 4.9 Porter's Five Forces Analysis
- 4.9.1 Threat of New Entrants
- 4.9.2 Bargaining Power of Suppliers
- 4.9.3 Bargaining Power of Buyers
- 4.9.4 Threat of Substitutes
- 4.9.5 Competitive Rivalry
5 MARKET SIZE AND GROWTH FORECASTS (MEGAWATT)
- 5.1 By Data Center Size
- 5.1.1 Large
- 5.1.2 Massive
- 5.1.3 Medium
- 5.1.4 Mega
- 5.1.5 Small
- 5.2 By Tier Type
- 5.2.1 Tier 1 and 2
- 5.2.2 Tier 3
- 5.2.3 Tier 4
- 5.3 By Data Center Type
- 5.3.1 Hyperscale/Self-built
- 5.3.2 Enterprise/Edge
- 5.3.3 Colocation
- 5.3.3.1 Non-Utilized
- 5.3.3.2 Utilized
- 5.3.3.2.1 Retail Colocation
- 5.3.3.2.2 Wholesale Colocation
- 5.4 By End User
- 5.4.1 BFSI
- 5.4.2 IT and ITES
- 5.4.3 E-Commerce
- 5.4.4 Government
- 5.4.5 Manufacturing
- 5.4.6 Media and Entertainment
- 5.4.7 Telecom
- 5.4.8 Other End Users
- 5.5 By Hotspot
- 5.5.1 Jurong
- 5.5.2 Tai Seng
- 5.5.3 Woodlands
- 5.5.4 Rest of Singapore
6 COMPETITIVE LANDSCAPE
- 6.1 Market Concentration
- 6.2 Strategic Moves
- 6.3 Market Share Analysis
- 6.4 Company Profiles (includes Global level Overview, Market level overview, Core Segments, Financials as available, Strategic Information, Market Rank/Share for key companies, Products and Services, and Recent Developments)
- 6.4.1 Amazon Web Services Inc.
- 6.4.2 Google LLC
- 6.4.3 Microsoft Corporation
- 6.4.4 Meta Platforms Inc.
- 6.4.5 Keppel DC REIT Management Pte Ltd.
- 6.4.6 Equinix Inc.
- 6.4.7 STT GDC Pte Ltd.
- 6.4.8 Digital Realty Trust Inc.
- 6.4.9 Singapore Telecommunications Ltd. (Nxera)
- 6.4.10 AirTrunk Operating Pty Ltd.
- 6.4.11 SAP SE
- 6.4.12 Tencent Cloud Computing (Beijing) Co. Ltd.
- 6.4.13 Global Switch Holdings Limited
- 6.4.14 1-Net Singapore Pte Ltd.
- 6.4.15 Princeton Digital Group
7 MARKET OPPORTUNITIES AND FUTURE OUTLOOK
- 7.1 White-space and Unmet-Need Assessment
 全球資料中心市場規模、佔有率、趨勢和成長分析報告(2026-2034年)
 資料中心基礎設施管理軟體市場 - 全球產業規模、佔有率、趨勢、機會、預測:按組件、部署類型、垂直市場、地區和競爭對手分類,2021-2031 年資料中心市場 - 全球產業規模、佔有率、趨勢、機會、預測:按類型、密度、最終用戶、地區和競爭格局分類,2021-2031年
 2026年全球水下資料中心市場報告2026年全球光纖連接服務工具市場報告2026年全球行動雙倍數據速率(DDR)市場報告
 永續資料中心市場預測至2034年-全球分析(按組件、資料中心類型、容量、部署模式、永續發展舉措、冷卻技術、最終用戶和地區分類)
 資料中心基礎設施管理 (DCIM) 軟體市場:全球和區域分析:按產品、應用和國家分類 - 分析和預測 (2026–2036)
 2026-2030年全球資料中心市場
 在軌資料中心市場展望